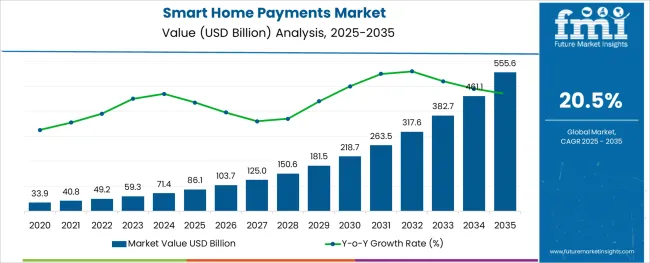
The Smart Home Payments Market is estimated to be valued at USD 86.1 billion in 2025 and is projected to reach USD 555.6 billion by 2035, registering a compound annual growth rate (CAGR) of 20.5% over the forecast period.

The stainless steel valve tag market is expanding steadily as industrial sectors prioritize asset management, safety compliance, and equipment traceability. Increasing investments in infrastructure and process automation have heightened demand for robust and clear identification solutions capable of withstanding harsh environments.
The shift toward digital transformation in industries such as oil and gas, manufacturing, and utilities is encouraging the adoption of advanced tagging systems that support maintenance and audit operations. Growing awareness around regulatory compliance for equipment labeling and enhanced safety protocols is also influencing market expansion.
The rise of e-commerce platforms has facilitated easier procurement of valve tags, increasing accessibility for small to medium enterprises and broadening geographic reach. Material innovations and customization options continue to enhance product longevity and visibility, creating opportunities for market penetration across diverse industrial applications.
The market is segmented by Payment Type and Application and region. By Payment Type, the market is divided into Mobile Payment, Digital Wallet, and Online Banking. In terms of Application, the market is classified into Connected Appliance Payments, Connected TV Payments, and Smart Speaker Payments. Regionally, the market is classified into North America, Latin America, Western Europe, Eastern Europe, Balkan & Baltic Countries, Russia & Belarus, Central Asia, East Asia, South Asia & Pacific, and the Middle East & Africa.
The market is segmented by Payment Type and Application and region. By Payment Type, the market is divided into Mobile Payment, Digital Wallet, and Online Banking. In terms of Application, the market is classified into Connected Appliance Payments, Connected TV Payments, and Smart Speaker Payments. Regionally, the market is classified into North America, Latin America, Western Europe, Eastern Europe, Balkan & Baltic Countries, Russia & Belarus, Central Asia, East Asia, South Asia & Pacific, and the Middle East & Africa.
The less than 30 mm thickness segment is expected to hold 41.3% of the revenue share in 2025 within the thickness category. This segment’s leadership is supported by its suitability for a wide range of valve sizes and equipment types, providing sufficient durability while minimizing material costs.
The thinner tags offer flexibility in installation, especially in tight spaces and complex piping systems, making them preferable for industries where compactness is critical. Their compatibility with standard mounting hardware and ability to endure corrosion and wear have reinforced demand in sectors emphasizing both performance and cost efficiency.
This balance between robustness and adaptability has contributed to the segment’s dominant position.
Within the product type category, engraved valve tags are projected to command 57.8% of the market revenue share in 2025, marking them as the leading product form. The prominence of engraved tags is due to their superior legibility, permanence, and resistance to environmental degradation such as fading, scratching, and chemical exposure.
Engraving allows precise and customizable marking, meeting stringent industry standards for traceability and safety. The technique supports complex information including serial numbers, barcodes, and QR codes, enhancing integration with digital asset management systems.
Manufacturers’ emphasis on delivering long-lasting, tamper-proof tags that reduce maintenance costs has reinforced the adoption of engraved tags in heavy industries.
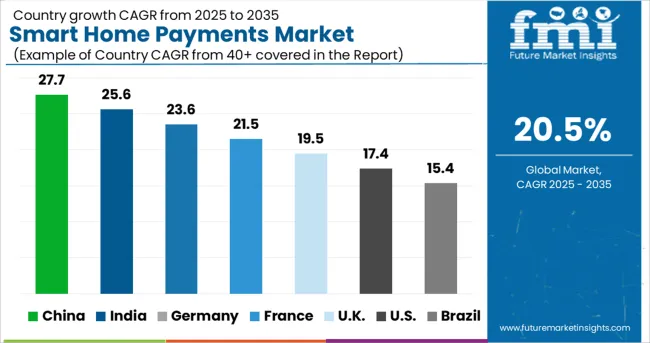
The smart home payments market expects Asia-Pacific to be profitable. By 2025, India and China will account for approximately 69% of global digital wallet transactions. By 2035, the Chinese market is expected to grow at a highly accelerated CAGR of around 19.9%, with an absolute dollar opportunity of USD 19.2 Billion.
Even Japan is expected to grow rapidly, with a CAGR of more than 18.9%, to reach a total market valuation of USD 555.6 billion by the end of 2035 in the smart home payments market. These factors are expected to benefit Asia-Pacific smart home payments market growth. The Asia Pacific is expected to be the fastest-growing region. The region's countries have taken significant steps to strengthen the payment industry.

The North American region is expected to maintain its market share of around 40.8% in the global smart home payments market during the forecast years. The demand for smart payments has skyrocketed in developed regions such as North America.
It is expected that by 2025, 48.4% of US households will have at least one smart home device. As of 2025, approximately 43% of the Canadian population using at least one digital payment provider used Google Pay for E-commerce transactions, and this figure is expected to rise further in the coming years. In the coming years, all of these factors are expected to benefit the North American smart home payments market.
In terms of market size, the European smart home payments market is the largest but highly fragmented due to the use of multiple currencies and languages. The region is home to a diverse range of countries, from economically and technologically advanced nations like the United Kingdom and Germany to heavily indebted nations like Venezuela. The leaders are the United Kingdom, Poland, Spain, and Germany.
Amazon.com Inc. announced a new collaboration for Alexa in July 2025, along with features such as a collection of SDKs (software development kits) and a collection of APIs. The reasoning behind this is to increase Alexa's versatility.
Google LLC announced Virtual Cards for Chrome Autofill Users, a first-of-its-kind digital wallet for Android users, in May 2025. Its design and conceptualization aim to improve the process of its users accessing and saving payment cards, vaccine passports, transit, and even tickets.
The global market for Smart Home Payments expanded at a CAGR of 50.8% during 2020 to 2024. The market growth is projected to benefit from the expedited requirement of the digital wallets payment type as well as with the surge in the smart home appliances demand in the forthcoming years.
The global Smart Home Payment market is predicted to surge ahead at a CAGR of 20.5% and record sales worth USD 555.6 Billion by the end of 2035. US will continue to be the largest market throughout the analysis period accounting for over USD 94.3 Billion absolute dollar opportunity in the coming 10-year epoch.
Why does Asia-Pacific Stand as the Most Lucrative Market for Smart Home Payments?
During the upcoming 10-year forecast, Asia-Pacific is expected to be lucrative for the Global Smart Home Payments Market. By 2025, it is anticipated that together India and China will account for approximately 69% of the global digital wallet transactions taking place.
As of 2024 digital payments with 45.4% share have been the leading e-commerce transaction method in India. This share is further expected to rise to over 52.9% by 2025. Additionally, it is reported that as of 2024, around USD 181.5 Million digital payments is projected to witness an extensive surge to reach USD 1 Trillion by 2029.
Furthermore, relative to the 67% share of the total Television shipments by the end of 2024, smart televisions account for 84% of the total share as of 2024. The Smart Home Payments Market in China is set to witness a highly accelerated CAGR of around 19.9% coupled with an absolute dollar opportunity of USD 19.2 Billion by the end of 2035.
Even Japan is projected for a highly accelerated growth with a CAGR of over 18.9% to reach a total market valuation of USD 18.7 Billion in the Smart Home Payments Market by the end of 2035. These factors are anticipated to be beneficial for the growth of the Global Smart Home Payments Market in Asia-Pacific.
It is anticipated that during the forthcoming forecast years the North-American region is to keep its market share of around 40.8% intact in the Global Smart Home Payments Market. A recent report stated that approximately 82% of consumers use digital payments as of 2024.
As of the first quarter of 2025, the Bank of America has witnessed an extensive surge of 34% in the users and associated interactions of its virtual financial assistant, Erica, particularly with issues related to payment transactions.
By 2025, it is estimated that 48.4% of the households in the USA will be in possession of at least one smart home device. As of 2025, approximately 43% of the cohort of the population in Canada using the services of at least one digital payment provider use Google Pay for E-commerce transactions, which is to further increase in the forthcoming years.
As of 2025, approximately 33.9 Million connected television appliances are in USA households, witnessing a 181.5 Million surge compared to that of 2020. Moreover, of the total connected television users, 58.3% use Smart televisions. All of these facets are expected to be advantageous for the North American Smart Home Payments market in the forthcoming years.

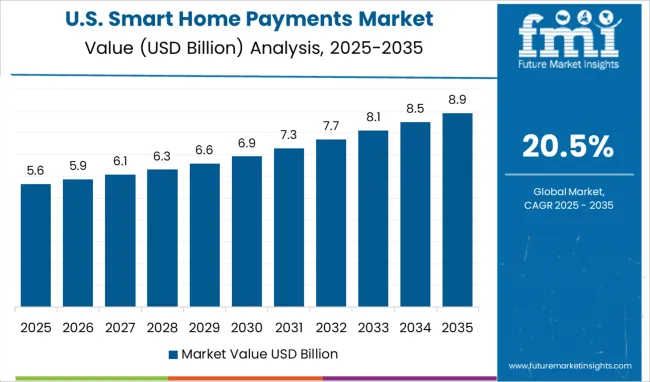
The USA commands approximately around 36% market share in the Global Smart Home Payments Market and is expected to retain its dominance during the upcoming 10-year epoch. It is estimated that the market in the country is expected to witness a CAGR of 20.3% coupled with an absolute dollar opportunity of USD 555.6 Billion to reach a total market valuation of USD 11.9 Billion by the end of 2035.
According to recent statistics, approximately 48% of the populace using the internet in the USA owned at least a smart speaker in 2024, which has witnessed a 71% increase in only the past two years.
Smart speakers are among the crucial attributes of the Smart Home Payments market since they have the ability to provide consumers with voice payment features. Taking into account data published in a recent report, 4 in every 10 Americans are in the habit of using voice assistants for e-commerce-related transactions.
Another factor responsible for the growth of the Smart Home Payments Market in the USA is the intercontinental payment facility offered by digital payment providers. The recent update of Google Pay, allows its USA customers to send money over to India and Singapore.
A 2025 article published by Insider Intelligence states that by 2025 the cohort of digital banking users in the USA is to expand from over 86.1 Million as of 2025 to 86.1 Million by 2025, subsequently reaching a share of 80.4%., and effectively benefiting the online banking segment by payment type of the Smart Home Payment market.
These attributes are anticipated to be beneficial for the USA Smart Home Payments Market in the forthcoming years.
The Digital Wallet segment of the Smart Home Payments Market is expected to witness a highly accelerated CAGR of 20.6% during the forthcoming years. This growth stems from the additional uses a digital wallet service provider equips the customer with. Lucrative offers such as loyalty vouchers, profitable reward points, the ability to book flight tickets, and movie tickets are among the several features responsible for the attractiveness of this segment.
Findings of a recent survey state that by 2025, the total cohort of unique digital wallet users across the world will surge ahead from 2.6 Billion in 2024, to surpass approximately 4.4 Billion users. The report further revealed that by 2025, transactions associated with QR Codes will be accounting for around 40% of all global digital wallet payments and transactions.
This prominence stems from the ease of usage and acceptance associated with these payments. These attributes are responsible for propelling the Digital Wallet segment by Payment Type of the Smart Home Payments Market in the forthcoming years.
The Connected Appliance Payments application of the Smart Home Payments market is anticipating extensive growth with 19.7% CAGR in the upcoming 10-years period. Among the attributes responsible to drive the Connected Appliance Payments application, there is a surge in the usage of appliances such as Smart Thermostats and Touchless Tech, including touchless doorbells.
Recent news states that as of 2024, approximately 2 Billion connected appliances are being used in India, which is propelling the advancements in Connected Appliance Payments.
Among the various factors fueling the requirement for these Connected Appliances, the surge in automation and dependence on technology which is ever-increasing coupled with rising smartphone penetration takes precedence. The total cohort of households with smart home systems is anticipated to reach a total of 86.1 Million by 2025.
Findings of a recent report estimate that the total cohort of homes with smart systems across the world is projected to increase to reach an approximate value of over 86.1 Million by 2025. These attributes are projected to be advantageous for the growth of the Connected Appliance Payments application of the Smart Home Payments Market in the forthcoming years.

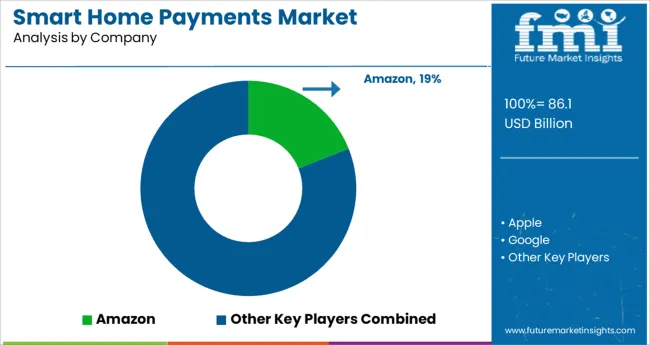
Amazon.com Inc., Apple Inc., Google LLC, LG Electronics Inc., Mastercard Inc., NMI, Inside Secure, EBizCharge, Ingenico Group S.A., Heartland Payment Systems Inc., Baidu Inc., Xiaomi Corporation, Samsung Group, and Lenovo Group Limited, are among the key players worldwide driving the competitive landscape of the market.
To expand their product portfolio and simultaneously capitalize on the growing market demand, many of these companies are adopting strategies such as mergers, acquisitions, and partnerships.
The Smart Home Payments Market is segmented based on payment type, application, and region.
The global smart home payments market is estimated to be valued at USD 86.1 billion in 2025.
It is projected to reach USD 555.6 billion by 2035.
The market is expected to grow at a 20.5% CAGR between 2025 and 2035.
The key product types are mobile payment, digital wallet and online banking.
connected appliance payments segment is expected to dominate with a 36.0% industry share in 2025.


Full Research Suite comprises of:
Market outlook & trends analysis
Interviews & case studies
Strategic recommendations
Vendor profiles & capabilities analysis
5-year forecasts
8 regions and 60+ country-level data splits
Market segment data splits
12 months of continuous data updates
DELIVERED AS:
PDF EXCEL ONLINE
Smart Vision Processing Chips Market Size and Share Forecast Outlook 2025 to 2035
Smart Touch Screen Scale Market Size and Share Forecast Outlook 2025 to 2035
Smart Magnetic Drive Conveyor System Market Size and Share Forecast Outlook 2025 to 2035
Smart Wheelchair market Size and Share Forecast Outlook 2025 to 2035
Smart Mining Technologies Market Size and Share Forecast Outlook 2025 to 2035
Smart Parking Market Size and Share Forecast Outlook 2025 to 2035
Smart Digital Valve Positioner Market Forecast and Outlook 2025 to 2035
Smart Card IC Market Size and Share Forecast Outlook 2025 to 2035
Smart-Tag Inlay Inserters Market Analysis - Size and Share Forecast Outlook 2025 to 2035
Smart TV Market Forecast and Outlook 2025 to 2035
Smart/AI Toy Market Size and Share Forecast Outlook 2025 to 2035
Smart Locks Market Size and Share Forecast Outlook 2025 to 2035
Smart Sprinkler Controller Market Size and Share Forecast Outlook 2025 to 2035
Smart Indoor Gardening System Market Size and Share Forecast Outlook 2025 to 2035
Smart Building Delivery Robot Market Size and Share Forecast Outlook 2025 to 2035
Smart Watch Market Size and Share Forecast Outlook 2025 to 2035
Smart Label Market Size and Share Forecast Outlook 2025 to 2035
Smart Mat Market Size and Share Forecast Outlook 2025 to 2035
Smart Water Management Market Size and Share Forecast Outlook 2025 to 2035
Smart Built-In Kitchen Appliance Market Size and Share Forecast Outlook 2025 to 2035

Thank you!
You will receive an email from our Business Development Manager. Please be sure to check your SPAM/JUNK folder too.
Chat With
MaRIA