LNG Liquefaction Equipment Market Size and Share Forecast Outlook 2025 to 2035

The LNG Liquefaction Equipment Market is estimated to be valued at USD 25.4 billion in 2025 and is projected to reach USD 55.9 billion by 2035, registering a compound annual growth rate (CAGR) of 8.2% over the forecast period.
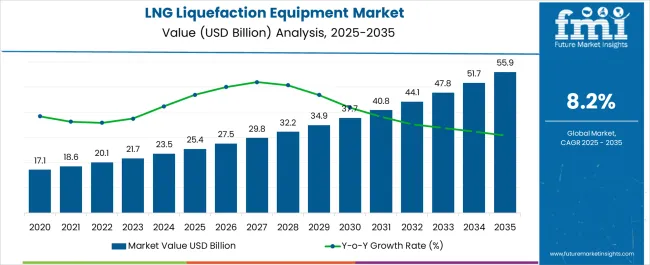
Quick Stats for LNG Liquefaction Equipment Market

  • LNG Liquefaction Equipment Market Value (2025): USD 25.4 billion
  • LNG Liquefaction Equipment Market Forecast Value (2035): USD 55.9 billion
  • LNG Liquefaction Equipment Market Forecast CAGR: 8.2%
  • Leading Segment in LNG Liquefaction Equipment Market in 2025: Refrigerant Compressor System (37.2%)
  • Key Growth Regions in LNG Liquefaction Equipment Market: North America, Asia-Pacific, Europe
  • Top Key Players in LNG Liquefaction Equipment Market: Air Products and Chemicals, Linde Group, ConocoPhillips Company, Atlas Copco, Ingersoll Rand, General Electric, Kobelco Compressors, Chart Energy and Chemicals, Elliott, MITSUI E&S, MCO, IHI Corporation

Lng Liquefaction Equipment Market Market Value Analysis

LNG Liquefaction Equipment Market Key Takeaways

Metric Value
LNG Liquefaction Equipment Market Estimated Value in (2025 E) USD 25.4 billion
LNG Liquefaction Equipment Market Forecast Value in (2035 F) USD 55.9 billion
Forecast CAGR (2025 to 2035) 8.2%

Why is the LNG Liquefaction Equipment Market Growing?

The LNG Liquefaction Equipment market is experiencing significant growth, driven by increasing global demand for liquefied natural gas as a cleaner energy alternative and as a means to diversify energy supply. Investments in liquefaction infrastructure are being supported by rising energy consumption in emerging economies and long-term natural gas contracts between producers and importers. The adoption of advanced equipment and systems enables higher efficiency, lower energy consumption, and enhanced reliability in LNG production.

Technological advancements, including modular plant designs, improved refrigerant management, and automation, are enhancing operational performance while reducing environmental impact. Integration of high-capacity compressors and optimized liquefaction processes ensures scalability for different plant sizes.

Growing interest in mid-scale and small-scale LNG plants to serve niche or regional markets is further shaping demand With continued focus on decarbonization, energy security, and operational efficiency, the LNG liquefaction equipment market is poised for sustained expansion, driven by innovations in systems, equipment, and process optimization.

Segmental Analysis

The lng liquefaction equipment market is segmented by systems, equipment manufacturer, plant size, and geographic regions. By systems, lng liquefaction equipment market is divided into Refrigerant Compressor System, Pumping And Storage System, Power System, and Other Auxiliary System. In terms of equipment manufacturer, lng liquefaction equipment market is classified into Plant Manufacturer and Assembly Manufacturer. Based on plant size, lng liquefaction equipment market is segmented into Mid-Scale LNG Plants (>0.25 To <2.0 MTPA), Small LNG Plants (<0.25 MTPA), Large LNG Plants (>2.0 MTPA), and FLNG Plants (Offshore Floating Plants). Regionally, the lng liquefaction equipment industry is classified into North America, Latin America, Western Europe, Eastern Europe, Balkan & Baltic Countries, Russia & Belarus, Central Asia, East Asia, South Asia & Pacific, and the Middle East & Africa.
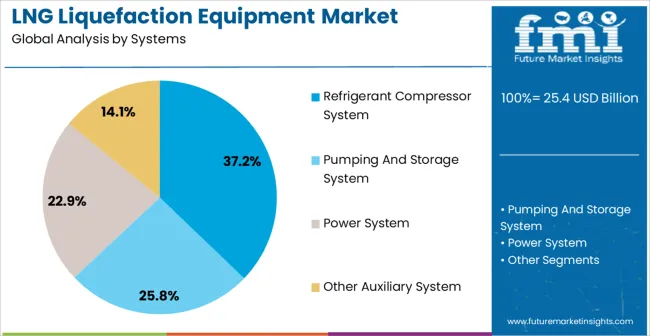
Insights into the Refrigerant Compressor System Systems Segment

Lng Liquefaction Equipment Market Analysis By Systems

The refrigerant compressor system segment is projected to hold 37.2% of the LNG liquefaction equipment market revenue in 2025, establishing it as the leading systems category. Growth in this segment is being driven by the critical role these compressors play in the liquefaction cycle, enabling efficient cooling and gas-to-liquid conversion while maintaining operational stability.

Technological advancements in compressor design, energy efficiency, and reliability have improved performance and reduced downtime, supporting widespread adoption in both new and retrofitted LNG plants. The modular and scalable nature of these systems allows for integration with mid-scale and large-scale liquefaction facilities.

Increasing investments in energy-efficient solutions and lower lifecycle costs have further reinforced their market position With global LNG demand rising and operational efficiency becoming a priority, refrigerant compressor systems are expected to maintain their leadership position, providing critical functionality that underpins plant performance and energy optimization in liquefaction operations.
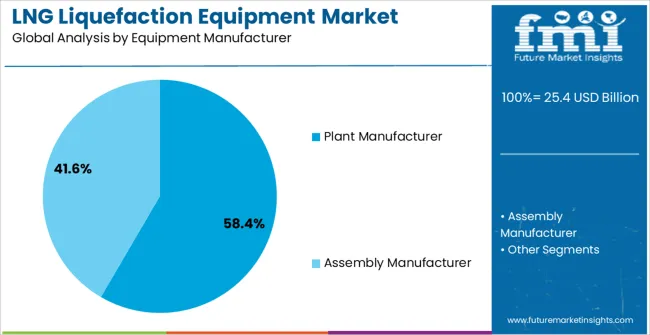
Insights into the Plant Manufacturer Equipment Manufacturer Segment

Lng Liquefaction Equipment Market Analysis By Equipment Manufacturer

The plant manufacturer segment is anticipated to account for 58.4% of the LNG liquefaction equipment market revenue in 2025, making it the largest equipment manufacturer category. Growth in this segment is being supported by increasing demand for turnkey solutions, design expertise, and integrated systems that enable optimized plant performance.

Manufacturers offering comprehensive engineering, procurement, and construction capabilities are gaining preference due to their ability to deliver reliable, efficient, and scalable liquefaction facilities. These manufacturers are investing in technology development to improve energy efficiency, reduce emissions, and ensure long-term operational reliability.

Strategic collaborations with equipment suppliers and technology licensors further enhance their competitiveness As mid-scale LNG plants expand and new projects are commissioned globally, plant manufacturers are expected to remain the dominant equipment provider, driven by their proven track record, integrated solutions, and capability to meet evolving market requirements.
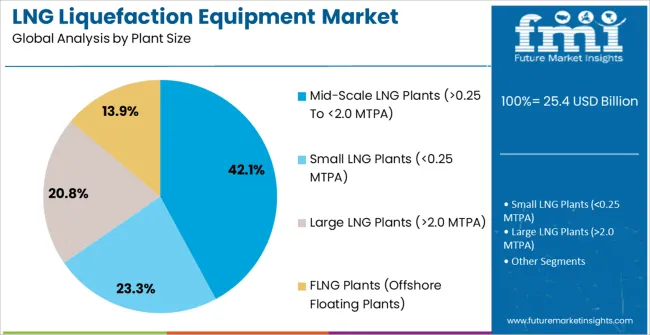
Insights into the Mid-Scale LNG Plants (>0.25 To <2.0 MTPA) Plant Size Segment

Lng Liquefaction Equipment Market Analysis By Plant Size

The mid-scale LNG plants segment is projected to hold 42.1% of the market revenue in 2025, establishing it as the leading plant size category. Its prominence is being driven by the growing need for flexible and cost-effective liquefaction capacity that can serve regional markets, smaller import terminals, or niche industrial applications.

Mid-scale plants offer faster project execution timelines, lower capital expenditure, and scalable operation, making them suitable for markets with moderate demand. Technological advancements in modular construction, compact liquefaction systems, and efficient refrigerant management enable reliable performance at reduced costs.

Rising adoption of mid-scale plants is further supported by energy security initiatives, regional natural gas production, and increasing LNG trade flows As global demand for liquefied natural gas continues to diversify across emerging and developed markets, mid-scale LNG plants are expected to remain a key growth driver, providing operational flexibility, optimized efficiency, and faster returns on investment.

Market Overview

Global LNG Liquefaction Equipment Market: Introduction

Liquefied natural gas (LNG) is the liquid form of natural gas at cryogenic temperature of −161°C (−157°C). Liquefaction of natural gas shrinks its volume by a factor of approximately 600 hence, allowing easy and economical transport over long distances.

The set of equipment aligned in series, designed to treat and liquefy natural gas are known as LNG train. With the increasing demand of LNG as the source of fuel, the global LNG liquefaction equipment market has grown steadily in the past few years.

The LNG liquefaction equipment accounts up to total 30% total project cost of a liquefaction plant. Hence, LNG liquefaction equipment has been a key area in constant need of innovation and development to save cost, increase LNG plant capacity and improving pant efficiency.

Natural gas is one of the world’s most needed feedstock and with the ever growing demand of clean energy source LNG demand is rising, hence driving the LNG liquefaction equipment market. The LNG liquefaction equipment market possesses pronounced growth opportunities for the growth of new as well as established players.
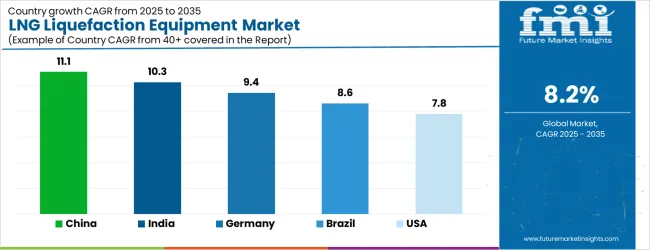
Analysis of LNG Liquefaction Equipment Market By Key Countries

Lng Liquefaction Equipment Market Cagr Analysis By Country

Country CAGR
China 11.1%
India 10.3%
Germany 9.4%
Brazil 8.6%
USA 7.8%
UK 7.0%
Japan 6.2%

Country-wise Analysis

The LNG Liquefaction Equipment Market is expected to register a CAGR of 8.2% during the forecast period, exhibiting varied country level momentum. China leads with the highest CAGR of 11.1%, followed by India at 10.3%. Developed markets such as Germany, France, and the UK continue to expand steadily, while the USA is likely to grow at consistent rates. Japan posts the lowest CAGR at 6.2%, yet still underscores a broadly positive trajectory for the global LNG Liquefaction Equipment Market. In 2024, Germany held a dominant revenue in the Western Europe market and is expected to grow with a CAGR of 9.4%. The USA LNG Liquefaction Equipment Market is estimated to be valued at USD 8.9 billion in 2025 and is anticipated to reach a valuation of USD 8.9 billion by 2035. Sales are projected to rise at a CAGR of 0.0% over the forecast period between 2025 and 2035. While Japan and South Korea markets are estimated to be valued at USD 1.2 billion and USD 887.1 million respectively in 2025.
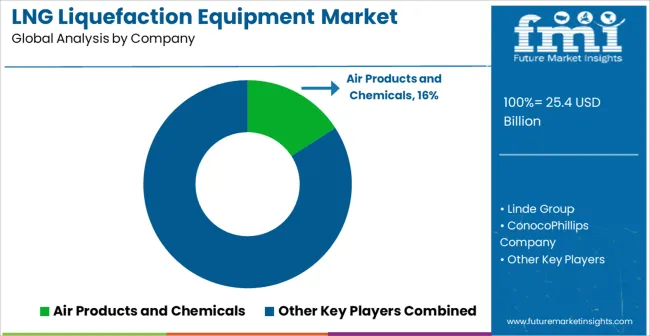
Key Players in the LNG Liquefaction Equipment Market

Lng Liquefaction Equipment Market Analysis By Company

  • Air Products and Chemicals
  • Linde Group
  • ConocoPhillips Company
  • Atlas Copco
  • Ingersoll Rand
  • General Electric
  • Kobelco Compressors
  • Chart Energy and Chemicals
  • Elliott
  • MITSUI E&S
  • MCO
  • IHI Corporation

Scope of the Report

Item Value
Quantitative Units USD 25.4 Billion
Systems Refrigerant Compressor System, Pumping And Storage System, Power System, and Other Auxiliary System
Equipment Manufacturer Plant Manufacturer and Assembly Manufacturer
Plant Size Mid-Scale LNG Plants (>0.25 To <2.0 MTPA), Small LNG Plants (<0.25 MTPA), Large LNG Plants (>2.0 MTPA), and FLNG Plants (Offshore Floating Plants)
Regions Covered North America, Europe, Asia-Pacific, Latin America, Middle East & Africa
Country Covered United States, Canada, Germany, France, United Kingdom, China, Japan, India, Brazil, South Africa
Key Companies Profiled Air Products and Chemicals, Linde Group, ConocoPhillips Company, Atlas Copco, Ingersoll Rand, General Electric, Kobelco Compressors, Chart Energy and Chemicals, Elliott, MITSUI E&S, MCO, and IHI Corporation

LNG Liquefaction Equipment Market by Segments

Systems:

  • Refrigerant Compressor System
  • Pumping And Storage System
  • Power System
  • Other Auxiliary System

Equipment Manufacturer:

  • Plant Manufacturer
  • Assembly Manufacturer

Plant Size:

  • Mid-Scale LNG Plants (>0.25 To <2.0 MTPA)
  • Small LNG Plants (<0.25 MTPA)
  • Large LNG Plants (>2.0 MTPA)
  • FLNG Plants (Offshore Floating Plants)

Region:

  • North America
    • USA
    • Canada
    • Mexico
  • Latin America
    • Brazil
    • Chile
    • Rest of Latin America
  • Western Europe
    • Germany
    • UK
    • Italy
    • Spain
    • France
    • Nordic
    • BENELUX
    • Rest of Western Europe
  • Eastern Europe
    • Russia
    • Poland
    • Hungary
    • Balkan & Baltic
    • Rest of Eastern Europe
  • East Asia
    • China
    • Japan
    • South Korea
  • South Asia and Pacific
    • India
    • ASEAN
    • Australia & New Zealand
    • Rest of South Asia and Pacific
  • Middle East & Africa
    • Kingdom of Saudi Arabia
    • Other GCC Countries
    • Turkiye
    • South Africa
    • Other African Union
    • Rest of Middle East & Africa

Table of Content

  1. Executive Summary
    • Global Market Outlook
    • Demand-side Trends
    • Supply-side Trends
    • Technology Roadmap Analysis
    • Analysis and Recommendations
  2. Market Overview
    • Market Coverage / Taxonomy
    • Market Definition / Scope / Limitations
  3. Market Background
    • Market Dynamics
      • Drivers
      • Restraints
      • Opportunity
      • Trends
    • Scenario Forecast
      • Demand in Optimistic Scenario
      • Demand in Likely Scenario
      • Demand in Conservative Scenario
    • Opportunity Map Analysis
    • Product Life Cycle Analysis
    • Supply Chain Analysis
    • Investment Feasibility Matrix
    • Value Chain Analysis
    • PESTLE and Porter’s Analysis
    • Regulatory Landscape
    • Regional Parent Market Outlook
    • Production and Consumption Statistics
    • Import and Export Statistics
  4. Global Market Analysis 2020 to 2024 and Forecast, 2025 to 2035
    • Historical Market Size Value (USD Million) Analysis, 2020 to 2024
    • Current and Future Market Size Value (USD Million) Projections, 2025 to 2035
      • Y-o-Y Growth Trend Analysis
      • Absolute $ Opportunity Analysis
  5. Global Market Pricing Analysis 2020 to 2024 and Forecast 2025 to 2035
  6. Global Market Analysis 2020 to 2024 and Forecast 2025 to 2035, By Systems
    • Introduction / Key Findings
    • Historical Market Size Value (USD Million) Analysis By Systems , 2020 to 2024
    • Current and Future Market Size Value (USD Million) Analysis and Forecast By Systems , 2025 to 2035
      • Refrigerant Compressor System
      • Pumping And Storage System
      • Power System
      • Other Auxiliary System
    • Y-o-Y Growth Trend Analysis By Systems , 2020 to 2024
    • Absolute $ Opportunity Analysis By Systems , 2025 to 2035
  7. Global Market Analysis 2020 to 2024 and Forecast 2025 to 2035, By Equipment Manufacturer
    • Introduction / Key Findings
    • Historical Market Size Value (USD Million) Analysis By Equipment Manufacturer, 2020 to 2024
    • Current and Future Market Size Value (USD Million) Analysis and Forecast By Equipment Manufacturer, 2025 to 2035
      • Plant Manufacturer
      • Assembly Manufacturer
    • Y-o-Y Growth Trend Analysis By Equipment Manufacturer, 2020 to 2024
    • Absolute $ Opportunity Analysis By Equipment Manufacturer, 2025 to 2035
  8. Global Market Analysis 2020 to 2024 and Forecast 2025 to 2035, By Plant Size
    • Introduction / Key Findings
    • Historical Market Size Value (USD Million) Analysis By Plant Size, 2020 to 2024
    • Current and Future Market Size Value (USD Million) Analysis and Forecast By Plant Size, 2025 to 2035
      • Mid-Scale LNG Plants (>0.25 To <2.0 MTPA)
      • Small LNG Plants (<0.25 MTPA)
      • Large LNG Plants (>2.0 MTPA)
      • FLNG Plants (Offshore Floating Plants)
    • Y-o-Y Growth Trend Analysis By Plant Size, 2020 to 2024
    • Absolute $ Opportunity Analysis By Plant Size, 2025 to 2035
  9. Global Market Analysis 2020 to 2024 and Forecast 2025 to 2035, By Region
    • Introduction
    • Historical Market Size Value (USD Million) Analysis By Region, 2020 to 2024
    • Current Market Size Value (USD Million) Analysis and Forecast By Region, 2025 to 2035
      • North America
      • Latin America
      • Western Europe
      • Eastern Europe
      • East Asia
      • South Asia and Pacific
      • Middle East & Africa
    • Market Attractiveness Analysis By Region
  10. North America Market Analysis 2020 to 2024 and Forecast 2025 to 2035, By Country
    • Historical Market Size Value (USD Million) Trend Analysis By Market Taxonomy, 2020 to 2024
    • Market Size Value (USD Million) Forecast By Market Taxonomy, 2025 to 2035
      • By Country
        • USA
        • Canada
        • Mexico
      • By Systems
      • By Equipment Manufacturer
      • By Plant Size
    • Market Attractiveness Analysis
      • By Country
      • By Systems
      • By Equipment Manufacturer
      • By Plant Size
    • Key Takeaways
  11. Latin America Market Analysis 2020 to 2024 and Forecast 2025 to 2035, By Country
    • Historical Market Size Value (USD Million) Trend Analysis By Market Taxonomy, 2020 to 2024
    • Market Size Value (USD Million) Forecast By Market Taxonomy, 2025 to 2035
      • By Country
        • Brazil
        • Chile
        • Rest of Latin America
      • By Systems
      • By Equipment Manufacturer
      • By Plant Size
    • Market Attractiveness Analysis
      • By Country
      • By Systems
      • By Equipment Manufacturer
      • By Plant Size
    • Key Takeaways
  12. Western Europe Market Analysis 2020 to 2024 and Forecast 2025 to 2035, By Country
    • Historical Market Size Value (USD Million) Trend Analysis By Market Taxonomy, 2020 to 2024
    • Market Size Value (USD Million) Forecast By Market Taxonomy, 2025 to 2035
      • By Country
        • Germany
        • UK
        • Italy
        • Spain
        • France
        • Nordic
        • BENELUX
        • Rest of Western Europe
      • By Systems
      • By Equipment Manufacturer
      • By Plant Size
    • Market Attractiveness Analysis
      • By Country
      • By Systems
      • By Equipment Manufacturer
      • By Plant Size
    • Key Takeaways
  13. Eastern Europe Market Analysis 2020 to 2024 and Forecast 2025 to 2035, By Country
    • Historical Market Size Value (USD Million) Trend Analysis By Market Taxonomy, 2020 to 2024
    • Market Size Value (USD Million) Forecast By Market Taxonomy, 2025 to 2035
      • By Country
        • Russia
        • Poland
        • Hungary
        • Balkan & Baltic
        • Rest of Eastern Europe
      • By Systems
      • By Equipment Manufacturer
      • By Plant Size
    • Market Attractiveness Analysis
      • By Country
      • By Systems
      • By Equipment Manufacturer
      • By Plant Size
    • Key Takeaways
  14. East Asia Market Analysis 2020 to 2024 and Forecast 2025 to 2035, By Country
    • Historical Market Size Value (USD Million) Trend Analysis By Market Taxonomy, 2020 to 2024
    • Market Size Value (USD Million) Forecast By Market Taxonomy, 2025 to 2035
      • By Country
        • China
        • Japan
        • South Korea
      • By Systems
      • By Equipment Manufacturer
      • By Plant Size
    • Market Attractiveness Analysis
      • By Country
      • By Systems
      • By Equipment Manufacturer
      • By Plant Size
    • Key Takeaways
  15. South Asia and Pacific Market Analysis 2020 to 2024 and Forecast 2025 to 2035, By Country
    • Historical Market Size Value (USD Million) Trend Analysis By Market Taxonomy, 2020 to 2024
    • Market Size Value (USD Million) Forecast By Market Taxonomy, 2025 to 2035
      • By Country
        • India
        • ASEAN
        • Australia & New Zealand
        • Rest of South Asia and Pacific
      • By Systems
      • By Equipment Manufacturer
      • By Plant Size
    • Market Attractiveness Analysis
      • By Country
      • By Systems
      • By Equipment Manufacturer
      • By Plant Size
    • Key Takeaways
  16. Middle East & Africa Market Analysis 2020 to 2024 and Forecast 2025 to 2035, By Country
    • Historical Market Size Value (USD Million) Trend Analysis By Market Taxonomy, 2020 to 2024
    • Market Size Value (USD Million) Forecast By Market Taxonomy, 2025 to 2035
      • By Country
        • Kingdom of Saudi Arabia
        • Other GCC Countries
        • Turkiye
        • South Africa
        • Other African Union
        • Rest of Middle East & Africa
      • By Systems
      • By Equipment Manufacturer
      • By Plant Size
    • Market Attractiveness Analysis
      • By Country
      • By Systems
      • By Equipment Manufacturer
      • By Plant Size
    • Key Takeaways
  17. Key Countries Market Analysis
    • USA
      • Pricing Analysis
      • Market Share Analysis, 2024
        • By Systems
        • By Equipment Manufacturer
        • By Plant Size
    • Canada
      • Pricing Analysis
      • Market Share Analysis, 2024
        • By Systems
        • By Equipment Manufacturer
        • By Plant Size
    • Mexico
      • Pricing Analysis
      • Market Share Analysis, 2024
        • By Systems
        • By Equipment Manufacturer
        • By Plant Size
    • Brazil
      • Pricing Analysis
      • Market Share Analysis, 2024
        • By Systems
        • By Equipment Manufacturer
        • By Plant Size
    • Chile
      • Pricing Analysis
      • Market Share Analysis, 2024
        • By Systems
        • By Equipment Manufacturer
        • By Plant Size
    • Germany
      • Pricing Analysis
      • Market Share Analysis, 2024
        • By Systems
        • By Equipment Manufacturer
        • By Plant Size
    • UK
      • Pricing Analysis
      • Market Share Analysis, 2024
        • By Systems
        • By Equipment Manufacturer
        • By Plant Size
    • Italy
      • Pricing Analysis
      • Market Share Analysis, 2024
        • By Systems
        • By Equipment Manufacturer
        • By Plant Size
    • Spain
      • Pricing Analysis
      • Market Share Analysis, 2024
        • By Systems
        • By Equipment Manufacturer
        • By Plant Size
    • France
      • Pricing Analysis
      • Market Share Analysis, 2024
        • By Systems
        • By Equipment Manufacturer
        • By Plant Size
    • India
      • Pricing Analysis
      • Market Share Analysis, 2024
        • By Systems
        • By Equipment Manufacturer
        • By Plant Size
    • ASEAN
      • Pricing Analysis
      • Market Share Analysis, 2024
        • By Systems
        • By Equipment Manufacturer
        • By Plant Size
    • Australia & New Zealand
      • Pricing Analysis
      • Market Share Analysis, 2024
        • By Systems
        • By Equipment Manufacturer
        • By Plant Size
    • China
      • Pricing Analysis
      • Market Share Analysis, 2024
        • By Systems
        • By Equipment Manufacturer
        • By Plant Size
    • Japan
      • Pricing Analysis
      • Market Share Analysis, 2024
        • By Systems
        • By Equipment Manufacturer
        • By Plant Size
    • South Korea
      • Pricing Analysis
      • Market Share Analysis, 2024
        • By Systems
        • By Equipment Manufacturer
        • By Plant Size
    • Russia
      • Pricing Analysis
      • Market Share Analysis, 2024
        • By Systems
        • By Equipment Manufacturer
        • By Plant Size
    • Poland
      • Pricing Analysis
      • Market Share Analysis, 2024
        • By Systems
        • By Equipment Manufacturer
        • By Plant Size
    • Hungary
      • Pricing Analysis
      • Market Share Analysis, 2024
        • By Systems
        • By Equipment Manufacturer
        • By Plant Size
    • Kingdom of Saudi Arabia
      • Pricing Analysis
      • Market Share Analysis, 2024
        • By Systems
        • By Equipment Manufacturer
        • By Plant Size
    • Turkiye
      • Pricing Analysis
      • Market Share Analysis, 2024
        • By Systems
        • By Equipment Manufacturer
        • By Plant Size
    • South Africa
      • Pricing Analysis
      • Market Share Analysis, 2024
        • By Systems
        • By Equipment Manufacturer
        • By Plant Size
  18. Market Structure Analysis
    • Competition Dashboard
    • Competition Benchmarking
    • Market Share Analysis of Top Players
      • By Regional
      • By Systems
      • By Equipment Manufacturer
      • By Plant Size
  19. Competition Analysis
    • Competition Deep Dive
      • Air Products and Chemicals
        • Overview
        • Product Portfolio
        • Profitability by Market Segments (Product/Age /Sales Channel/Region)
        • Sales Footprint
        • Strategy Overview
          • Marketing Strategy
          • Product Strategy
          • Channel Strategy
      • Linde Group
      • ConocoPhillips Company
      • Atlas Copco
      • Ingersoll Rand
      • General Electric
      • Kobelco Compressors
      • Chart Energy and Chemicals
      • Elliott
      • MITSUI E&S
      • MCO
      • IHI Corporation
  20. Assumptions & Acronyms Used
  21. Research Methodology

List of Tables

  • Table 1: Global Market Value (USD Million) Forecast by Region, 2020 to 2035
  • Table 2: Global Market Value (USD Million) Forecast by Systems , 2020 to 2035
  • Table 3: Global Market Value (USD Million) Forecast by Equipment Manufacturer, 2020 to 2035
  • Table 4: Global Market Value (USD Million) Forecast by Plant Size, 2020 to 2035
  • Table 5: North America Market Value (USD Million) Forecast by Country, 2020 to 2035
  • Table 6: North America Market Value (USD Million) Forecast by Systems , 2020 to 2035
  • Table 7: North America Market Value (USD Million) Forecast by Equipment Manufacturer, 2020 to 2035
  • Table 8: North America Market Value (USD Million) Forecast by Plant Size, 2020 to 2035
  • Table 9: Latin America Market Value (USD Million) Forecast by Country, 2020 to 2035
  • Table 10: Latin America Market Value (USD Million) Forecast by Systems , 2020 to 2035
  • Table 11: Latin America Market Value (USD Million) Forecast by Equipment Manufacturer, 2020 to 2035
  • Table 12: Latin America Market Value (USD Million) Forecast by Plant Size, 2020 to 2035
  • Table 13: Western Europe Market Value (USD Million) Forecast by Country, 2020 to 2035
  • Table 14: Western Europe Market Value (USD Million) Forecast by Systems , 2020 to 2035
  • Table 15: Western Europe Market Value (USD Million) Forecast by Equipment Manufacturer, 2020 to 2035
  • Table 16: Western Europe Market Value (USD Million) Forecast by Plant Size, 2020 to 2035
  • Table 17: Eastern Europe Market Value (USD Million) Forecast by Country, 2020 to 2035
  • Table 18: Eastern Europe Market Value (USD Million) Forecast by Systems , 2020 to 2035
  • Table 19: Eastern Europe Market Value (USD Million) Forecast by Equipment Manufacturer, 2020 to 2035
  • Table 20: Eastern Europe Market Value (USD Million) Forecast by Plant Size, 2020 to 2035
  • Table 21: East Asia Market Value (USD Million) Forecast by Country, 2020 to 2035
  • Table 22: East Asia Market Value (USD Million) Forecast by Systems , 2020 to 2035
  • Table 23: East Asia Market Value (USD Million) Forecast by Equipment Manufacturer, 2020 to 2035
  • Table 24: East Asia Market Value (USD Million) Forecast by Plant Size, 2020 to 2035
  • Table 25: South Asia and Pacific Market Value (USD Million) Forecast by Country, 2020 to 2035
  • Table 26: South Asia and Pacific Market Value (USD Million) Forecast by Systems , 2020 to 2035
  • Table 27: South Asia and Pacific Market Value (USD Million) Forecast by Equipment Manufacturer, 2020 to 2035
  • Table 28: South Asia and Pacific Market Value (USD Million) Forecast by Plant Size, 2020 to 2035
  • Table 29: Middle East & Africa Market Value (USD Million) Forecast by Country, 2020 to 2035
  • Table 30: Middle East & Africa Market Value (USD Million) Forecast by Systems , 2020 to 2035
  • Table 31: Middle East & Africa Market Value (USD Million) Forecast by Equipment Manufacturer, 2020 to 2035
  • Table 32: Middle East & Africa Market Value (USD Million) Forecast by Plant Size, 2020 to 2035

List of Figures

  • Figure 1: Global Market Pricing Analysis
  • Figure 2: Global Market Value (USD Million) Forecast 2020-2035
  • Figure 3: Global Market Value Share and BPS Analysis by Systems , 2025 and 2035
  • Figure 4: Global Market Y-o-Y Growth Comparison by Systems , 2025-2035
  • Figure 5: Global Market Attractiveness Analysis by Systems
  • Figure 6: Global Market Value Share and BPS Analysis by Equipment Manufacturer, 2025 and 2035
  • Figure 7: Global Market Y-o-Y Growth Comparison by Equipment Manufacturer, 2025-2035
  • Figure 8: Global Market Attractiveness Analysis by Equipment Manufacturer
  • Figure 9: Global Market Value Share and BPS Analysis by Plant Size, 2025 and 2035
  • Figure 10: Global Market Y-o-Y Growth Comparison by Plant Size, 2025-2035
  • Figure 11: Global Market Attractiveness Analysis by Plant Size
  • Figure 12: Global Market Value (USD Million) Share and BPS Analysis by Region, 2025 and 2035
  • Figure 13: Global Market Y-o-Y Growth Comparison by Region, 2025-2035
  • Figure 14: Global Market Attractiveness Analysis by Region
  • Figure 15: North America Market Incremental Dollar Opportunity, 2025-2035
  • Figure 16: Latin America Market Incremental Dollar Opportunity, 2025-2035
  • Figure 17: Western Europe Market Incremental Dollar Opportunity, 2025-2035
  • Figure 18: Eastern Europe Market Incremental Dollar Opportunity, 2025-2035
  • Figure 19: East Asia Market Incremental Dollar Opportunity, 2025-2035
  • Figure 20: South Asia and Pacific Market Incremental Dollar Opportunity, 2025-2035
  • Figure 21: Middle East & Africa Market Incremental Dollar Opportunity, 2025-2035
  • Figure 22: North America Market Value Share and BPS Analysis by Country, 2025 and 2035
  • Figure 23: North America Market Value Share and BPS Analysis by Systems , 2025 and 2035
  • Figure 24: North America Market Y-o-Y Growth Comparison by Systems , 2025-2035
  • Figure 25: North America Market Attractiveness Analysis by Systems
  • Figure 26: North America Market Value Share and BPS Analysis by Equipment Manufacturer, 2025 and 2035
  • Figure 27: North America Market Y-o-Y Growth Comparison by Equipment Manufacturer, 2025-2035
  • Figure 28: North America Market Attractiveness Analysis by Equipment Manufacturer
  • Figure 29: North America Market Value Share and BPS Analysis by Plant Size, 2025 and 2035
  • Figure 30: North America Market Y-o-Y Growth Comparison by Plant Size, 2025-2035
  • Figure 31: North America Market Attractiveness Analysis by Plant Size
  • Figure 32: Latin America Market Value Share and BPS Analysis by Country, 2025 and 2035
  • Figure 33: Latin America Market Value Share and BPS Analysis by Systems , 2025 and 2035
  • Figure 34: Latin America Market Y-o-Y Growth Comparison by Systems , 2025-2035
  • Figure 35: Latin America Market Attractiveness Analysis by Systems
  • Figure 36: Latin America Market Value Share and BPS Analysis by Equipment Manufacturer, 2025 and 2035
  • Figure 37: Latin America Market Y-o-Y Growth Comparison by Equipment Manufacturer, 2025-2035
  • Figure 38: Latin America Market Attractiveness Analysis by Equipment Manufacturer
  • Figure 39: Latin America Market Value Share and BPS Analysis by Plant Size, 2025 and 2035
  • Figure 40: Latin America Market Y-o-Y Growth Comparison by Plant Size, 2025-2035
  • Figure 41: Latin America Market Attractiveness Analysis by Plant Size
  • Figure 42: Western Europe Market Value Share and BPS Analysis by Country, 2025 and 2035
  • Figure 43: Western Europe Market Value Share and BPS Analysis by Systems , 2025 and 2035
  • Figure 44: Western Europe Market Y-o-Y Growth Comparison by Systems , 2025-2035
  • Figure 45: Western Europe Market Attractiveness Analysis by Systems
  • Figure 46: Western Europe Market Value Share and BPS Analysis by Equipment Manufacturer, 2025 and 2035
  • Figure 47: Western Europe Market Y-o-Y Growth Comparison by Equipment Manufacturer, 2025-2035
  • Figure 48: Western Europe Market Attractiveness Analysis by Equipment Manufacturer
  • Figure 49: Western Europe Market Value Share and BPS Analysis by Plant Size, 2025 and 2035
  • Figure 50: Western Europe Market Y-o-Y Growth Comparison by Plant Size, 2025-2035
  • Figure 51: Western Europe Market Attractiveness Analysis by Plant Size
  • Figure 52: Eastern Europe Market Value Share and BPS Analysis by Country, 2025 and 2035
  • Figure 53: Eastern Europe Market Value Share and BPS Analysis by Systems , 2025 and 2035
  • Figure 54: Eastern Europe Market Y-o-Y Growth Comparison by Systems , 2025-2035
  • Figure 55: Eastern Europe Market Attractiveness Analysis by Systems
  • Figure 56: Eastern Europe Market Value Share and BPS Analysis by Equipment Manufacturer, 2025 and 2035
  • Figure 57: Eastern Europe Market Y-o-Y Growth Comparison by Equipment Manufacturer, 2025-2035
  • Figure 58: Eastern Europe Market Attractiveness Analysis by Equipment Manufacturer
  • Figure 59: Eastern Europe Market Value Share and BPS Analysis by Plant Size, 2025 and 2035
  • Figure 60: Eastern Europe Market Y-o-Y Growth Comparison by Plant Size, 2025-2035
  • Figure 61: Eastern Europe Market Attractiveness Analysis by Plant Size
  • Figure 62: East Asia Market Value Share and BPS Analysis by Country, 2025 and 2035
  • Figure 63: East Asia Market Value Share and BPS Analysis by Systems , 2025 and 2035
  • Figure 64: East Asia Market Y-o-Y Growth Comparison by Systems , 2025-2035
  • Figure 65: East Asia Market Attractiveness Analysis by Systems
  • Figure 66: East Asia Market Value Share and BPS Analysis by Equipment Manufacturer, 2025 and 2035
  • Figure 67: East Asia Market Y-o-Y Growth Comparison by Equipment Manufacturer, 2025-2035
  • Figure 68: East Asia Market Attractiveness Analysis by Equipment Manufacturer
  • Figure 69: East Asia Market Value Share and BPS Analysis by Plant Size, 2025 and 2035
  • Figure 70: East Asia Market Y-o-Y Growth Comparison by Plant Size, 2025-2035
  • Figure 71: East Asia Market Attractiveness Analysis by Plant Size
  • Figure 72: South Asia and Pacific Market Value Share and BPS Analysis by Country, 2025 and 2035
  • Figure 73: South Asia and Pacific Market Value Share and BPS Analysis by Systems , 2025 and 2035
  • Figure 74: South Asia and Pacific Market Y-o-Y Growth Comparison by Systems , 2025-2035
  • Figure 75: South Asia and Pacific Market Attractiveness Analysis by Systems
  • Figure 76: South Asia and Pacific Market Value Share and BPS Analysis by Equipment Manufacturer, 2025 and 2035
  • Figure 77: South Asia and Pacific Market Y-o-Y Growth Comparison by Equipment Manufacturer, 2025-2035
  • Figure 78: South Asia and Pacific Market Attractiveness Analysis by Equipment Manufacturer
  • Figure 79: South Asia and Pacific Market Value Share and BPS Analysis by Plant Size, 2025 and 2035
  • Figure 80: South Asia and Pacific Market Y-o-Y Growth Comparison by Plant Size, 2025-2035
  • Figure 81: South Asia and Pacific Market Attractiveness Analysis by Plant Size
  • Figure 82: Middle East & Africa Market Value Share and BPS Analysis by Country, 2025 and 2035
  • Figure 83: Middle East & Africa Market Value Share and BPS Analysis by Systems , 2025 and 2035
  • Figure 84: Middle East & Africa Market Y-o-Y Growth Comparison by Systems , 2025-2035
  • Figure 85: Middle East & Africa Market Attractiveness Analysis by Systems
  • Figure 86: Middle East & Africa Market Value Share and BPS Analysis by Equipment Manufacturer, 2025 and 2035
  • Figure 87: Middle East & Africa Market Y-o-Y Growth Comparison by Equipment Manufacturer, 2025-2035
  • Figure 88: Middle East & Africa Market Attractiveness Analysis by Equipment Manufacturer
  • Figure 89: Middle East & Africa Market Value Share and BPS Analysis by Plant Size, 2025 and 2035
  • Figure 90: Middle East & Africa Market Y-o-Y Growth Comparison by Plant Size, 2025-2035
  • Figure 91: Middle East & Africa Market Attractiveness Analysis by Plant Size
  • Figure 92: Global Market - Tier Structure Analysis
  • Figure 93: Global Market - Company Share Analysis

Frequently Asked Questions

How big is the lng liquefaction equipment market in 2025?

The global lng liquefaction equipment market is estimated to be valued at USD 25.4 billion in 2025.

What will be the size of lng liquefaction equipment market in 2035?

The market size for the lng liquefaction equipment market is projected to reach USD 55.9 billion by 2035.

How much will be the lng liquefaction equipment market growth between 2025 and 2035?

The lng liquefaction equipment market is expected to grow at a 8.2% CAGR between 2025 and 2035.

What are the key product types in the lng liquefaction equipment market?

The key product types in lng liquefaction equipment market are refrigerant compressor system, pumping and storage system, power system and other auxiliary system.

Which equipment manufacturer segment to contribute significant share in the lng liquefaction equipment market in 2025?

In terms of equipment manufacturer, plant manufacturer segment to command 58.4% share in the lng liquefaction equipment market in 2025.

Explore Similar Insights

Future Market Insights

LNG Liquefaction Equipment Market

Chat With MaRIA

Chat With

MaRIA

Hi There, I am MaRIA, Your Market Research Intelligence Assistant. How may I help you?