The LNG bunkering market is projected to expand from USD 12.6 billion in 2025 to USD 21.2 billion by 2035, reflecting an addition of USD 8.6 billion over the forecast period at a CAGR of 5.3%.
2025–2030: In the first phase, the market progresses from USD 12.6 billion to USD 16.2 billion, adding USD 3.6 billion in value. Growth is fueled by stricter emission regulations under IMO 2020 and upcoming decarbonization mandates, making LNG the preferred alternative fuel. Port authorities in North America, Asia-Pacific, and Europe are scaling up LNG bunkering stations, while shipping operators increasingly opt for LNG to cut lifecycle fuel costs.
2030–2035: In the second phase, the market advances from USD 16.8 billion to USD 21.2 billion, generating an additional USD 4.4 billion. This stage is supported by expanded LNG bunkering fleets, digital bunkering management systems, and hybrid fueling models that integrate LNG with bio-LNG and synthetic LNG to meet net-zero transition goals. The shipping industry’s pivot toward long-term compliance with carbon intensity indicators (CII) and energy efficiency existing ship index (EEXI) metrics further accelerates adoption.
By 2035, ship-to-ship bunkering (38.9% share) remains the leading segment, while Asia-Pacific, North America, and Europe emerge as the key growth regions. The market’s trajectory underscores LNG’s role as a transitional marine fuel, balancing cost-efficiency with regulatory compliance.
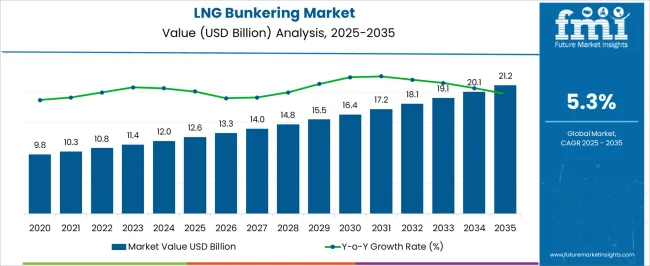
| Metric | Value |
|---|---|
| LNG Bunkering Market Estimated Value in (2025 E) | USD 12.6 billion |
| LNG Bunkering Market Forecast Value in (2035 F) | USD 21.2 billion |
| Forecast CAGR (2025 to 2035) | 5.3% |
The LNG bunkering market is experiencing significant growth driven by stricter environmental regulations and the shipping industry’s shift toward cleaner fuels. As maritime operators seek to reduce emissions, LNG has emerged as a preferred alternative to traditional marine fuels due to its lower sulfur and greenhouse gas emissions.
Industry developments have highlighted investments in LNG bunkering infrastructure and vessels equipped for LNG fuel, supporting the adoption of this cleaner technology. Increasing government incentives and international maritime policies aimed at decarbonization have accelerated market expansion.
The growing focus on sustainable shipping practices and the replacement of older fleets with LNG-compatible vessels are also key growth factors. Demand for LNG bunkering services is expected to rise in ports serving high volumes of short-sea and inland waterway traffic. Segmental growth is anticipated to be driven by the ship-to-ship LNG transfer method and the ferry segment as a leading end-use category due to the frequent refueling needs and strict emissions standards.
The LNG bunkering market is segmented by product (bunkering method), ship-to-ship, truck-to-ship, port-to-ship, and portable tanks; by end-use, ferries, container vessels, cruise ships, bulk carriers, and offshore support vessels; by region, North America, Europe, Asia-Pacific, Latin America, and Middle East & Africa.
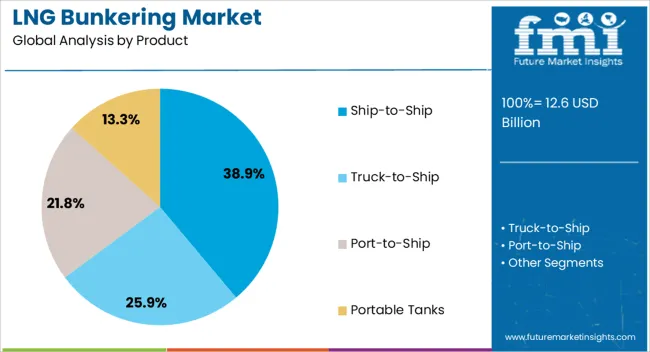
The Ship-to-Ship LNG bunkering segment is projected to account for 38.9% of the market revenue in 2025, holding the largest share among bunkering methods. This approach is favored for its flexibility and efficiency in busy port areas and coastal operations.
It allows LNG to be transferred directly between vessels, minimizing downtime and logistical complexities associated with shore-based bunkering. The ship-to-ship method also supports growing demand in regions where port infrastructure for LNG refueling is limited or under development.
Operators appreciate the ability to perform bunkering operations without requiring permanent onshore facilities. Safety protocols and technological advancements have improved the feasibility and reliability of ship-to-ship LNG transfers. As maritime routes and vessel types diversify, this method is expected to maintain a leading role in the LNG bunkering market.
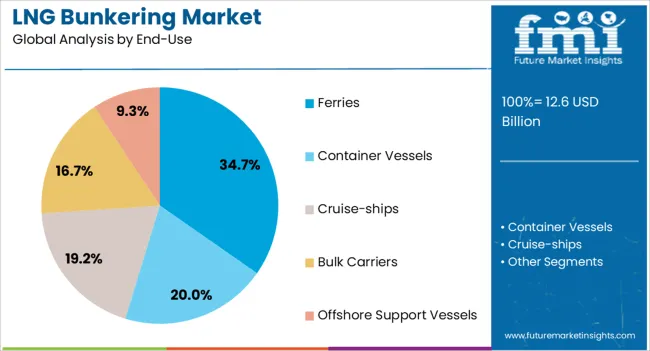
The Ferries segment is projected to contribute 34.7% of the LNG bunkering market revenue in 2025, making it the leading end-use category. Ferries are well suited for LNG fuel adoption due to their regular routes and high fuel consumption, which makes LNG economically attractive.
The emphasis on reducing emissions in passenger transport and the need to comply with stringent environmental regulations have driven ferry operators to switch to LNG-powered vessels. The relatively predictable and short routes of ferries facilitate the establishment of regular bunkering schedules and infrastructure.
Additionally, government support for clean public transportation has encouraged LNG adoption in this segment. As ferry fleets continue to modernize and expand, LNG bunkering demand is expected to grow steadily, reinforcing the segment’s market dominance.
The LNG bunkering industry is advancing with regulatory backing, port investments, and fleet expansion. Growth prospects remain high, but cost barriers and emerging alternative fuels present challenges.
The LNG bunkering landscape is being propelled by international shipping regulations, rising demand for low-sulfur fuels, and the maritime industry’s transition to cleaner alternatives. Increasing investments in port infrastructure, coupled with the construction of LNG-fueled vessels, are creating stronger foundations for expansion. Ship owners are increasingly adopting LNG as a preferred marine fuel due to its cost benefits and reduced environmental penalties compared to heavy fuel oil. Governmental initiatives and joint ventures between energy providers and port authorities have accelerated LNG supply network development. The expansion of ship-to-ship, truck-to-ship, and terminal-based bunkering facilities ensures reliable refueling, providing shipping operators greater flexibility and operational assurance across global trading routes.
Despite the strong potential, LNG bunkering faces several challenges that limit growth momentum. The high cost of infrastructure development, such as liquefaction plants, cryogenic storage tanks, and specialized bunkering vessels, creates significant financial barriers. Limited port readiness and regional disparities in LNG availability continue to discourage global shipping operators from fully adopting LNG as a universal solution. Concerns regarding methane slip, safety risks during handling, and the complexities of regulatory compliance further hinder adoption. Aalternative marine fuels like biofuels and ammonia are emerging as competing solutions, raising uncertainty around long-term LNG demand. These restraints emphasize the need for long-term commitments, cost optimization strategies, and enhanced technological reliability in LNG supply chains.
The LNG bunkering sector holds significant opportunities from the rapid expansion of LNG-fueled fleets across container ships, ferries, and cruise vessels. Strong policy support, including subsidies and tax incentives, is encouraging ship owners to retrofit existing fleets and invest in new LNG-compatible engines. Collaborations between energy firms, shipping companies, and governments are expanding LNG hubs in strategic regions such as Europe, Asia-Pacific, and the Middle East. The rising number of dual-fuel engines is also boosting the versatility of LNG use, ensuring operators can transition gradually. Growth opportunities lie in developing small-scale LNG terminals, enhancing logistical connections between inland and offshore ports, and deploying advanced monitoring systems for safe and efficient bunkering operations worldwide.
Shifting industry preferences and technological upgrades are redefining LNG bunkering practices globally. Modular and mobile bunkering units are gaining traction due to their adaptability and lower upfront cost, offering scalable solutions for emerging ports. Digitalization of fleet monitoring and predictive systems is improving efficiency and reducing operational risks during LNG handling. Strategic partnerships between oil majors, logistics firms, and port operators are creating interconnected global supply chains, ensuring consistent LNG availability. Demand is also rising in niche markets such as offshore vessels and defense fleets, further diversifying LNG bunkering applications. As LNG is increasingly positioned as a bridging fuel, its role within integrated energy transition pathways is becoming central to maritime operations.
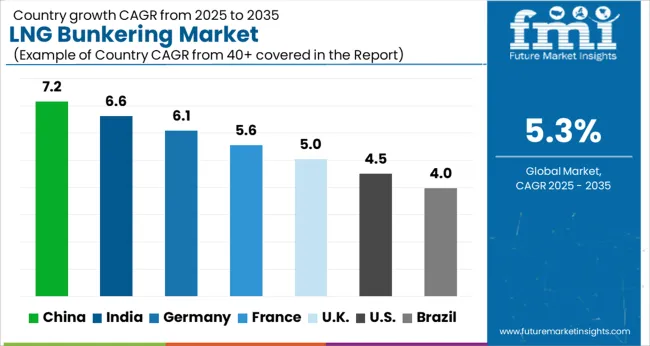
The LNG bunkering market is projected to expand at a global CAGR of 5.3% from 2025 to 2035, influenced by stricter emission norms, rising adoption of alternative fuels in shipping, and increasing investments in LNG infrastructure. China leads with a CAGR of 7.2%, driven by port expansions, strong state-backed LNG adoption programs, and rising fleet conversions. India follows at 6.6%, supported by industrial shipping activity, growing port infrastructure, and favorable government fuel transition policies. France achieves 5.6% growth, aided by expanded LNG storage facilities and regional shipping sector adoption. The United Kingdom posts 5.0% growth, with increasing LNG bunkering stations and policy-led maritime transition. The United States lags slightly at 4.5%, reflecting a mature fuel supply market with moderate fleet conversion rates and reliance on established bunkering hubs. This analysis highlights LNG bunkering adoption across global shipping hubs, offering a benchmark for investment, infrastructure expansion, and competitive positioning strategies worldwide.
China registered a CAGR of about 6.4% during 2020–2024, which is projected to increase further to 7.2% between 2025–2035 as vessel conversions, port infrastructure, and LNG carrier traffic grow. Initial expansion came from state-backed bunkering hubs at Shanghai, Shenzhen, and Ningbo, where LNG adoption was mandated for inland waterway fleets. Over the next phase, fleet-wide adoption of dual-fuel engines, expansion of import terminals, and reinforcement of cold-chain shipping corridors are expected to push demand higher. Local fabrication of fueling arms and cryogenic hoses has been emphasized to cut reliance on imports. Cooperative agreements between Chinese shipyards and global LNG suppliers are securing forward bunkering capacity. These shifts have shortened bunkering times, increased fueling consistency, and encouraged cost optimization.
India posted an estimated 5.9% CAGR from 2020–2024, moving upward to 6.6% for 2025–2035, aided by industrial port expansions and adoption in coastal ferries. Early momentum came from LNG bunkering stations set up at Kochi and Hazira, supported by policy incentives for coastal shipping fuel substitution. The next decade is expected to see strong traction from private terminals investing in bunkering barges and offshore supply vessels using LNG. Long-term supply contracts with GAIL and Petronet are strengthening LNG availability. Integration of refueling facilities with new port infrastructure has reduced logistics bottlenecks. Partnerships with European technology providers are also improving dispenser efficiency and safety standards, which is boosting operator confidence.
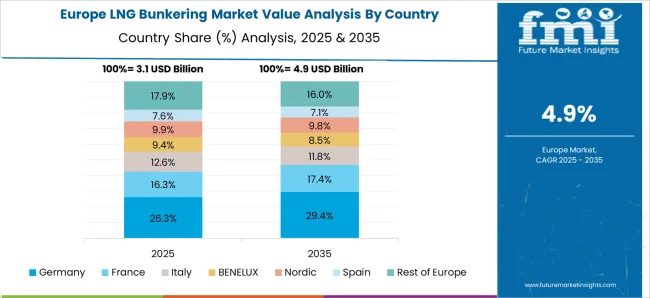
France maintained a CAGR of around 4.9% in 2020–2024, which is expected to climb to 5.6% in 2025–2035 as EU directives and fleet conversions intensify. Early progress was seen through expansion of LNG bunkering hubs in Marseille and Dunkirk, driven by stringent IMO 2020 emission standards. Looking ahead, broader integration of LNG fueling across container fleets, ferries, and short-sea shipping routes is expected. The French government’s subsidies for alternative fuels, combined with joint ventures between TotalEnergies and shipping operators, are securing steady LNG supply lines. Local engineering upgrades in cryogenic storage tanks have helped extend fueling cycles, improving bunkering reliability. This outlook reflects both regulatory push and technology-driven efficiency gains.
The United Kingdom recorded a modest CAGR of 3.9% during 2020–2024, but projections for 2025–2035 suggest acceleration to 5.0%, higher than the global average of 5.3%. The rise can be attributed to increased demand from trans-Atlantic shipping corridors and government-backed decarbonization plans. During the earlier phase, slower uptake was observed due to limited bunkering stations and reliance on conventional marine fuels. By 2025–2035, momentum is supported by expanding LNG-ready fleets, port upgrades in Southampton and Teesport, and closer integration with Northern European LNG supply hubs. Strategic collaborations between UK ports and Norwegian LNG providers are reducing fueling gaps. Standardization of safety protocols and wider access to funding for green marine fuels are enhancing adoption.
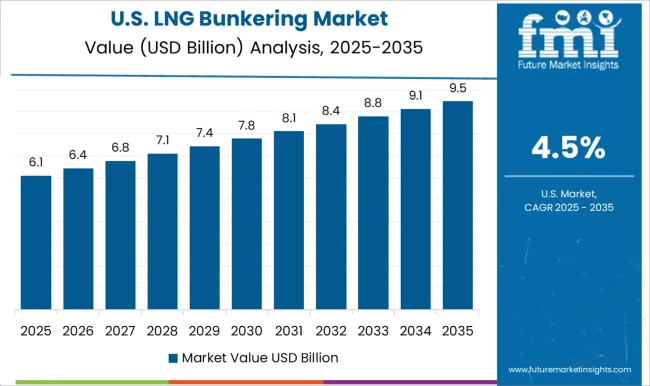
The United States held a CAGR of 3.5% between 2020–2024, with growth expected to strengthen to 4.5% by 2025–2035. Early years were led by LNG bunkering projects at Jacksonville, Port Fourchon, and Tacoma, driven by Jones Act fleet conversions and early LNG tanker adoption. Over the next decade, demand is projected to expand as cruise lines and cargo operators adopt LNG across coastal and inland waterways. Federal incentives for low-emission marine fuels, combined with partnerships between utilities and LNG suppliers, are shaping long-term adoption. Investments in LNG fueling barges and cryogenic distribution networks are expected to reduce supply constraints, increasing fueling reliability across multiple regions. These structural improvements indicate steady but controlled growth.
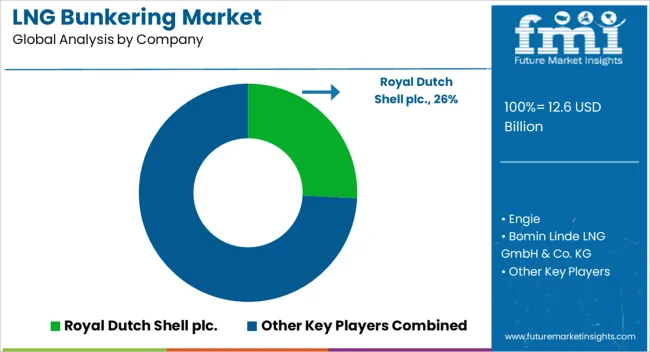
The LNG bunkering market is influenced by global energy companies, regional gas suppliers, and maritime operators seeking to expand clean fuel infrastructure. Royal Dutch Shell PLC plays a leading role with large-scale bunkering hubs and partnerships across Europe and Asia. Engie focuses on integrated LNG logistics and fueling services, collaborating with ports to enhance LNG accessibility.
Bomin Linde LNG GmbH & Co. KG delivers end-to-end bunkering solutions in Northern Europe. Skangass AS and Gasnor AS strengthen Scandinavian LNG supply chains, targeting ferry and short-sea shipping operators. Korea Gas Corporation invests in large-scale bunkering infrastructure to serve regional fleets. Harvey Gulf International Marine LLC pioneers LNG bunkering in North America with offshore supply vessels. Polskie LNG drives infrastructure expansion in Poland, supporting Baltic Sea shipping.
Eagle LNG develops small-scale LNG facilities in the USA for coastal and Caribbean trade routes. ENN Energy in China integrates LNG bunkering into its natural gas distribution. EVOL LNG expands operations in Australia with mobile bunkering units. Fjord Line incorporates LNG into passenger and freight ferries, strengthening Scandinavian adoption. Crowley Maritime offers LNG bunkering services for cargo and container vessels in the Americas.
| Item | Value |
|---|---|
| Quantitative Units | USD Billion |
| Product | Ship-to-Ship, Truck-to-Ship, Port-to-Ship, and Portable Tanks |
| End-Use | Ferries, Container Vessels, Cruise-ships, Bulk Carriers, and Offshore Support Vessels |
| Regions Covered | North America, Europe, Asia-Pacific, Latin America, Middle East & Africa |
| Country Covered | United States, Canada, Germany, France, United Kingdom, China, Japan, India, Brazil, South Africa |
| Key Companies Profiled | Shell plc, ENGIE SA, Gasum, Gasnor AS, Korea Gas Corporation (KOGAS), Harvey Gulf International Marine LLC, Polskie LNG S.A., Eagle LNG Partners, ENN Energy Holdings Ltd., EVOL LNG, Fjord Line AS, Crowley Maritime Corporation, PRIMA LNG |
| Additional Attributes | Dollar sales, share, port infrastructure expansion, regional adoption trends, pricing benchmarks, competitor fleet size, regulatory incentives, LNG supply chain risks, vessel fuel transition outlook, upcoming hub locations. |
The global LNG bunkering market is estimated to be valued at USD 12.6 billion in 2025.
The market size for the LNG bunkering market is projected to reach USD 21.2 billion by 2035.
The LNG bunkering market is expected to grow at a 5.3% CAGR between 2025 and 2035.
The key product types in LNG bunkering market are ship-to-ship, truck-to-ship, port-to-ship and portable tanks.
In terms of end-use, ferries segment to command 34.7% share in the LNG bunkering market in 2025.


Our Research Products

The "Full Research Suite" delivers actionable market intel, deep dives on markets or technologies, so clients act faster, cut risk, and unlock growth.

The Leaderboard benchmarks and ranks top vendors, classifying them as Established Leaders, Leading Challengers, or Disruptors & Challengers.

Locates where complements amplify value and substitutes erode it, forecasting net impact by horizon

We deliver granular, decision-grade intel: market sizing, 5-year forecasts, pricing, adoption, usage, revenue, and operational KPIs—plus competitor tracking, regulation, and value chains—across 60 countries broadly.

Spot the shifts before they hit your P&L. We track inflection points, adoption curves, pricing moves, and ecosystem plays to show where demand is heading, why it is changing, and what to do next across high-growth markets and disruptive tech

Real-time reads of user behavior. We track shifting priorities, perceptions of today’s and next-gen services, and provider experience, then pace how fast tech moves from trial to adoption, blending buyer, consumer, and channel inputs with social signals (#WhySwitch, #UX).

Partner with our analyst team to build a custom report designed around your business priorities. From analysing market trends to assessing competitors or crafting bespoke datasets, we tailor insights to your needs.
Supplier Intelligence
Discovery & Profiling
Capacity & Footprint
Performance & Risk
Compliance & Governance
Commercial Readiness
Who Supplies Whom
Scorecards & Shortlists
Playbooks & Docs
Category Intelligence
Definition & Scope
Demand & Use Cases
Cost Drivers
Market Structure
Supply Chain Map
Trade & Policy
Operating Norms
Deliverables
Buyer Intelligence
Account Basics
Spend & Scope
Procurement Model
Vendor Requirements
Terms & Policies
Entry Strategy
Pain Points & Triggers
Outputs
Pricing Analysis
Benchmarks
Trends
Should-Cost
Indexation
Landed Cost
Commercial Terms
Deliverables
Brand Analysis
Positioning & Value Prop
Share & Presence
Customer Evidence
Go-to-Market
Digital & Reputation
Compliance & Trust
KPIs & Gaps
Outputs
Full Research Suite comprises of:
Market outlook & trends analysis
Interviews & case studies
Strategic recommendations
Vendor profiles & capabilities analysis
5-year forecasts
8 regions and 60+ country-level data splits
Market segment data splits
12 months of continuous data updates
DELIVERED AS:
PDF EXCEL ONLINE
LNG Intermediate Fluid Vaporizer (IFV) Market Size and Share Forecast Outlook 2025 to 2035
LNG Open Rack Vaporizer (ORV) Market Size and Share Forecast Outlook 2025 to 2035
LNG Liquefaction Equipment Market Size and Share Forecast Outlook 2025 to 2035
LNG Marine Gensets Market Size and Share Forecast Outlook 2025 to 2035
LNG Tank Containers Market Size and Share Forecast Outlook 2025 to 2035
LNG Terminal Market Size and Share Forecast Outlook 2025 to 2035
LNG Virtual Pipeline Market Size and Share Forecast Outlook 2025 to 2035
LNG Storage Tank Market Growth - Trends & Forecast 2025 to 2035
Floating LNG Power Vessel Market Growth – Trends & Forecast 2024-2034

Thank you!
You will receive an email from our Business Development Manager. Please be sure to check your SPAM/JUNK folder too.
Chat With
MaRIA