The Bioliquid Heat and Power Generation Market is estimated to be valued at USD 2.9 billion in 2025 and is projected to reach USD 6.2 billion by 2035, registering a compound annual growth rate (CAGR) of 7.8% over the forecast period.
The bioliquid heat and power generation market is growing steadily, supported by the global transition toward low-carbon energy solutions and the increasing utilization of renewable liquid fuels for decentralized energy production. Bioliquids derived from biomass and waste oils are gaining traction as sustainable substitutes for fossil fuels in power generation and combined heat and power systems.
Government incentives and emission-reduction targets have accelerated their adoption in industrial and municipal applications. The market benefits from advancements in combustion and co-firing technologies, which enable efficient conversion of bioliquids into energy while maintaining system compatibility.
Current demand is reinforced by rising energy security concerns and efforts to diversify renewable energy portfolios. With ongoing policy support and technological maturity, bioliquid-based generation is expected to remain a critical component of global energy transition strategies.
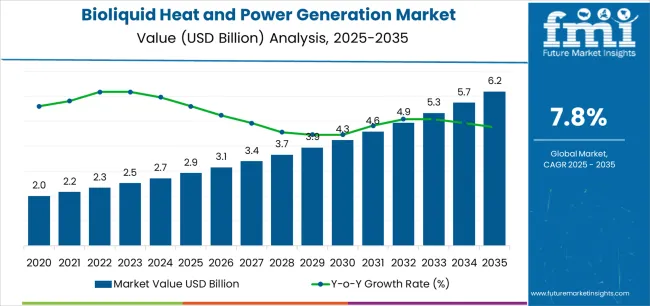
| Metric | Value |
|---|---|
| Bioliquid Heat and Power Generation Market Estimated Value in (2025 E) | USD 2.9 billion |
| Bioliquid Heat and Power Generation Market Forecast Value in (2035 F) | USD 6.2 billion |
| Forecast CAGR (2025 to 2035) | 7.8% |
The market is segmented by Type and Application and region. By Type, the market is divided into Bioethanol and Biodiesel. In terms of Application, the market is classified into Heat Production and Electricity Generation. Regionally, the market is classified into North America, Latin America, Western Europe, Eastern Europe, Balkan & Baltic Countries, Russia & Belarus, Central Asia, East Asia, South Asia & Pacific, and the Middle East & Africa.
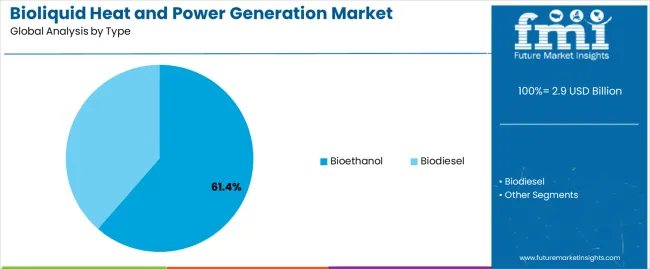
The bioethanol segment holds approximately 61.4% share of the type category in the bioliquid heat and power generation market. This dominance is attributed to its high energy efficiency, widespread availability, and lower carbon footprint compared to conventional fuels.
Bioethanol’s compatibility with existing engine and boiler systems enables seamless integration in both industrial and utility-scale applications. The segment benefits from large-scale production infrastructure and established distribution networks in major economies.
Technological improvements in fermentation and biomass conversion have enhanced fuel yields, further supporting cost competitiveness. With strong policy backing for renewable liquid fuels and expanding demand for sustainable energy alternatives, the bioethanol segment is expected to maintain its leading role in the market’s continued expansion.
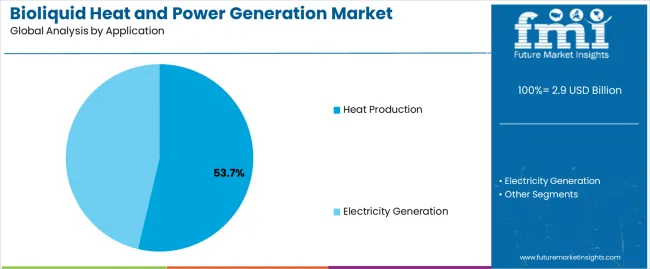
The heat production segment dominates the application category, representing approximately 53.7% of the bioliquid heat and power generation market. This prominence is driven by increasing demand for renewable heat in industrial processing, district heating systems, and commercial operations.
Bioliquids provide consistent energy output suitable for continuous thermal applications, replacing conventional fuels such as heavy oil and natural gas. Their ability to reduce emissions while offering high energy conversion efficiency has reinforced adoption.
The segment’s growth is also supported by retrofitting initiatives in existing heating plants and the integration of combined heat and power configurations. With tightening environmental regulations and a strong policy focus on decarbonizing the heating sector, the heat production segment is projected to sustain its leadership position over the forecast period.
From 2020 to 2025, the bioliquid heat and power generation market experienced a CAGR of 10.3% in market value. The ongoing advancements in bioenergy technologies will likely play a crucial role in the future of the market.
Improved efficiency, cost-effectiveness, and the development of new bioliquid production methods are expected to contribute to the sector's expansion.
The future of the bioliquid heat and power generation market is likely to be marked by continued growth, driven by a global shift towards cleaner and more sustainable energy sources.
Increasing awareness of climate change and environmental concerns may lead to greater adoption of bioenergy solutions. Projections indicate that the global bioliquid heat and power generation market is expected to experience a CAGR of 8.2% from 2025 to 2035.
| Historical CAGR from 2020 to 2025 | 10.3% |
|---|---|
| Forecast CAGR from 2025 to 2035 | 8.2% |
The provided table highlights the top five countries in terms of revenue, with South Korea and the United Kingdom leading the list.
The growth of the bioliquid heat and power generation market in the United Kingdom is driven by the country's commitment to renewable energy targets, policies such as the renewable heat incentive (RHI), and a strategic focus on biomass energy.
In South Korea, the growth of the bioliquid heat and power generation market is propelled by government initiatives promoting renewable energy, including biomass utilization goals and feed-in tariffs.
| Countries | Forecast CAGRs from 2025 to 2035 |
|---|---|
| The United States | 8.5% |
| The United Kingdom | 9.7% |
| China | 9.0% |
| Japan | 9.5% |
| South Korea | 4.9% |
The bioliquid heat and power generation market in the United States is expected to grow with a CAGR of 8.5% from 2025 to 2035. The growth of the bioliquid heat and power generation market in the United States is likely to be influenced by federal and state-level policies supporting renewable energy. Incentives such as tax credits, grants, and loan programs can encourage investment in bioliquid heat and power projects.
Many states have established Renewable Portfolio Standards, requiring a certain percentage of energy to come from renewable sources. This can drive the adoption of bioliquid heat and power technologies to meet these standards.
Policies promoting advanced biofuels, including bioliquids, for heat and power generation can stimulate research, development, and commercialization efforts in the industry.
The bioliquid heat and power generation market in the United Kingdom is expected to grow with a CAGR of 9.7% from 2025 to 2035. The United Kingdom has ambitious renewable energy targets, including a commitment to reach net-zero carbon emissions by 2050. Policies and incentives promoting renewable energy sources, including bioliquids, are likely to drive growth in the bioliquid heat and power generation market.
The United Kingdom government's Renewable Heat Incentive (RHI) has historically provided financial support for renewable heat technologies, including biomass heat and bioliquid heat systems. Continued support through such incentive programs can stimulate market growth.
The United Kingdom biomass energy strategy outlines the role of biomass in meeting renewable energy goals. If there are specific targets or incentives for the use of bioliquids in heat and power generation, it could drive market expansion.
Advancements in bioliquid production technologies and heat and power generation systems can enhance efficiency and make bioliquids more competitive in the United Kingdom energy market.
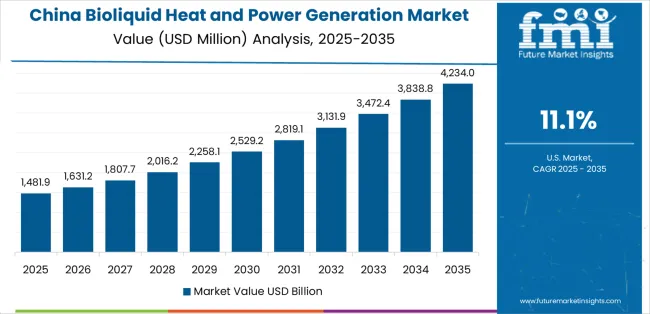
The bioliquid heat and power generation market in China is expected to grow with a CAGR of 9.0% from 2025 to 2035. China has set ambitious renewable energy targets as part of its efforts to address environmental concerns and reduce carbon emissions.
Policies supporting the development of renewable energy sources, including bioliquids, could drive growth in the Bioliquid Heat and Power Generation market.
China has been actively promoting bioenergy and biomass utilization as part of its broader energy strategy. Policies and incentives encouraging the use of biomass, including bioliquids, for heat and power generation can contribute to market growth.
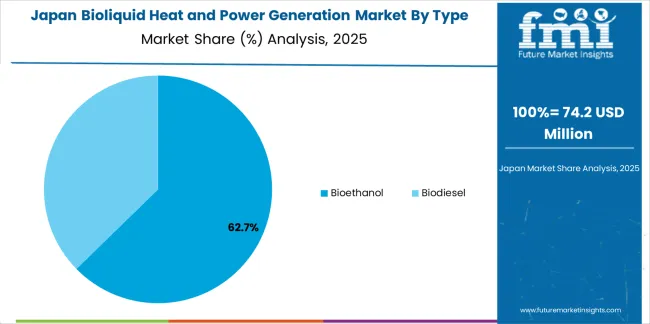
The bioliquid heat and power generation market in Japan is expected to grow with a CAGR of 9.5% from 2025 to 2035. Japan has set ambitious climate change and environmental goals. Bioliquid heat and power generation, with its potential for lower carbon emissions, aligns with Japan's commitments to address climate change and improve environmental sustainability.
Increasing public awareness and acceptance of bioenergy solutions, including bioliquids, can contribute to market growth. Education and outreach efforts may help build support for renewable energy projects.
Advancements in bioliquid production technologies and heat and power generation systems can play a crucial role in the growth of the market. Investments in research and development to improve efficiency and reduce costs could drive adoption.
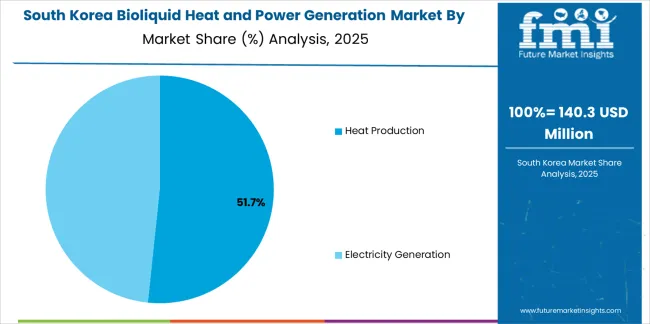
The bioliquid heat and power generation market in South Korea is expected to grow with a CAGR of 4.9% from 2025 to 2035. South Korea has been implementing renewable energy policies to diversify its energy mix and reduce greenhouse gas emissions. Policies and incentives supporting the use of renewable energy sources, including bioliquids, could drive growth in the bioliquid heat and power generation market.
South Korea has set renewable energy targets, and the introduction of Renewable Portfolio Standards could drive the adoption of bioliquids in the energy sector.
The below section shows the leading segment. The bioethanol segment to grow at a CAGR of 7.9 % from 2025 to 2035. Based on application, the heat production segment is anticipated to hold a dominant share through 2035. It is set to exhibit a CAGR of 7.7% from 2025 to 2035.
| Category | CAGR from 2025 to 2035 |
|---|---|
| Bioethanol | 7.9% |
| Heat Production | 7.7% |
Based on type, the bioethanol segment is anticipated to thrive at a CAGR of 7.9% from 2025 to 2035. Bioethanol is considered a renewable energy source because it is produced from biomass, which can be replenished. Unlike fossil fuels, which are finite resources, the production of bioethanol relies on ongoing plant growth and cultivation.
Combusting bioethanol releases carbon dioxide (CO2), but the plants used to produce bioethanol absorb CO2 during their growth. The net carbon footprint is therefore lower compared to fossil fuels, contributing to a reduction in greenhouse gas emissions and mitigating climate change.
Bioethanol helps diversify the energy mix, reducing dependence on conventional fossil fuels and enhancing energy security. All these benefits associated with bioethanol are driving the segmental growth.
Based on application, the heat production segment is anticipated to thrive at a CAGR of 7.7% from 2025 to 2035. The flexibility of bioliquid production from various biomass feedstocks provides versatility in heat generation applications. Different regions can choose feedstocks based on local availability, agricultural practices, and environmental considerations.
Bioliquids, often derived from organic materials like crops or agricultural residues, are renewable and sustainable sources of energy. The use of these materials for heat production aligns with efforts to transition away from finite fossil fuels towards more environmentally friendly alternatives.
Bioliquid heat and power generation contribute to enhanced energy security, particularly in regions seeking to reduce vulnerability to external supply disruptions.
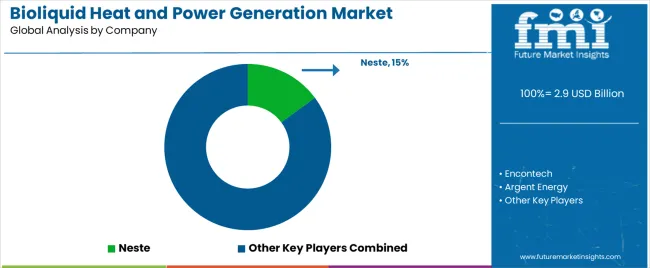
Market players are investing in R&D is crucial for developing advanced bioliquid production technologies, improving efficiency, and exploring new biomass feedstocks. Market players focus on innovation to stay competitive and address challenges related to cost, scalability, and sustainability.
| Attributes | Details |
|---|---|
| Estimated Market Size in 2025 | USD 2.7 billion |
| Projected Market Valuation in 2035 | USD 6 billion |
| Value-based CAGR 2025 to 2035 | 8.2% |
| Forecast Period | 2025 to 2035 |
| Historical Data Available for | 2020 to 2025 |
| Market Analysis | Value in USD billion |
| Key Regions Covered | North America; Latin America; Western Europe; Eastern Europe; South Asia and Pacific; East Asia; Middle East and Africa |
| Key Market Segments Covered | Type, Application, Region |
| Key Countries Profiled | The United States, Canada, Brazil, Mexico, Germany, The United Kingdom, France, Spain, Italy, Russia, Poland, Czech Republic, Romania, India, Bangladesh, Australia, New Zealand, China, Japan, South Korea, GCC countries, South Africa, Israel |
| Key Companies Profiled | Encontech; Argent Energy; Munzer Bioindustrie; Betarenewables; Ensyn Fuels; Bunge; Biox; MBP Group; REG Power Management; Neste; REG; Kraton; BTG; Olleco; Archer Daniels Midland Company; Cargill Inc. |
The global bioliquid heat and power generation market is estimated to be valued at USD 2.9 billion in 2025.
The market size for the bioliquid heat and power generation market is projected to reach USD 6.2 billion by 2035.
The bioliquid heat and power generation market is expected to grow at a 7.8% CAGR between 2025 and 2035.
The key product types in bioliquid heat and power generation market are bioethanol and biodiesel.
In terms of application, heat production segment to command 53.7% share in the bioliquid heat and power generation market in 2025.


Our Research Products

The "Full Research Suite" delivers actionable market intel, deep dives on markets or technologies, so clients act faster, cut risk, and unlock growth.

The Leaderboard benchmarks and ranks top vendors, classifying them as Established Leaders, Leading Challengers, or Disruptors & Challengers.

Locates where complements amplify value and substitutes erode it, forecasting net impact by horizon

We deliver granular, decision-grade intel: market sizing, 5-year forecasts, pricing, adoption, usage, revenue, and operational KPIs—plus competitor tracking, regulation, and value chains—across 60 countries broadly.

Spot the shifts before they hit your P&L. We track inflection points, adoption curves, pricing moves, and ecosystem plays to show where demand is heading, why it is changing, and what to do next across high-growth markets and disruptive tech

Real-time reads of user behavior. We track shifting priorities, perceptions of today’s and next-gen services, and provider experience, then pace how fast tech moves from trial to adoption, blending buyer, consumer, and channel inputs with social signals (#WhySwitch, #UX).

Partner with our analyst team to build a custom report designed around your business priorities. From analysing market trends to assessing competitors or crafting bespoke datasets, we tailor insights to your needs.
Supplier Intelligence
Discovery & Profiling
Capacity & Footprint
Performance & Risk
Compliance & Governance
Commercial Readiness
Who Supplies Whom
Scorecards & Shortlists
Playbooks & Docs
Category Intelligence
Definition & Scope
Demand & Use Cases
Cost Drivers
Market Structure
Supply Chain Map
Trade & Policy
Operating Norms
Deliverables
Buyer Intelligence
Account Basics
Spend & Scope
Procurement Model
Vendor Requirements
Terms & Policies
Entry Strategy
Pain Points & Triggers
Outputs
Pricing Analysis
Benchmarks
Trends
Should-Cost
Indexation
Landed Cost
Commercial Terms
Deliverables
Brand Analysis
Positioning & Value Prop
Share & Presence
Customer Evidence
Go-to-Market
Digital & Reputation
Compliance & Trust
KPIs & Gaps
Outputs
Full Research Suite comprises of:
Market outlook & trends analysis
Interviews & case studies
Strategic recommendations
Vendor profiles & capabilities analysis
5-year forecasts
8 regions and 60+ country-level data splits
Market segment data splits
12 months of continuous data updates
DELIVERED AS:
PDF EXCEL ONLINE
Heat-Treated NiTi Endodontic File Market Size and Share Forecast Outlook 2025 to 2035
Heated Sampling Composite Tube Market Size and Share Forecast Outlook 2025 to 2035
Heat Seal Film Market Size and Share Forecast Outlook 2025 to 2035
Heat Shrink Fitting Machines Market Size and Share Forecast Outlook 2025 to 2035
Heat Detachable Tape Market Size and Share Forecast Outlook 2025 to 2035
Heat Induction Cap Liner Market Size and Share Forecast Outlook 2025 to 2035
Heat Pump Market Size and Share Forecast Outlook 2025 to 2035
Heat Transfer Film Market Size and Share Forecast Outlook 2025 to 2035
Heater-Cooler Devices Market Size and Share Forecast Outlook 2025 to 2035
Heat Sealing Equipment Market Size and Share Forecast Outlook 2025 to 2035
Heat Treating Market Size and Share Forecast Outlook 2025 to 2035
Heating Agents Market Size and Share Forecast Outlook 2025 to 2035
Heat Diffuser Market Size and Share Forecast Outlook 2025 to 2035
Heat Pump Market Analysis - Size, Share, and Forecast Outlook 2025 to 2035
Heat Pump Compressors Market Size and Share Forecast Outlook 2025 to 2035
Heat-Activated Beauty Masks Market Analysis - Size, Share, and Forecast Outlook 2025 to 2035
Heat Exchanger Market Size and Share Forecast Outlook 2025 to 2035
Heat Sealable Packaging Market Size and Share Forecast Outlook 2025 to 2035
Heat Recovery System Generator Market Size and Share Forecast Outlook 2025 to 2035
Heat Shrink Tubes Market Size and Share Forecast Outlook 2025 to 2035

Thank you!
You will receive an email from our Business Development Manager. Please be sure to check your SPAM/JUNK folder too.
Chat With
MaRIA