Heat Induction Cap Liner Market Outlook 2024 to 2034

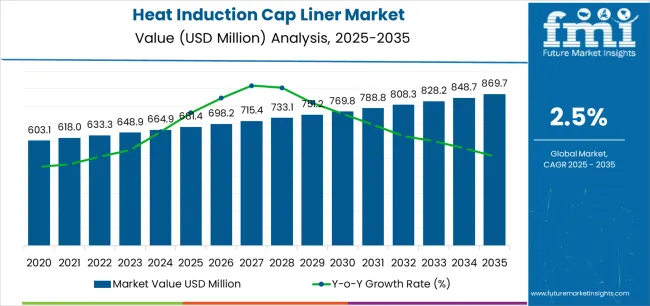
The heat induction cap liner market share is estimated to show consistent growth throughout the forecast period, expanding at a CAGR of 2.6%. The heat induction cap liner market value is expected to expand from US$ 664.1 million in 2024 to US$ 862.4 million by 2034.

Expectations and Growth Trends in the Heat Induction Cap Liner Market

  • Consumers are increasingly choosing easy-to-open lift-up tab packaging. As a result, brands and business owners are opting for Lift ‘n’ Peel foil induction cap liners to seal different containers like jars and bottles to avoid leakages.
  • Rising traction for these hermetically sealed cap liners helps ensure product integrity and prevent spills. End users are thus offering these cap liners to build consumers’ trust in their product and enhance their brand image.
  • Leading manufacturers are raising their investments in robotics technology, as it helps reduce the risk of error and also ensures the quality of products distributed to its customers.
  • Players are finding significant opportunities in different sectors due to heightened consumption of packed food and beverages as well as health-boosting pharmaceutical products.
  • Ongoing advancements in the market like the development of reduced plastic content closure liners.
  • Prominent use of heat induction cap liners in verticals like pharmaceutical, food and beverage, and others, to protect the product’s inside from leakage and contamination.
Attributes Key Insights
Estimated Heat Induction Cap Liner Market Size (2024E) US$ 664.1 million
Projected Heat Induction Cap Liner Industry Value (2034F) US$ 862.4 million
Value-based CAGR (2024 to 2034) 2.6%

Don't pay for what you don't need

Customize your report by selecting specific countries or regions and save 30%!

Category-wise Heat Induction Cap Liner Market Insights

Bottles to Acquire a Massive Market Share Over the Forecast Period

Leading Application Bottles
Value Share (2024) 51.30%

Bottles are expected to dominate the application segment by achieving a share of 51.30% in 2024. Key factors that are driving the growth of the bottles segment are as follows:

  • Consumers are showing an inclination for products packaged with high levels of security and tamper-evident features. Since heat induction cap liners serve this demand by offering a reliable and visible way to maintain product integrity, their use is rising in bottles.
  • Heat induction cap liners (HICLs) assist manufacturers in adhering to regulations by offering a secure and verifiable sealing solution. Stricter regulations enforced by regulatory bodies to ensure consumer safety are projected to boost demand for HICLs for bottles.
  • Growth in eCommerce sector is projected to boost the demand for robust packaging solutions like HICLs.

Food to be a Prominent End Use Sector for Heat Induction Cap Liners

Leading End Use Food
Value Share (2024) 23.80%

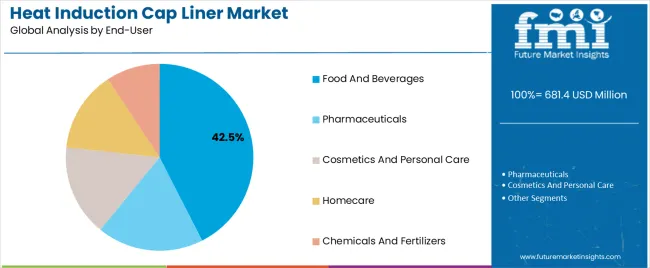
The food segment is expected to lead the heat induction cap liner market. The segment is expected to acquire 23.80% in 2024. Key factors that are promoting the segment’s growth are as follows:

  • Surging demand for safe and secure packaging to protect the product from contamination is expected to boost demand for HICLs in food sector.
  • Manufacturers have started developing heat induction cap liners composed of sustainable materials like bioplastics to serve the increasing demand for eco-friendly packaging solutions.

Heat Induction Cap Liner Market Analysis by Country

Countries Forecast CAGR (2024 to 2034)
The United States 1.70%
Spain 2.50%
India 4.70%
China 3.70%
Thailand 2.90%

Food Companies in the United States are Using Packaging that is Easier to Open for Consumer Convenience

The heat induction cap liner market in the United States is expected to register a CAGR of 1.7% through 2034. The market dynamics are impacted by following factors:

  • The packaging industry in mature markets is bent on developing sophisticated closures to meet market expansions for enhanced customer convenience. This is offering a conducive environment for the use of heat induction cap liners to drive consumer satisfaction.
  • Requirements for hygiene and tamper-evidence in the food and pharmaceuticals industry are propelling the demand for heat sealing liners.
  • Latest generation of induction liners are increasingly being mass-produced with a half-moon tab for easy peelability, even by those with restricted mobility and dexterity. Big names in the food and beverage market are using these liners to raise consumer confidence, prevent leakage and guarantee product integrity.

Development of Advanced Induction Seals to Promote Market Growth in Spain

The heat induction cap liner industry in Spain is projected to be propelled by a 2.5% CAGR from 2024 to 2034. Growth in Spain is driven by:

  • Induction sealing guarantees counterfeit protection to users. Customers usually look for intact induction sealing to confirm that they are not consuming any modified product. Heat induction cap liners are especially valuable in the pharmaceutical industry as counterfeit machines have become a significant concern. As per the statistics, as many as 1 million people die annually due to ingestion of counterfeit medicines.
  • Development of advanced induction seals with options like electronic (RFID) codes, etched or engraved foil, custom colors and inks with DNA added, and color-shifting inks.

Businesses in India to Take up Heat Induction Cap Liners Due to their Sustainability Quotient

Heat induction cap liner market in India is expected to hold a high potential for leading manufacturers. The market in India is estimated to record a CAGR of 4.7% through 2034. Following factors propel the market:

  • By using induction sealing, manufacturers can decrease the thickness of the foil and the amount of plastic utilized in the bottle and closure. Thus, making it an eco-friendlier packaging option. Manufacturers are highlighting the sustainability aspect of heat induction cap liners to increase their appeal among eco-conscious businesses.
  • Increasing availability of heat induction cap liners in customized color and sizes. Their demand is increasing in end use sectors as they offer convenience by being tamper-resistant, waterproof, air-tight, and leakage-free.

Appeal for Heat Induction Cap Liners to Increase in China as Businesses Seek Options to Reduce Unit Cost

Demand for heat induction cap liners in China is estimated to register a CAGR of 3.7% over the forecast period. Key factors that are compelling market growth are:

  • Increasing demand for heat induction cap liners to ensure product freshness as they act as a hermetic seal that prevents moisture and oxygen transmission into the product.
  • Surging adoption of packaging options like heat induction cap liners that the elderly population can easily remove.
  • Several manufacturers are switching to this sealing option to reduce downtime, maintenance, and costs from recalled products that have leaked, and extend shelf life.

Accessibility to End-user is a Vital Factor that is Driving the Demand for Heat Induction Cap Liners in Thailand

Sales of heat induction cap liners in Thailand are rising at a CAGR of 2.9% through 2034. Over the forecast period, the market is driven by following factors:
  • Pharmaceutical companies require packaging that is both accessible and tamper-evident for end-user to meet the demands of regulators and consumers. Induction sealing utilizing the correct lining material can achieve both aims. As a result, they are finding heightened use in pharma firms.
  • Rising demand for packaging that is easy to use, especially by customers with limited dexterity or strength, is creating a market for heat induction cap liners.
Ismail Sutaria
Ismail Sutaria

Principal Consultant

Talk to Analyst

Find your sweet spots for generating winning opportunities in this market.

Latest Developments Taken Place in Heat Induction Cap Liner Market

  • In January 2024, TekniPlex Consumer Products developed a series of paper-based, recyclable induction heat seal liners called ProTecSeals Recyclable IHS Liners. These are designed to seal dry nutrition, pharma, and food products in jars and bottles with similar protective properties as conventional solutions. They are said to resist leaks, prevent contamination, provide oxygen and moisture barrier properties, and prolong shelf life.
  • In November 2021, Amcor introduced IMPRESSIONS, which is a technology that is created in collaboration with MGJ, that facilitates brands to customize closure liners like underside of bottle caps. Additionally, brands are able to print anything like colorful logos and QR codes for direct and digital engagement with customers with the help of CMYK color printing technology.

Top Strategies Adopted by Heat Induction Cap Liner Market Players

Manufacturers of heat induction cap liners are increasing and upgrading their line of induction cap liners to meet the rising demand for hygienic and sanitized product packaging from on-the-go customers. Players are also focusing on design to drive optimum customer convenience.

Market participants are targeting end use industries like food and beverages where demand for heat induction cap liners is high. As a result, they are raising their production capability to produce heat induction cap liners developed to be compatible with the altering requirements of end users.

Constant progress made in induction sealing technology has also paved the way for smart and more advanced induction cap liners. Heat induction cap liner manufacturers are focusing on high growth countries in South East Asia, like India and China, where appetite of millennial population is significantly high for on-the-go food and beverage products. By focusing on consumer convenience, players can boost wider adoption.

Get the data you need at a Fraction of the cost

Personalize your report by choosing insights you need
and save 40%!

Key Coverage in the Global Heat Induction Cap Liner Market Research Report

  • Strategic Assessment of Global Heat Induction Cap Liner Market
  • Heat Induction Cap Liner Market Revenue by Segments
  • Heat Induction Cap Liners Manufacturers and Suppliers in the United States, Spain, and India

Key Players in Heat Induction Cap Liner Market

  • Tekni-plex, Inc.
  • Selig Group
  • Bluemay Weston Limited
  • B&B Cap Liners LLC
  • Pres-On Corporation
  • Low's Capseal Sdn Bhd
  • Well-Pack Industries Co, Ltd.
  • Tien Lik Cap Seal Sdn Bhd
  • Captel International Pvt Ltd.
  • Others

Heat Induction Cap Liner Market by Category

By Material:

  • Rubber
  • Metal (foil)
  • Plastic
  • Paper

Based on Application:

  • Bottles
  • Jars

By End-user:

  • Food and Beverages
  • Pharmaceuticals
  • Cosmetics and Personal Care
  • Homecare
  • Chemicals and Fertilizers

By Region:

  • North America
  • Europe
  • Asia Pacific
  • Middle East and Africa
  • Latin America

Frequently Asked Questions

How Big Will be the Heat Induction Cap Liner Industry in 2024?

The market is estimated to account for US$ 664.1 million in 2024.

At What Rate Will the Heat Induction Cap Liner Industry Grow?

Throughout the forecast period, the heat induction cap liner industry is projected to register a CAGR of 2.6%.

What is the Expected Value of the Heat Induction Cap Liner Industry by 2034?

By 2034, the heat induction cap liner industry is forecast to be worth US$ 862.4 million.

Which End Use is Expected to Acquire a Significant Share in the Heat Induction Cap Liner Industry?

Food segment is expected to obtain a considerable value share in the heat induction cap liner industry.

Which Country is Projected to Find Significant Growth Opportunities?

India is expected to find substantial growth prospects in the future.

Who are the Leading Companies in the Heat Induction Cap Liner Industry?

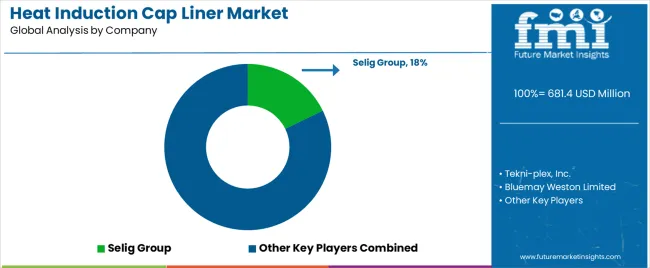
Leading companies in the heat induction cap liner industry include Selig Group, Bluemay Weston Limited, and B&B Cap Liners LLC.

Table of Content
1. Executive Summary
    1.1. Global Market Outlook
    1.2. Demand-side Trends
    1.3. Supply-side Trends
    1.4. Technology Roadmap Analysis
    1.5. Analysis and Recommendations
2. Market Overview
    2.1. Market Coverage / Taxonomy
    2.2. Market Definition / Scope / Limitations
3. Market Background
    3.1. Market Dynamics
        3.1.1. Drivers
        3.1.2. Restraints
        3.1.3. Opportunity
        3.1.4. Trends
    3.2. Scenario Forecast
        3.2.1. Demand in Optimistic Scenario
        3.2.2. Demand in Likely Scenario
        3.2.3. Demand in Conservative Scenario
    3.3. Opportunity Map Analysis
    3.4. Product Life Cycle Analysis
    3.5. Supply Chain Analysis
        3.5.1. Supply Side Participants and their Roles
            3.5.1.1. Manufacturer
            3.5.1.2. Mid-Level Participants (Traders)
            3.5.1.3. Distributors
        3.5.2. Value Added and Value Created at Node in the Supply Chain
        3.5.3. List of Raw Material Suppliers
        3.5.4. List of Existing and Potential Buyer’s
    3.6. Investment Feasibility Matrix
    3.7. Value Chain Analysis
        3.7.1. Profit Margin Analysis
        3.7.2. Distributors
    3.8. PESTLE and Porter’s Analysis
    3.9. Regulatory Landscape
        3.9.1. By Key Regions
        3.9.2. By Key Countries
    3.10. Regional Parent Market Outlook
    3.11. Production and Consumption Statistics
    3.12. Import and Export Statistics
4. Global Market Analysis 2019 to 2023 and Forecast, 2024 to 2034
    4.1. Historical Market Size Value (US$ Million) & Volume (Units) Analysis, 2019 to 2023
    4.2. Current and Future Market Size Value (US$ Million) & Volume (Units) Projections, 2024 to 2034
        4.2.1. Y-o-Y Growth Trend Analysis
        4.2.2. Absolute $ Opportunity Analysis
5. Global Market Analysis 2019 to 2023 and Forecast 2024 to 2034, By Material
    5.1. Introduction / Key Findings
    5.2. Historical Market Size Value (US$ Million) & Volume (Units) Analysis By Material, 2019 to 2023
    5.3. Current and Future Market Size Value (US$ Million) & Volume (Units) Analysis and Forecast By Material, 2024 to 2034
        5.3.1. Rubber
        5.3.2. Metal (Foil)
        5.3.3. Plastic
        5.3.4. Paper
    5.4. Y-o-Y Growth Trend Analysis By Material, 2019 to 2023
    5.5. Absolute $ Opportunity Analysis By Material, 2024 to 2034
6. Global Market Analysis 2019 to 2023 and Forecast 2024 to 2034, By Application
    6.1. Introduction / Key Findings
    6.2. Historical Market Size Value (US$ Million) & Volume (Units) Analysis By Application, 2019 to 2023
    6.3. Current and Future Market Size Value (US$ Million) & Volume (Units) Analysis and Forecast By Application, 2024 to 2034
        6.3.1. Bottles
        6.3.2. Jars
    6.4. Y-o-Y Growth Trend Analysis By Application, 2019 to 2023
    6.5. Absolute $ Opportunity Analysis By Application, 2024 to 2034
7. Global Market Analysis 2019 to 2023 and Forecast 2024 to 2034, By End-User
    7.1. Introduction / Key Findings
    7.2. Historical Market Size Value (US$ Million) & Volume (Units) Analysis By End-User, 2019 to 2023
    7.3. Current and Future Market Size Value (US$ Million) & Volume (Units) Analysis and Forecast By End-User, 2024 to 2034
        7.3.1. Food & Beverages
        7.3.2. Pharmaceuticals
        7.3.3. Cosmetics & Personal Care
        7.3.4. Homecare
        7.3.5. Chemicals & Fertilizers
    7.4. Y-o-Y Growth Trend Analysis By End-User, 2019 to 2023
    7.5. Absolute $ Opportunity Analysis By End-User, 2024 to 2034
8. Global Market Analysis 2019 to 2023 and Forecast 2024 to 2034, By Region
    8.1. Introduction
    8.2. Historical Market Size Value (US$ Million) & Volume (Units) Analysis By Region, 2019 to 2023
    8.3. Current Market Size Value (US$ Million) & Volume (Units) Analysis and Forecast By Region, 2024 to 2034
        8.3.1. North America
        8.3.2. Latin America
        8.3.3. Western Europe
        8.3.4. Eastern Europe
        8.3.5. South Asia and Pacific
        8.3.6. East Asia
        8.3.7. Middle East and Africa
    8.4. Market Attractiveness Analysis By Region
9. North America Market Analysis 2019 to 2023 and Forecast 2024 to 2034, By Country
    9.1. Historical Market Size Value (US$ Million) & Volume (Units) Trend Analysis By Market Taxonomy, 2019 to 2023
    9.2. Market Size Value (US$ Million) & Volume (Units) Forecast By Market Taxonomy, 2024 to 2034
        9.2.1. By Country
            9.2.1.1. USA
            9.2.1.2. Canada
        9.2.2. By Material
        9.2.3. By Application
        9.2.4. By End-User
    9.3. Market Attractiveness Analysis
        9.3.1. By Country
        9.3.2. By Material
        9.3.3. By Application
        9.3.4. By End-User
    9.4. Key Takeaways
10. Latin America Market Analysis 2019 to 2023 and Forecast 2024 to 2034, By Country
    10.1. Historical Market Size Value (US$ Million) & Volume (Units) Trend Analysis By Market Taxonomy, 2019 to 2023
    10.2. Market Size Value (US$ Million) & Volume (Units) Forecast By Market Taxonomy, 2024 to 2034
        10.2.1. By Country
            10.2.1.1. Brazil
            10.2.1.2. Mexico
            10.2.1.3. Rest of Latin America
        10.2.2. By Material
        10.2.3. By Application
        10.2.4. By End-User
    10.3. Market Attractiveness Analysis
        10.3.1. By Country
        10.3.2. By Material
        10.3.3. By Application
        10.3.4. By End-User
    10.4. Key Takeaways
11. Western Europe Market Analysis 2019 to 2023 and Forecast 2024 to 2034, By Country
    11.1. Historical Market Size Value (US$ Million) & Volume (Units) Trend Analysis By Market Taxonomy, 2019 to 2023
    11.2. Market Size Value (US$ Million) & Volume (Units) Forecast By Market Taxonomy, 2024 to 2034
        11.2.1. By Country
            11.2.1.1. Germany
            11.2.1.2. UK
            11.2.1.3. France
            11.2.1.4. Spain
            11.2.1.5. Italy
            11.2.1.6. Rest of Western Europe
        11.2.2. By Material
        11.2.3. By Application
        11.2.4. By End-User
    11.3. Market Attractiveness Analysis
        11.3.1. By Country
        11.3.2. By Material
        11.3.3. By Application
        11.3.4. By End-User
    11.4. Key Takeaways
12. Eastern Europe Market Analysis 2019 to 2023 and Forecast 2024 to 2034, By Country
    12.1. Historical Market Size Value (US$ Million) & Volume (Units) Trend Analysis By Market Taxonomy, 2019 to 2023
    12.2. Market Size Value (US$ Million) & Volume (Units) Forecast By Market Taxonomy, 2024 to 2034
        12.2.1. By Country
            12.2.1.1. Poland
            12.2.1.2. Russia
            12.2.1.3. Czech Republic
            12.2.1.4. Romania
            12.2.1.5. Rest of Eastern Europe
        12.2.2. By Material
        12.2.3. By Application
        12.2.4. By End-User
    12.3. Market Attractiveness Analysis
        12.3.1. By Country
        12.3.2. By Material
        12.3.3. By Application
        12.3.4. By End-User
    12.4. Key Takeaways
13. South Asia and Pacific Market Analysis 2019 to 2023 and Forecast 2024 to 2034, By Country
    13.1. Historical Market Size Value (US$ Million) & Volume (Units) Trend Analysis By Market Taxonomy, 2019 to 2023
    13.2. Market Size Value (US$ Million) & Volume (Units) Forecast By Market Taxonomy, 2024 to 2034
        13.2.1. By Country
            13.2.1.1. India
            13.2.1.2. Bangladesh
            13.2.1.3. Australia
            13.2.1.4. New Zealand
            13.2.1.5. Rest of South Asia and Pacific
        13.2.2. By Material
        13.2.3. By Application
        13.2.4. By End-User
    13.3. Market Attractiveness Analysis
        13.3.1. By Country
        13.3.2. By Material
        13.3.3. By Application
        13.3.4. By End-User
    13.4. Key Takeaways
14. East Asia Market Analysis 2019 to 2023 and Forecast 2024 to 2034, By Country
    14.1. Historical Market Size Value (US$ Million) & Volume (Units) Trend Analysis By Market Taxonomy, 2019 to 2023
    14.2. Market Size Value (US$ Million) & Volume (Units) Forecast By Market Taxonomy, 2024 to 2034
        14.2.1. By Country
            14.2.1.1. China
            14.2.1.2. Japan
            14.2.1.3. South Korea
        14.2.2. By Material
        14.2.3. By Application
        14.2.4. By End-User
    14.3. Market Attractiveness Analysis
        14.3.1. By Country
        14.3.2. By Material
        14.3.3. By Application
        14.3.4. By End-User
    14.4. Key Takeaways
15. Middle East and Africa Market Analysis 2019 to 2023 and Forecast 2024 to 2034, By Country
    15.1. Historical Market Size Value (US$ Million) & Volume (Units) Trend Analysis By Market Taxonomy, 2019 to 2023
    15.2. Market Size Value (US$ Million) & Volume (Units) Forecast By Market Taxonomy, 2024 to 2034
        15.2.1. By Country
            15.2.1.1. GCC Countries
            15.2.1.2. South Africa
            15.2.1.3. Israel
            15.2.1.4. Rest of MEA
        15.2.2. By Material
        15.2.3. By Application
        15.2.4. By End-User
    15.3. Market Attractiveness Analysis
        15.3.1. By Country
        15.3.2. By Material
        15.3.3. By Application
        15.3.4. By End-User
    15.4. Key Takeaways
16. Key Countries Market Analysis
    16.1. USA
        16.1.1. Pricing Analysis
        16.1.2. Market Share Analysis, 2023
            16.1.2.1. By Material
            16.1.2.2. By Application
            16.1.2.3. By End-User
    16.2. Canada
        16.2.1. Pricing Analysis
        16.2.2. Market Share Analysis, 2023
            16.2.2.1. By Material
            16.2.2.2. By Application
            16.2.2.3. By End-User
    16.3. Brazil
        16.3.1. Pricing Analysis
        16.3.2. Market Share Analysis, 2023
            16.3.2.1. By Material
            16.3.2.2. By Application
            16.3.2.3. By End-User
    16.4. Mexico
        16.4.1. Pricing Analysis
        16.4.2. Market Share Analysis, 2023
            16.4.2.1. By Material
            16.4.2.2. By Application
            16.4.2.3. By End-User
    16.5. Germany
        16.5.1. Pricing Analysis
        16.5.2. Market Share Analysis, 2023
            16.5.2.1. By Material
            16.5.2.2. By Application
            16.5.2.3. By End-User
    16.6. UK
        16.6.1. Pricing Analysis
        16.6.2. Market Share Analysis, 2023
            16.6.2.1. By Material
            16.6.2.2. By Application
            16.6.2.3. By End-User
    16.7. France
        16.7.1. Pricing Analysis
        16.7.2. Market Share Analysis, 2023
            16.7.2.1. By Material
            16.7.2.2. By Application
            16.7.2.3. By End-User
    16.8. Spain
        16.8.1. Pricing Analysis
        16.8.2. Market Share Analysis, 2023
            16.8.2.1. By Material
            16.8.2.2. By Application
            16.8.2.3. By End-User
    16.9. Italy
        16.9.1. Pricing Analysis
        16.9.2. Market Share Analysis, 2023
            16.9.2.1. By Material
            16.9.2.2. By Application
            16.9.2.3. By End-User
    16.10. Poland
        16.10.1. Pricing Analysis
        16.10.2. Market Share Analysis, 2023
            16.10.2.1. By Material
            16.10.2.2. By Application
            16.10.2.3. By End-User
    16.11. Russia
        16.11.1. Pricing Analysis
        16.11.2. Market Share Analysis, 2023
            16.11.2.1. By Material
            16.11.2.2. By Application
            16.11.2.3. By End-User
    16.12. Czech Republic
        16.12.1. Pricing Analysis
        16.12.2. Market Share Analysis, 2023
            16.12.2.1. By Material
            16.12.2.2. By Application
            16.12.2.3. By End-User
    16.13. Romania
        16.13.1. Pricing Analysis
        16.13.2. Market Share Analysis, 2023
            16.13.2.1. By Material
            16.13.2.2. By Application
            16.13.2.3. By End-User
    16.14. India
        16.14.1. Pricing Analysis
        16.14.2. Market Share Analysis, 2023
            16.14.2.1. By Material
            16.14.2.2. By Application
            16.14.2.3. By End-User
    16.15. Bangladesh
        16.15.1. Pricing Analysis
        16.15.2. Market Share Analysis, 2023
            16.15.2.1. By Material
            16.15.2.2. By Application
            16.15.2.3. By End-User
    16.16. Australia
        16.16.1. Pricing Analysis
        16.16.2. Market Share Analysis, 2023
            16.16.2.1. By Material
            16.16.2.2. By Application
            16.16.2.3. By End-User
    16.17. New Zealand
        16.17.1. Pricing Analysis
        16.17.2. Market Share Analysis, 2023
            16.17.2.1. By Material
            16.17.2.2. By Application
            16.17.2.3. By End-User
    16.18. China
        16.18.1. Pricing Analysis
        16.18.2. Market Share Analysis, 2023
            16.18.2.1. By Material
            16.18.2.2. By Application
            16.18.2.3. By End-User
    16.19. Japan
        16.19.1. Pricing Analysis
        16.19.2. Market Share Analysis, 2023
            16.19.2.1. By Material
            16.19.2.2. By Application
            16.19.2.3. By End-User
    16.20. South Korea
        16.20.1. Pricing Analysis
        16.20.2. Market Share Analysis, 2023
            16.20.2.1. By Material
            16.20.2.2. By Application
            16.20.2.3. By End-User
    16.21. GCC Countries
        16.21.1. Pricing Analysis
        16.21.2. Market Share Analysis, 2023
            16.21.2.1. By Material
            16.21.2.2. By Application
            16.21.2.3. By End-User
    16.22. South Africa
        16.22.1. Pricing Analysis
        16.22.2. Market Share Analysis, 2023
            16.22.2.1. By Material
            16.22.2.2. By Application
            16.22.2.3. By End-User
    16.23. Israel
        16.23.1. Pricing Analysis
        16.23.2. Market Share Analysis, 2023
            16.23.2.1. By Material
            16.23.2.2. By Application
            16.23.2.3. By End-User
17. Market Structure Analysis
    17.1. Competition Dashboard
    17.2. Competition Benchmarking
    17.3. Market Share Analysis of Top Players
        17.3.1. By Regional
        17.3.2. By Material
        17.3.3. By Application
        17.3.4. By End-User
18. Competition Analysis
    18.1. Competition Deep Dive
        18.1.1. Tekni-plex, Inc
            18.1.1.1. Overview
            18.1.1.2. Product Portfolio
            18.1.1.3. Profitability by Market Segments
            18.1.1.4. Sales Footprint
            18.1.1.5. Strategy Overview
                18.1.1.5.1. Marketing Strategy
                18.1.1.5.2. Product Strategy
                18.1.1.5.3. Channel Strategy
        18.1.2. Selig Group
            18.1.2.1. Overview
            18.1.2.2. Product Portfolio
            18.1.2.3. Profitability by Market Segments
            18.1.2.4. Sales Footprint
            18.1.2.5. Strategy Overview
                18.1.2.5.1. Marketing Strategy
                18.1.2.5.2. Product Strategy
                18.1.2.5.3. Channel Strategy
        18.1.3. Bluemay Weston Limited
            18.1.3.1. Overview
            18.1.3.2. Product Portfolio
            18.1.3.3. Profitability by Market Segments
            18.1.3.4. Sales Footprint
            18.1.3.5. Strategy Overview
                18.1.3.5.1. Marketing Strategy
                18.1.3.5.2. Product Strategy
                18.1.3.5.3. Channel Strategy
        18.1.4. B&B Cap Liners LLC
            18.1.4.1. Overview
            18.1.4.2. Product Portfolio
            18.1.4.3. Profitability by Market Segments
            18.1.4.4. Sales Footprint
            18.1.4.5. Strategy Overview
                18.1.4.5.1. Marketing Strategy
                18.1.4.5.2. Product Strategy
                18.1.4.5.3. Channel Strategy
        18.1.5. Pres-On Corporation
            18.1.5.1. Overview
            18.1.5.2. Product Portfolio
            18.1.5.3. Profitability by Market Segments
            18.1.5.4. Sales Footprint
            18.1.5.5. Strategy Overview
                18.1.5.5.1. Marketing Strategy
                18.1.5.5.2. Product Strategy
                18.1.5.5.3. Channel Strategy
        18.1.6. Low's Capseal Sdn Bhd
            18.1.6.1. Overview
            18.1.6.2. Product Portfolio
            18.1.6.3. Profitability by Market Segments
            18.1.6.4. Sales Footprint
            18.1.6.5. Strategy Overview
                18.1.6.5.1. Marketing Strategy
                18.1.6.5.2. Product Strategy
                18.1.6.5.3. Channel Strategy
        18.1.7. Well-Pack Industries Co, Ltd
            18.1.7.1. Overview
            18.1.7.2. Product Portfolio
            18.1.7.3. Profitability by Market Segments
            18.1.7.4. Sales Footprint
            18.1.7.5. Strategy Overview
                18.1.7.5.1. Marketing Strategy
                18.1.7.5.2. Product Strategy
                18.1.7.5.3. Channel Strategy
        18.1.8. Tien Lik Cap Seal Sdn Bhd
            18.1.8.1. Overview
            18.1.8.2. Product Portfolio
            18.1.8.3. Profitability by Market Segments
            18.1.8.4. Sales Footprint
            18.1.8.5. Strategy Overview
                18.1.8.5.1. Marketing Strategy
                18.1.8.5.2. Product Strategy
                18.1.8.5.3. Channel Strategy
        18.1.9. Captel International Pvt Ltd
            18.1.9.1. Overview
            18.1.9.2. Product Portfolio
            18.1.9.3. Profitability by Market Segments
            18.1.9.4. Sales Footprint
            18.1.9.5. Strategy Overview
                18.1.9.5.1. Marketing Strategy
                18.1.9.5.2. Product Strategy
                18.1.9.5.3. Channel Strategy
19. Assumptions & Acronyms Used
20. Research Methodology
Recommendations

Packaging

Cap Liner Market

March 2024

REP-GB-4451

306 pages

Packaging

Foam Cap Liners Market

July 2021

REP-GB-13444

250 pages

Explore Packaging Insights

View Reports
Future Market Insights

Heat Induction Cap Liner Market

Schedule a Call