Heat Seal Film Market Size and Share Forecast Outlook From 2024 to 2034

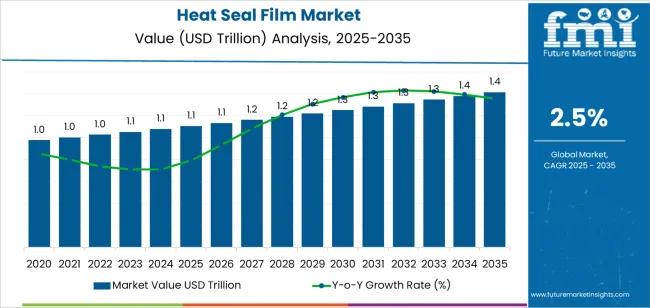
The heat seal film market is expected to grow at a CAGR of 2.5% during the projected period. The market value is projected to increase from USD 1,078.2 million in 2024 to USD 1,380.2 million by 2034.

Heat Seal Film Market Size, Analysis, and Insights

  • With the growing busy lifestyle of consumers, there is a rising demand for convenience foods and packaged foods, driving sales of heat seal films.
  • Heat seal films are widely used in the packaging of medical devices, pharmaceutical products, and other consumer goods, further driving the market forward.
  • Consumers are becoming increasingly concerned about the quality and safety of the food they consume, which is leading to a shift towards packaged foods that offer better protection against contamination.
  • Growing adoption of eCommerce is driving the demand for heat seal films.
  • With the rise of online shopping, there is a growing need for secure and durable packaging materials that can protect products during transit.
  • Rising demand for sustainable packaging solutions.
  • Heat seal films made from biodegradable materials are gaining popularity, as they offer a more environmentally friendly alternative to traditional plastic films.
Attributes Details
Heat Seal Film Market Size, 2024 USD 1,078.2 billion
Projected Market Size, 2034 USD 1,380.2 billion
Value-based CAGR (2024 to 2034) 2.5%

Lucrative Opportunities Transforming the Heat Seal Film Market

  • Increasing demand for flexible packaging across various end-use industries, driving the product sales.
  • Heat seal films are extensively used for packaging applications due to their excellent heat-sealing properties and ability to offer high barrier protection against moisture, oxygen, and light.
  • Expansion of the food and beverage industry, which is a key end-user of heat seal films.
  • With the increasing demand for convenience foods and ready-to-eat meals, the need for high-quality and efficient packaging solutions is on the rise.
  • The market expansion presents an opportunity for heat seal film manufacturers to develop customized solutions that meet the specific requirements of the food and beverage industry.
  • Growing trend toward the adoption of digital printing technologies in the packaging industry.
  • Digital printing technologies present an opportunity for heat seal film manufacturers to offer customized and personalized packaging solutions that cater to the evolving needs of consumers.

Factors Restraining the Demand for Heat Seal Films

  • Increasing competition among the players is expected to hamper the market growth during the forecast period.
  • The market is highly fragmented, with numerous small and large players operating in it. Competition leads to price wars, which are adversely affecting the profit margins of the manufacturers.
  • The increasing use of alternative packaging materials.
  • Consumers are increasingly becoming aware of the environmental impact of plastic packaging and are demanding more sustainable options.
  • Demand for sustainability led to a shift towards eco-friendly packaging materials such as paper, glass, and biodegradable plastics, which are posing a threat to the growth of the Heat seal film market.
  • Fluctuating prices of raw materials like polyethylene and polypropylene are impacting the Heat seal film market.
  • The prices of these materials are influenced by factors such as global demand and supply, exchange rates, and geopolitical tensions.
  • Price fluctuation makes it difficult for manufacturers to predict their costs and plan their pricing strategies accordingly.
  • Regulatory challenges are anticipated to hinder the market growth in the coming years.
  • Governments across the world are imposing stringent regulations on the use of plastic packaging to reduce plastic waste and promote sustainability.
  • Regulations are leading to increased compliance costs for the manufacturers, which are affecting their profitability.

Heat Seal Film Industry Analysis by Top Investment Segments

In terms of Layer Structure, the Monolayer Films Segment Leads the Market Growth

Attributes Details
Top Layer Structure Monolayer Films
Market Share in 2024 69.4%
  • Ease of processing and lower production costs of monolayer films make them more cost-effective for manufacturers.
  • Monolayer films are dominating the market due to their versatility.
  • They can be used for a wide range of applications, including food packaging, pharmaceuticals, and industrial products.
  • Monolayer films are likely to be customized to meet specific requirements, such as high-temperature resistance, puncture resistance, and UV protection.
  • Increasing demand for packaged food and beverages is also driving the growth of the monolayer film segment.

In terms of End Use, the Meat, Poultry and Seafood Segment Dominates the Market

Attributes Details
Top End Use Meat, poultry and Seafood
Market Share in 2024 51.4%
  • Increasing demand for packaged meat and seafood products, driven by the growth of the food industry and changing consumer preferences.
  • The high barrier properties of heat seal films prevent the entry of moisture, oxygen, and other contaminants, which can cause spoilage and reduce the shelf life of the products.
  • Consumers are increasingly looking for quick and easy meal solutions, and pre-packaged meat and seafood products meet this need.
  • Heat seal films make it possible to package these products in a way that is convenient for consumers while maintaining the quality and safety of the products.

Analysis of Top Countries Manufacturing, Certifying, Exporting, and Using Heat Seal Films

Countries CAGR through 2034
China 4.4%
India 5.3%
Thailand 4.0%
South Korea 2.3%
Spain 2.3%

Rapid Development of the eCommerce Industry in China

  • Growing population and increasing disposable incomes are leading to a rise in demand for packaged food, beverages, and consumer goods, which in turn is driving the demand for heat seal films.
  • The rapid development of the e-commerce industry in China has created a huge demand for heat seal films for packaging and shipping products.
  • Chinese government's focus on improving food safety regulations lead to a rise in demand for high-quality packaging materials like heat seal films.
  • The Chinese market is highly competitive, with numerous local players vying for market share.
  • Intense price competition is observed, which is driving down the prices of heat seal films in China.
  • Chinese consumers have a strong preference for environmentally friendly packaging materials, which is driving the demand for biodegradable heat seal films.

Rising Government Initiatives to Boost Manufacturing in India

  • Growth of the food and beverage industry, the increasing demand for packaged goods, and the rise of the e-commerce sector.
  • The Indian government's policies to boost manufacturing and exports are also driving the demand for heat seal films in the country.
  • Indian market is characterized by a large number of small and medium-sized players, which leads to fragmentation and low margins.
  • The lack of standardization and quality control in the Indian market is expected to hamper the market during the forecast period.
  • Growing demand for flexible packaging materials in India.

Rising Need for Sustainable and Eco-Friendly Packaging Solutions in South Korea

  • Growing demand for pharmaceutical and healthcare products in South Korea.
  • Rise in the demand for packaged food and beverages in South Korea has also contributed to the growth of the heat seal film market.
  • Heat seal films are widely used in South Korea for packaging coffee, tea, and other beverage products, as well as for packaging snacks and confectionery items.
  • Increasing demand for sustainable and eco-friendly packaging solutions in South Korea.
  • Heat seal films that are made from bio-based materials are becoming increasingly popular in South Korea, as consumers are becoming more environmentally conscious and are looking for packaging solutions that are biodegradable and compostable.

Impact of Packaging Waste on the Environment in Thailand

  • Increasing demand for convenience food packaging in Thailand.
  • With the busy lifestyles of consumers in Thailand, there is a growing demand for food products that are easy to prepare and consume on the go.
  • Heat seal films provide a cost-effective and convenient packaging solution for such products, which has led to an increase in their demand.
  • Consumers in Thailand are becoming more conscious about the impact of packaging waste on the environment, and are looking for packaging solutions that are eco-friendly and biodegradable.
  • Heat seal films made from bio-based materials are becoming increasingly popular in Thailand as a result.

Increasing Demand for Cosmetics and Personal Care Products in Spain

  • Increasing demand for cosmetics and personal care products is also driving the demand for heat seal films in Spain.
  • Heat seal films are widely used for packaging cosmetic products, such as creams, lotions, and serums, as they provide a secure and hygienic packaging solution in Spain.
  • With the growth of the cosmetics industry in Spain, the demand for heat seal films in this sector is expected to rise significantly.
  • The demand for heat seal films in Spain is expected to continue to grow in the coming years, driven by increasing demand for convenience food packaging, the growth of the healthcare industry, and the increasing demand for sustainable packaging solutions.

Key Heat Seal Film Market Players and Concentration

The market is highly fragmented due to the presence of several players. For instance, Amcor Limited has a strong focus on sustainability and offers several eco-friendly heat seal films made from bio-based materials. Similarly, Berry Global Inc. has a strong focus on innovation and has developed several patented heat seal film technologies.

Stakeholders are focusing on expanding their product portfolios and developing innovative heat seal film solutions to meet the evolving needs of customers. They are focusing on sustainability and are investing in the development of eco-friendly heat seal film solutions to meet the growing demand for sustainable packaging solutions. Additionally, they are also focusing on expanding their global presence through strategic partnerships and acquisitions.

Recent Development
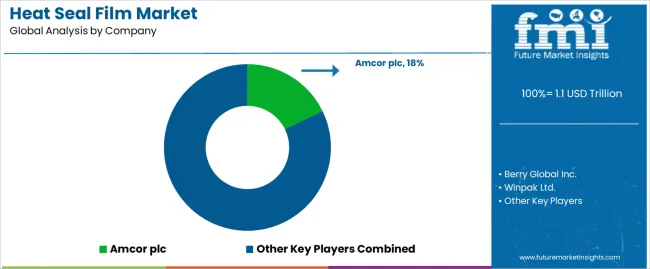
  • In 2021, Amcor plc, a packaging company, expanded its existing portfolio of adhesives for the healthcare industry with the launch of a new heat seal coating packaging solution. Known as ACT2100, the product offers improved sealing capacity and moisture resistance, which helps to prevent product deterioration. It is also versatile, allowing it to be used on a variety of substrates

Leading Suppliers of Heat Seal Films

  • Amcor plc
  • Berry Global Inc.
  • Winpak Ltd.
  • Sealed Air Corporation
  • Coveris Holdings S.A.
  • Mitsubishi Chemical Holdings Corporation
  • Huhtamaki Oyj
  • Constantia Flexibles Group GmbH
  • Toray Plastics (America) Inc.
  • Bemis Company Inc.

Key Shifting Preferences Covered in Heat Seal Film Market Report

  • Packaging Sealing Solutions Market Report
  • Heat Seal Metalized Film Market Analysis
  • Heat Seal Coating Market Sales Assessment
  • Flexible Packaging Films Market Overview
  • Sealing Films Pricing Outlook

Top Segments Studied in the Heat Seal Film Market Report

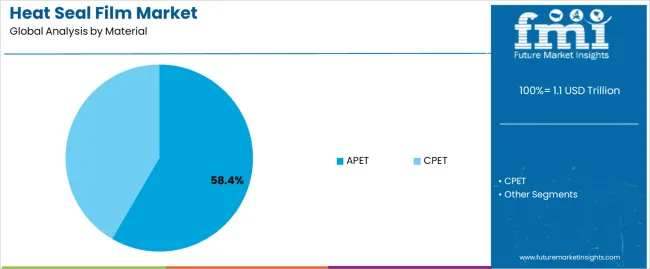
By Material:

  • APET
  • CPET

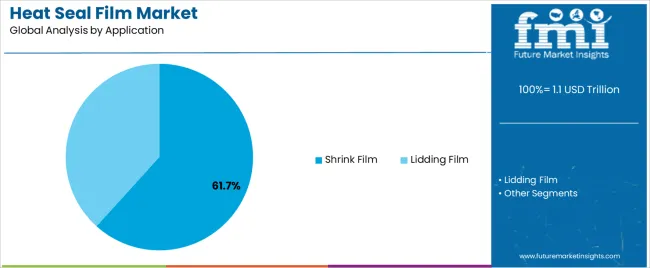
By Application:

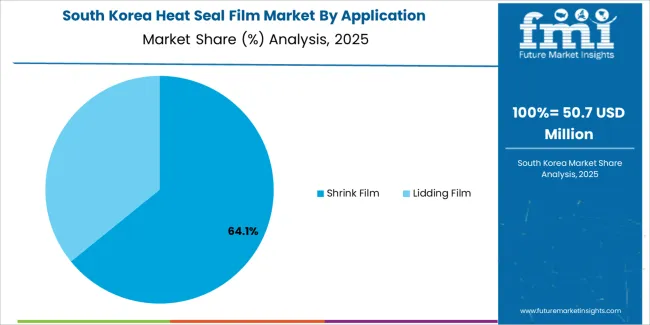
  • Shrink Film
  • Lidding Film

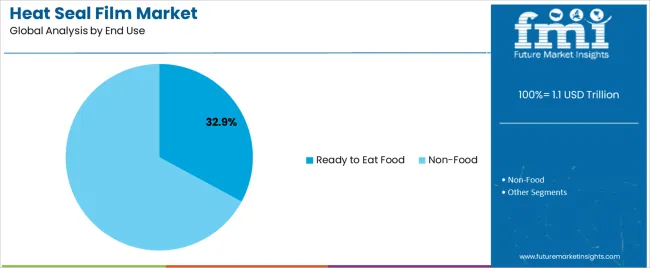
By End Use:

  • Ready to Eat Food
    • Fruits & Vegetables
    • Meat, Poultry & Seafood
    • Bakery & Confectionery
    • Other Food Products
  • Non-food

By Layer Structure:

  • Monolayer Films
  • Multilayer Films

By Region:

  • North America
  • Latin America
  • East Asia
  • South Asia
  • Europe
  • Oceania
  • MEA

Table of Content

  • 1. Executive Summary
  • 2. Market Overview
  • 3. Market Background
  • 4. Global Market Analysis 2019 to 2023 and Forecast, 2024 to 2034
  • 5. Global Market Analysis 2019 to 2023 and Forecast 2024 to 2034, By Material
    • 5.1. APET
    • 5.2. CPET
  • 6. Global Market Analysis 2019 to 2023 and Forecast 2024 to 2034, By Application
    • 6.1. Shrink Film
    • 6.2. Lidding Film
  • 7. Global Market Analysis 2019 to 2023 and Forecast 2024 to 2034, By End Use
    • 7.1. Food
      • 7.1.1. Ready to Eat Food
      • 7.1.2. Fruits & Vegetables
      • 7.1.3. Meat, Poultry & Seafood
      • 7.1.4. Bakery & Confectionery
      • 7.1.5. Other Food Products
    • 7.2. Non-food
  • 8. Global Market Analysis 2019 to 2023 and Forecast 2024 to 2034, By Region
    • 8.1. North America
    • 8.2. Latin America
    • 8.3. Western Europe
    • 8.4. Eastern Europe
    • 8.5. South Asia and Pacific
    • 8.6. East Asia
    • 8.7. Middle East and Africa
  • 9. North America Market Analysis 2019 to 2023 and Forecast 2024 to 2034, By Country
  • 10. Latin America Market Analysis 2019 to 2023 and Forecast 2024 to 2034, By Country
  • 11. Western Europe Market Analysis 2019 to 2023 and Forecast 2024 to 2034, By Country
  • 12. Eastern Europe Market Analysis 2019 to 2023 and Forecast 2024 to 2034, By Country
  • 13. South Asia and Pacific Market Analysis 2019 to 2023 and Forecast 2024 to 2034, By Country
  • 14. East Asia Market Analysis 2019 to 2023 and Forecast 2024 to 2034, By Country
  • 15. Middle East and Africa Market Analysis 2019 to 2023 and Forecast 2024 to 2034, By Country
  • 16. Key Countries Market Analysis
  • 17. Market Structure Analysis
  • 18. Competition Analysis
    • 18.1. DIC Corporation
    • 18.2. Borealis AG
    • 18.3. Toray Plastic Inc.
    • 18.4. Cosmo Films Inc.
    • 18.5. Plastic Supplier Inc.
    • 18.6. Polyplex Corporation Ltd.
    • 18.7. Ester Industries Ltd.
    • 18.8. Avery Dennison Corporation
    • 18.9. DuPont Teijin Films
    • 18.10. The 3M Company
  • 19. Assumptions & Acronyms Used
  • 20. Research Methodology

List of Tables

Table 1: Global Market Value (US$ Million) Forecast by Region, 2019 to 2034

Table 2: Global Market Volume (Tons) Forecast by Region, 2019 to 2034

Table 3: Global Market Value (US$ Million) Forecast by Material, 2019 to 2034

Table 4: Global Market Volume (Tons) Forecast by Material, 2019 to 2034

Table 5: Global Market Value (US$ Million) Forecast by Application, 2019 to 2034

Table 6: Global Market Volume (Tons) Forecast by Application, 2019 to 2034

Table 7: Global Market Value (US$ Million) Forecast by End Use, 2019 to 2034

Table 8: Global Market Volume (Tons) Forecast by End Use, 2019 to 2034

Table 9: North America Market Value (US$ Million) Forecast by Country, 2019 to 2034

Table 10: North America Market Volume (Tons) Forecast by Country, 2019 to 2034

Table 11: North America Market Value (US$ Million) Forecast by Material, 2019 to 2034

Table 12: North America Market Volume (Tons) Forecast by Material, 2019 to 2034

Table 13: North America Market Value (US$ Million) Forecast by Application, 2019 to 2034

Table 14: North America Market Volume (Tons) Forecast by Application, 2019 to 2034

Table 15: North America Market Value (US$ Million) Forecast by End Use, 2019 to 2034

Table 16: North America Market Volume (Tons) Forecast by End Use, 2019 to 2034

Table 17: Latin America Market Value (US$ Million) Forecast by Country, 2019 to 2034

Table 18: Latin America Market Volume (Tons) Forecast by Country, 2019 to 2034

Table 19: Latin America Market Value (US$ Million) Forecast by Material, 2019 to 2034

Table 20: Latin America Market Volume (Tons) Forecast by Material, 2019 to 2034

Table 21: Latin America Market Value (US$ Million) Forecast by Application, 2019 to 2034

Table 22: Latin America Market Volume (Tons) Forecast by Application, 2019 to 2034

Table 23: Latin America Market Value (US$ Million) Forecast by End Use, 2019 to 2034

Table 24: Latin America Market Volume (Tons) Forecast by End Use, 2019 to 2034

Table 25: Western Europe Market Value (US$ Million) Forecast by Country, 2019 to 2034

Table 26: Western Europe Market Volume (Tons) Forecast by Country, 2019 to 2034

Table 27: Western Europe Market Value (US$ Million) Forecast by Material, 2019 to 2034

Table 28: Western Europe Market Volume (Tons) Forecast by Material, 2019 to 2034

Table 29: Western Europe Market Value (US$ Million) Forecast by Application, 2019 to 2034

Table 30: Western Europe Market Volume (Tons) Forecast by Application, 2019 to 2034

Table 31: Western Europe Market Value (US$ Million) Forecast by End Use, 2019 to 2034

Table 32: Western Europe Market Volume (Tons) Forecast by End Use, 2019 to 2034

Table 33: Eastern Europe Market Value (US$ Million) Forecast by Country, 2019 to 2034

Table 34: Eastern Europe Market Volume (Tons) Forecast by Country, 2019 to 2034

Table 35: Eastern Europe Market Value (US$ Million) Forecast by Material, 2019 to 2034

Table 36: Eastern Europe Market Volume (Tons) Forecast by Material, 2019 to 2034

Table 37: Eastern Europe Market Value (US$ Million) Forecast by Application, 2019 to 2034

Table 38: Eastern Europe Market Volume (Tons) Forecast by Application, 2019 to 2034

Table 39: Eastern Europe Market Value (US$ Million) Forecast by End Use, 2019 to 2034

Table 40: Eastern Europe Market Volume (Tons) Forecast by End Use, 2019 to 2034

Table 41: South Asia and Pacific Market Value (US$ Million) Forecast by Country, 2019 to 2034

Table 42: South Asia and Pacific Market Volume (Tons) Forecast by Country, 2019 to 2034

Table 43: South Asia and Pacific Market Value (US$ Million) Forecast by Material, 2019 to 2034

Table 44: South Asia and Pacific Market Volume (Tons) Forecast by Material, 2019 to 2034

Table 45: South Asia and Pacific Market Value (US$ Million) Forecast by Application, 2019 to 2034

Table 46: South Asia and Pacific Market Volume (Tons) Forecast by Application, 2019 to 2034

Table 47: South Asia and Pacific Market Value (US$ Million) Forecast by End Use, 2019 to 2034

Table 48: South Asia and Pacific Market Volume (Tons) Forecast by End Use, 2019 to 2034

Table 49: East Asia Market Value (US$ Million) Forecast by Country, 2019 to 2034

Table 50: East Asia Market Volume (Tons) Forecast by Country, 2019 to 2034

Table 51: East Asia Market Value (US$ Million) Forecast by Material, 2019 to 2034

Table 52: East Asia Market Volume (Tons) Forecast by Material, 2019 to 2034

Table 53: East Asia Market Value (US$ Million) Forecast by Application, 2019 to 2034

Table 54: East Asia Market Volume (Tons) Forecast by Application, 2019 to 2034

Table 55: East Asia Market Value (US$ Million) Forecast by End Use, 2019 to 2034

Table 56: East Asia Market Volume (Tons) Forecast by End Use, 2019 to 2034

Table 57: Middle East and Africa Market Value (US$ Million) Forecast by Country, 2019 to 2034

Table 58: Middle East and Africa Market Volume (Tons) Forecast by Country, 2019 to 2034

Table 59: Middle East and Africa Market Value (US$ Million) Forecast by Material, 2019 to 2034

Table 60: Middle East and Africa Market Volume (Tons) Forecast by Material, 2019 to 2034

Table 61: Middle East and Africa Market Value (US$ Million) Forecast by Application, 2019 to 2034

Table 62: Middle East and Africa Market Volume (Tons) Forecast by Application, 2019 to 2034

Table 63: Middle East and Africa Market Value (US$ Million) Forecast by End Use, 2019 to 2034

Table 64: Middle East and Africa Market Volume (Tons) Forecast by End Use, 2019 to 2034

List of Figures

Figure 1: Global Market Value (US$ Million) by Material, 2024 to 2034

Figure 2: Global Market Value (US$ Million) by Application, 2024 to 2034

Figure 3: Global Market Value (US$ Million) by End Use, 2024 to 2034

Figure 4: Global Market Value (US$ Million) by Region, 2024 to 2034

Figure 5: Global Market Value (US$ Million) Analysis by Region, 2019 to 2034

Figure 6: Global Market Volume (Tons) Analysis by Region, 2019 to 2034

Figure 7: Global Market Value Share (%) and BPS Analysis by Region, 2024 to 2034

Figure 8: Global Market Y-o-Y Growth (%) Projections by Region, 2024 to 2034

Figure 9: Global Market Value (US$ Million) Analysis by Material, 2019 to 2034

Figure 10: Global Market Volume (Tons) Analysis by Material, 2019 to 2034

Figure 11: Global Market Value Share (%) and BPS Analysis by Material, 2024 to 2034

Figure 12: Global Market Y-o-Y Growth (%) Projections by Material, 2024 to 2034

Figure 13: Global Market Value (US$ Million) Analysis by Application, 2019 to 2034

Figure 14: Global Market Volume (Tons) Analysis by Application, 2019 to 2034

Figure 15: Global Market Value Share (%) and BPS Analysis by Application, 2024 to 2034

Figure 16: Global Market Y-o-Y Growth (%) Projections by Application, 2024 to 2034

Figure 17: Global Market Value (US$ Million) Analysis by End Use, 2019 to 2034

Figure 18: Global Market Volume (Tons) Analysis by End Use, 2019 to 2034

Figure 19: Global Market Value Share (%) and BPS Analysis by End Use, 2024 to 2034

Figure 20: Global Market Y-o-Y Growth (%) Projections by End Use, 2024 to 2034

Figure 21: Global Market Attractiveness by Material, 2024 to 2034

Figure 22: Global Market Attractiveness by Application, 2024 to 2034

Figure 23: Global Market Attractiveness by End Use, 2024 to 2034

Figure 24: Global Market Attractiveness by Region, 2024 to 2034

Figure 25: North America Market Value (US$ Million) by Material, 2024 to 2034

Figure 26: North America Market Value (US$ Million) by Application, 2024 to 2034

Figure 27: North America Market Value (US$ Million) by End Use, 2024 to 2034

Figure 28: North America Market Value (US$ Million) by Country, 2024 to 2034

Figure 29: North America Market Value (US$ Million) Analysis by Country, 2019 to 2034

Figure 30: North America Market Volume (Tons) Analysis by Country, 2019 to 2034

Figure 31: North America Market Value Share (%) and BPS Analysis by Country, 2024 to 2034

Figure 32: North America Market Y-o-Y Growth (%) Projections by Country, 2024 to 2034

Figure 33: North America Market Value (US$ Million) Analysis by Material, 2019 to 2034

Figure 34: North America Market Volume (Tons) Analysis by Material, 2019 to 2034

Figure 35: North America Market Value Share (%) and BPS Analysis by Material, 2024 to 2034

Figure 36: North America Market Y-o-Y Growth (%) Projections by Material, 2024 to 2034

Figure 37: North America Market Value (US$ Million) Analysis by Application, 2019 to 2034

Figure 38: North America Market Volume (Tons) Analysis by Application, 2019 to 2034

Figure 39: North America Market Value Share (%) and BPS Analysis by Application, 2024 to 2034

Figure 40: North America Market Y-o-Y Growth (%) Projections by Application, 2024 to 2034

Figure 41: North America Market Value (US$ Million) Analysis by End Use, 2019 to 2034

Figure 42: North America Market Volume (Tons) Analysis by End Use, 2019 to 2034

Figure 43: North America Market Value Share (%) and BPS Analysis by End Use, 2024 to 2034

Figure 44: North America Market Y-o-Y Growth (%) Projections by End Use, 2024 to 2034

Figure 45: North America Market Attractiveness by Material, 2024 to 2034

Figure 46: North America Market Attractiveness by Application, 2024 to 2034

Figure 47: North America Market Attractiveness by End Use, 2024 to 2034

Figure 48: North America Market Attractiveness by Country, 2024 to 2034

Figure 49: Latin America Market Value (US$ Million) by Material, 2024 to 2034

Figure 50: Latin America Market Value (US$ Million) by Application, 2024 to 2034

Figure 51: Latin America Market Value (US$ Million) by End Use, 2024 to 2034

Figure 52: Latin America Market Value (US$ Million) by Country, 2024 to 2034

Figure 53: Latin America Market Value (US$ Million) Analysis by Country, 2019 to 2034

Figure 54: Latin America Market Volume (Tons) Analysis by Country, 2019 to 2034

Figure 55: Latin America Market Value Share (%) and BPS Analysis by Country, 2024 to 2034

Figure 56: Latin America Market Y-o-Y Growth (%) Projections by Country, 2024 to 2034

Figure 57: Latin America Market Value (US$ Million) Analysis by Material, 2019 to 2034

Figure 58: Latin America Market Volume (Tons) Analysis by Material, 2019 to 2034

Figure 59: Latin America Market Value Share (%) and BPS Analysis by Material, 2024 to 2034

Figure 60: Latin America Market Y-o-Y Growth (%) Projections by Material, 2024 to 2034

Figure 61: Latin America Market Value (US$ Million) Analysis by Application, 2019 to 2034

Figure 62: Latin America Market Volume (Tons) Analysis by Application, 2019 to 2034

Figure 63: Latin America Market Value Share (%) and BPS Analysis by Application, 2024 to 2034

Figure 64: Latin America Market Y-o-Y Growth (%) Projections by Application, 2024 to 2034

Figure 65: Latin America Market Value (US$ Million) Analysis by End Use, 2019 to 2034

Figure 66: Latin America Market Volume (Tons) Analysis by End Use, 2019 to 2034

Figure 67: Latin America Market Value Share (%) and BPS Analysis by End Use, 2024 to 2034

Figure 68: Latin America Market Y-o-Y Growth (%) Projections by End Use, 2024 to 2034

Figure 69: Latin America Market Attractiveness by Material, 2024 to 2034

Figure 70: Latin America Market Attractiveness by Application, 2024 to 2034

Figure 71: Latin America Market Attractiveness by End Use, 2024 to 2034

Figure 72: Latin America Market Attractiveness by Country, 2024 to 2034

Figure 73: Western Europe Market Value (US$ Million) by Material, 2024 to 2034

Figure 74: Western Europe Market Value (US$ Million) by Application, 2024 to 2034

Figure 75: Western Europe Market Value (US$ Million) by End Use, 2024 to 2034

Figure 76: Western Europe Market Value (US$ Million) by Country, 2024 to 2034

Figure 77: Western Europe Market Value (US$ Million) Analysis by Country, 2019 to 2034

Figure 78: Western Europe Market Volume (Tons) Analysis by Country, 2019 to 2034

Figure 79: Western Europe Market Value Share (%) and BPS Analysis by Country, 2024 to 2034

Figure 80: Western Europe Market Y-o-Y Growth (%) Projections by Country, 2024 to 2034

Figure 81: Western Europe Market Value (US$ Million) Analysis by Material, 2019 to 2034

Figure 82: Western Europe Market Volume (Tons) Analysis by Material, 2019 to 2034

Figure 83: Western Europe Market Value Share (%) and BPS Analysis by Material, 2024 to 2034

Figure 84: Western Europe Market Y-o-Y Growth (%) Projections by Material, 2024 to 2034

Figure 85: Western Europe Market Value (US$ Million) Analysis by Application, 2019 to 2034

Figure 86: Western Europe Market Volume (Tons) Analysis by Application, 2019 to 2034

Figure 87: Western Europe Market Value Share (%) and BPS Analysis by Application, 2024 to 2034

Figure 88: Western Europe Market Y-o-Y Growth (%) Projections by Application, 2024 to 2034

Figure 89: Western Europe Market Value (US$ Million) Analysis by End Use, 2019 to 2034

Figure 90: Western Europe Market Volume (Tons) Analysis by End Use, 2019 to 2034

Figure 91: Western Europe Market Value Share (%) and BPS Analysis by End Use, 2024 to 2034

Figure 92: Western Europe Market Y-o-Y Growth (%) Projections by End Use, 2024 to 2034

Figure 93: Western Europe Market Attractiveness by Material, 2024 to 2034

Figure 94: Western Europe Market Attractiveness by Application, 2024 to 2034

Figure 95: Western Europe Market Attractiveness by End Use, 2024 to 2034

Figure 96: Western Europe Market Attractiveness by Country, 2024 to 2034

Figure 97: Eastern Europe Market Value (US$ Million) by Material, 2024 to 2034

Figure 98: Eastern Europe Market Value (US$ Million) by Application, 2024 to 2034

Figure 99: Eastern Europe Market Value (US$ Million) by End Use, 2024 to 2034

Figure 100: Eastern Europe Market Value (US$ Million) by Country, 2024 to 2034

Figure 101: Eastern Europe Market Value (US$ Million) Analysis by Country, 2019 to 2034

Figure 102: Eastern Europe Market Volume (Tons) Analysis by Country, 2019 to 2034

Figure 103: Eastern Europe Market Value Share (%) and BPS Analysis by Country, 2024 to 2034

Figure 104: Eastern Europe Market Y-o-Y Growth (%) Projections by Country, 2024 to 2034

Figure 105: Eastern Europe Market Value (US$ Million) Analysis by Material, 2019 to 2034

Figure 106: Eastern Europe Market Volume (Tons) Analysis by Material, 2019 to 2034

Figure 107: Eastern Europe Market Value Share (%) and BPS Analysis by Material, 2024 to 2034

Figure 108: Eastern Europe Market Y-o-Y Growth (%) Projections by Material, 2024 to 2034

Figure 109: Eastern Europe Market Value (US$ Million) Analysis by Application, 2019 to 2034

Figure 110: Eastern Europe Market Volume (Tons) Analysis by Application, 2019 to 2034

Figure 111: Eastern Europe Market Value Share (%) and BPS Analysis by Application, 2024 to 2034

Figure 112: Eastern Europe Market Y-o-Y Growth (%) Projections by Application, 2024 to 2034

Figure 113: Eastern Europe Market Value (US$ Million) Analysis by End Use, 2019 to 2034

Figure 114: Eastern Europe Market Volume (Tons) Analysis by End Use, 2019 to 2034

Figure 115: Eastern Europe Market Value Share (%) and BPS Analysis by End Use, 2024 to 2034

Figure 116: Eastern Europe Market Y-o-Y Growth (%) Projections by End Use, 2024 to 2034

Figure 117: Eastern Europe Market Attractiveness by Material, 2024 to 2034

Figure 118: Eastern Europe Market Attractiveness by Application, 2024 to 2034

Figure 119: Eastern Europe Market Attractiveness by End Use, 2024 to 2034

Figure 120: Eastern Europe Market Attractiveness by Country, 2024 to 2034

Figure 121: South Asia and Pacific Market Value (US$ Million) by Material, 2024 to 2034

Figure 122: South Asia and Pacific Market Value (US$ Million) by Application, 2024 to 2034

Figure 123: South Asia and Pacific Market Value (US$ Million) by End Use, 2024 to 2034

Figure 124: South Asia and Pacific Market Value (US$ Million) by Country, 2024 to 2034

Figure 125: South Asia and Pacific Market Value (US$ Million) Analysis by Country, 2019 to 2034

Figure 126: South Asia and Pacific Market Volume (Tons) Analysis by Country, 2019 to 2034

Figure 127: South Asia and Pacific Market Value Share (%) and BPS Analysis by Country, 2024 to 2034

Figure 128: South Asia and Pacific Market Y-o-Y Growth (%) Projections by Country, 2024 to 2034

Figure 129: South Asia and Pacific Market Value (US$ Million) Analysis by Material, 2019 to 2034

Figure 130: South Asia and Pacific Market Volume (Tons) Analysis by Material, 2019 to 2034

Figure 131: South Asia and Pacific Market Value Share (%) and BPS Analysis by Material, 2024 to 2034

Figure 132: South Asia and Pacific Market Y-o-Y Growth (%) Projections by Material, 2024 to 2034

Figure 133: South Asia and Pacific Market Value (US$ Million) Analysis by Application, 2019 to 2034

Figure 134: South Asia and Pacific Market Volume (Tons) Analysis by Application, 2019 to 2034

Figure 135: South Asia and Pacific Market Value Share (%) and BPS Analysis by Application, 2024 to 2034

Figure 136: South Asia and Pacific Market Y-o-Y Growth (%) Projections by Application, 2024 to 2034

Figure 137: South Asia and Pacific Market Value (US$ Million) Analysis by End Use, 2019 to 2034

Figure 138: South Asia and Pacific Market Volume (Tons) Analysis by End Use, 2019 to 2034

Figure 139: South Asia and Pacific Market Value Share (%) and BPS Analysis by End Use, 2024 to 2034

Figure 140: South Asia and Pacific Market Y-o-Y Growth (%) Projections by End Use, 2024 to 2034

Figure 141: South Asia and Pacific Market Attractiveness by Material, 2024 to 2034

Figure 142: South Asia and Pacific Market Attractiveness by Application, 2024 to 2034

Figure 143: South Asia and Pacific Market Attractiveness by End Use, 2024 to 2034

Figure 144: South Asia and Pacific Market Attractiveness by Country, 2024 to 2034

Figure 145: East Asia Market Value (US$ Million) by Material, 2024 to 2034

Figure 146: East Asia Market Value (US$ Million) by Application, 2024 to 2034

Figure 147: East Asia Market Value (US$ Million) by End Use, 2024 to 2034

Figure 148: East Asia Market Value (US$ Million) by Country, 2024 to 2034

Figure 149: East Asia Market Value (US$ Million) Analysis by Country, 2019 to 2034

Figure 150: East Asia Market Volume (Tons) Analysis by Country, 2019 to 2034

Figure 151: East Asia Market Value Share (%) and BPS Analysis by Country, 2024 to 2034

Figure 152: East Asia Market Y-o-Y Growth (%) Projections by Country, 2024 to 2034

Figure 153: East Asia Market Value (US$ Million) Analysis by Material, 2019 to 2034

Figure 154: East Asia Market Volume (Tons) Analysis by Material, 2019 to 2034

Figure 155: East Asia Market Value Share (%) and BPS Analysis by Material, 2024 to 2034

Figure 156: East Asia Market Y-o-Y Growth (%) Projections by Material, 2024 to 2034

Figure 157: East Asia Market Value (US$ Million) Analysis by Application, 2019 to 2034

Figure 158: East Asia Market Volume (Tons) Analysis by Application, 2019 to 2034

Figure 159: East Asia Market Value Share (%) and BPS Analysis by Application, 2024 to 2034

Figure 160: East Asia Market Y-o-Y Growth (%) Projections by Application, 2024 to 2034

Figure 161: East Asia Market Value (US$ Million) Analysis by End Use, 2019 to 2034

Figure 162: East Asia Market Volume (Tons) Analysis by End Use, 2019 to 2034

Figure 163: East Asia Market Value Share (%) and BPS Analysis by End Use, 2024 to 2034

Figure 164: East Asia Market Y-o-Y Growth (%) Projections by End Use, 2024 to 2034

Figure 165: East Asia Market Attractiveness by Material, 2024 to 2034

Figure 166: East Asia Market Attractiveness by Application, 2024 to 2034

Figure 167: East Asia Market Attractiveness by End Use, 2024 to 2034

Figure 168: East Asia Market Attractiveness by Country, 2024 to 2034

Figure 169: Middle East and Africa Market Value (US$ Million) by Material, 2024 to 2034

Figure 170: Middle East and Africa Market Value (US$ Million) by Application, 2024 to 2034

Figure 171: Middle East and Africa Market Value (US$ Million) by End Use, 2024 to 2034

Figure 172: Middle East and Africa Market Value (US$ Million) by Country, 2024 to 2034

Figure 173: Middle East and Africa Market Value (US$ Million) Analysis by Country, 2019 to 2034

Figure 174: Middle East and Africa Market Volume (Tons) Analysis by Country, 2019 to 2034

Figure 175: Middle East and Africa Market Value Share (%) and BPS Analysis by Country, 2024 to 2034

Figure 176: Middle East and Africa Market Y-o-Y Growth (%) Projections by Country, 2024 to 2034

Figure 177: Middle East and Africa Market Value (US$ Million) Analysis by Material, 2019 to 2034

Figure 178: Middle East and Africa Market Volume (Tons) Analysis by Material, 2019 to 2034

Figure 179: Middle East and Africa Market Value Share (%) and BPS Analysis by Material, 2024 to 2034

Figure 180: Middle East and Africa Market Y-o-Y Growth (%) Projections by Material, 2024 to 2034

Figure 181: Middle East and Africa Market Value (US$ Million) Analysis by Application, 2019 to 2034

Figure 182: Middle East and Africa Market Volume (Tons) Analysis by Application, 2019 to 2034

Figure 183: Middle East and Africa Market Value Share (%) and BPS Analysis by Application, 2024 to 2034

Figure 184: Middle East and Africa Market Y-o-Y Growth (%) Projections by Application, 2024 to 2034

Figure 185: Middle East and Africa Market Value (US$ Million) Analysis by End Use, 2019 to 2034

Figure 186: Middle East and Africa Market Volume (Tons) Analysis by End Use, 2019 to 2034

Figure 187: Middle East and Africa Market Value Share (%) and BPS Analysis by End Use, 2024 to 2034

Figure 188: Middle East and Africa Market Y-o-Y Growth (%) Projections by End Use, 2024 to 2034

Figure 189: Middle East and Africa Market Attractiveness by Material, 2024 to 2034

Figure 190: Middle East and Africa Market Attractiveness by Application, 2024 to 2034

Figure 191: Middle East and Africa Market Attractiveness by End Use, 2024 to 2034

Figure 192: Middle East and Africa Market Attractiveness by Country, 2024 to 2034

Frequently Asked Questions

How Big is the Heat Seal Film Market in 2024?

The heat seal film market is expected to be valued at USD 1,078.2 million in 2024.

What is China’s Market Outlook?

The market in China is expected to progress at a CAGR of 4.4 % over the forecast period.

Which Card Type Segment Contributes More to the Heat Seal Film Market?

Within the layer structure, the monolayer film segment is expected to hold a 69.4% market share in 2024.

What is the Spain’s Market Outlook?

The market in Spain is expected to rise at a 2.3% CAGR from 2024 to 2034.

What is the Global Market Projected Value for 2034?

The market is set to reach a valuation of USD 1,380.2 million by 2034.

What Was the Historical CAGR for the Market?

The demand for heat seal films increased at a 1.5% CAGR from 2019 to 2023.

Explore Plastic Packaging Insights

Future Market Insights

Heat Seal Film Market