Heat Release Tester Market Size, Share, and Forecast Outlook 2025 to 2035

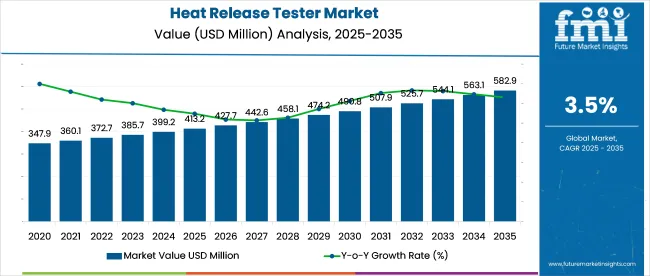
The heat release tester market is projected to rise from USD 413.2 million in 2025 to approximately USD 582.8 million by 2035, registering a CAGR of 3.5% during the forecast period. The market is becoming highly dynamic as industries ranging from building materials to automotive align thermal safety with regulatory mandates and performance benchmarks.
Quick Stats in Heat Release Tester Market

  • Market Size (2025): USD 413.2 million
  • Market Forecast (2035): USD 582.8 million
  • CAGR (2025-2035): 3.5%
  • Top Product Type: Cone Calorimeter (48% share in 2025)
  • Leading End Use: Certification & Research Labs (18% share in 2025)
  • Top Growing Country: South Korea (4.5% CAGR)

Heat Release Tester Market Market Value Analysis

Leading equipment makers are sourcing advanced sensors and fast-response calorimeters from specialized Tier‑2 component suppliers to support real-time heat flux analysis in fire tests for aerospace composites and construction panels.

Calibration labs are responding by offering traceable ISO‑17025 services that validate new equipment within 48 hours, reducing downtime for R&D teams. Across Asia and Europe, OEMs are pairing shipment contracts with on-site training and maintenance packages, signaling a shift toward service‑based models. Raw material labs are optimizing sample preparation workflows using robotic cutting and moisture control systems that ensure consistent data across global testing sites.

As of 2025, the heat release tester market is regarded as a focused yet essential niche within broader safety and testing industries. Within the global fire testing equipment market, these testers represent approximately 6-8% of total value, as they are key to assessing material flammability. In the test and measurement instruments market, their share is about 2-3%, reflecting their specialized application.

In the building materials testing sector, they contribute roughly 4-5%, driven by regulatory demands for fire-safe construction components. Within the safety and compliance equipment market, a 3-4% share is held by heat release testers, due to increasing emphasis on certification and risk management. In the product certification services market, they account for 2-3%, supporting lab-based compliance across diverse industries.

Analyzing Heat Release Tester Market by Top Investment Segments

The market is advancing steadily across critical sectors, fueled by regulatory emphasis on fire safety, increasing product testing volumes, and the growing presence of third-party labs. Among the leading segments, cone calorimeters and certification & research labs show high investor potential due to their relevance in modern flame retardancy assessment.
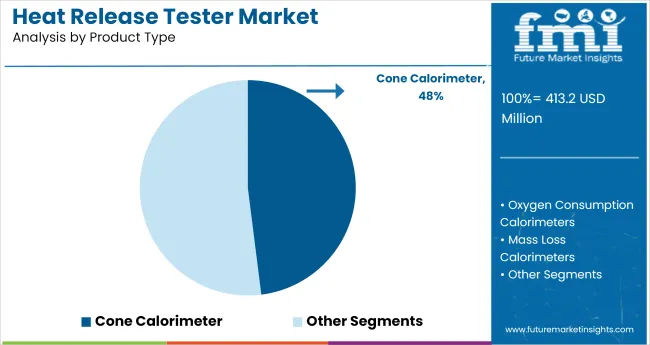
Cone Calorimeter Leads Product Type with 48% Market Share

Heat Release Tester Market Analysis By Product Type

Cone calorimeters are projected to account for 48% of the heat release tester market by 2025, making them the dominant product type. They offer precise measurements of heat release rates, smoke production, and ignition time under controlled conditions, essential for evaluating flammability performance in building materials, plastics, and textiles.
  • High adoption is driven by compliance needs with ASTM E1354 and ISO 5660 standards.
  • R&D labs rely on cone calorimeters to validate material safety for construction and transport.
  • Compact benchtop models have seen increased uptake across emerging economies due to affordability.

Certification and Research Labs Capture 18% Share in End Use

Heat Release Tester Market Analysis By End Use

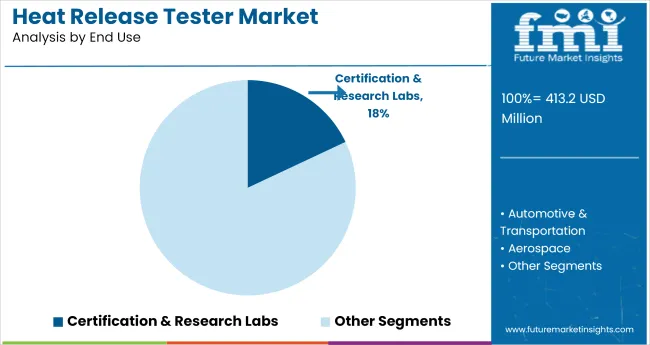
Certification and research labs are set to secure an 18% share of the global market by 2025. Their role in verifying material safety, issuing fire compliance reports, and assisting manufacturers with product approvals positions them as core consumers of heat release testers. Investment in this segment is supported by heightened testing demand across industries.

  • National testing agencies are scaling infrastructure to meet rising compliance workloads.
  • Academic and industrial labs are acquiring advanced testers to conduct full-scale flame spread studies.
  • International standards harmonization has boosted lab testing volumes across Europe and Asia.

Top Heat Release Tester Market Dynamics

Demand for heat release testers is rising with stricter flammability regulations in aerospace, automotive, and construction sectors. In 2024, global installations grew by 7.2%, driven by increased emphasis on fire safety certification. Testing standards such as ISO 5660 and FAA FAR 25.853 are accelerating equipment upgrades worldwide.

Advanced Instrumentation Driving Repeat Purchases and Retrofitting

Modern testers now include oxygen consumption calorimetry and integrated data loggers. In 2024, nearly 46% of new units featured real-time HRR visualization with software-based thermal profiling. Labs are replacing legacy units to align with automated reporting and international audit requirements.

  • Integrated calorimetry systems adopted for multi-parameter testing accuracy.
  • Retrofitting driven by push for digital documentation and lab automation.
  • Demand rising for software-connected systems with cloud-enabled data exports.

Asia-Pacific Leading Growth Amid Industrial Expansion

China, Japan, and South Korea are investing heavily in material safety testing infrastructure. In 2024, APAC accounted for 31% of global heat release tester sales, up from 24% in 2020. Government-funded fire safety labs and private certification agencies are boosting demand.
  • Government labs expanding equipment fleets for civil infrastructure testing.
  • Used in polymer, electronics, and insulation testing across APAC facilities.
  • Export-focused manufacturers adopting testers to meet EU and US fire codes.

Top Countries Developing, Calibrating, Deploying, and Exporting Heat Release Testers

Heat Release Tester Market Cagr Analysis By Country

The report provides insights across 40+ countries. The five below are highlighted for their strategic influence and growth trajectory.

Countries CAGR (2025-2035)
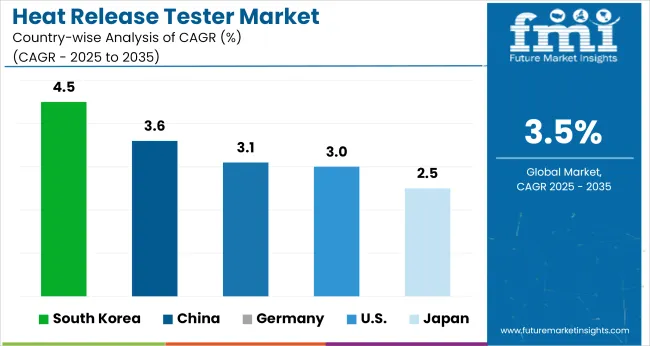
South Korea 4.5%
China 3.6%
Germany 3.1%
United States 3.0%
Japan 2.5%

The global heat release tester market is expected to expand at a CAGR of 3.5% between 2025 and 2035. South Korea leads the group with a 4.5% CAGR, which is 29% higher than the global baseline. China also edges past the average with 3.6% growth, while Germany at 3.1% and the United States at 3.0% trail the global rate by 11% and 14%, respectively. Japan records the slowest pace at 2.5%, falling 29% short of the global average.

These country-level variations reflect differences in fire safety compliance, test lab modernization, and adoption of updated flammability standards. South Korea is seeing faster growth due to greater emphasis on building code revisions and investments in fire-resistant materials testing. OECD economies such as Japan, the USA, and Germany are experiencing slower turnover in safety infrastructure and stricter procurement cycles, which are limiting gains in the heat release tester segment.

Advancements in Heat Release Tester Technology in South Korea

South Korea is growing at a CAGR of 4.5% between 2025 and 2035, supported by stringent fire safety protocols in electronics and construction. The country’s strong electronics and automotive sectors are actively integrating advanced fire testing protocols during component development. The government has introduced updated fire codes that make heat release measurements mandatory for certain materials used in interiors. Growing R&D in universities and state labs has resulted in wider deployment of modern calorimetry devices. These trends are strengthening the demand for precise heat release testers across industries.

  • Expanded fire testing regulations in consumer electronics production
  • Surge in demand from smart building and construction sectors
  • Domestic manufacturers investing in high-precision testing labs

Demand Drivers for Heat Release Tester Equipment in China

China’s market for heat release testers is expected to register a CAGR of 3.6% from 2025 to 2035, as national fire codes are revised to include stricter compliance requirements. Rapid infrastructure development and booming high-rise construction have increased the need for flammability testing of building materials. The aviation and railway sectors are also using these devices to validate fire-resistant composites. Chinese equipment manufacturers are entering the segment with cost-effective solutions, supporting accessibility for mid-sized laboratories. This trend is reshaping local procurement strategies.

  • National fire code updates enforcing stricter material validation
  • Increased usage in aviation and public transit development
  • Rise of domestic equipment suppliers expanding market access

Trends Influencing the Heat Release Tester Market in Germany

Germany is projected to expand at a CAGR of 3.1% through 2035, driven by high industrial safety benchmarks across sectors such as aerospace, construction, and electricals. The country’s emphasis on precision testing and certification is reinforcing the role of heat release testers in research labs and production lines. Strict adherence to EU fire standards and material classification systems has necessitated wider use of calibrated calorimetry instruments. German laboratories also demand long-life, modular systems that comply with ISO 5660 and DIN standards.
  • EU regulations fueling adoption in construction material testing
  • Growth in aerospace and automotive testing capabilities
  • Manufacturers focusing on modular and standardized test systems

Outlook for Heat Release Tester Deployment in the United States

Heat Release Tester Market Country Value Analysis

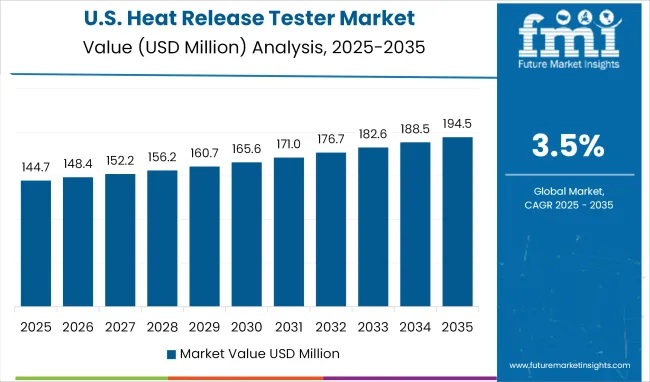
The United States is anticipated to experience a CAGR of 3.0% in the heat release tester market from 2025 to 2035. Growing concern over fire hazards in public buildings and aircraft interiors is increasing demand for performance-based fire testing. Regulatory bodies such as NFPA and FAA have mandated specific heat release rate limits for critical applications, especially in mass transit and defense. Universities, third-party labs, and OEMs are enhancing capabilities with cone calorimeters and smoke density testers that meet ASTM standards.

  • Tightened FAA norms driving investments in aerospace fire testing
  • Public safety mandates spurring retrofitting of commercial facilities
  • Rising need for third-party validation encouraging lab service expansion

Industrial Safety Regulations Boosting Japan’s Market

Japan’s market is expected to expand at a CAGR of 2.5% between 2025 and 2035. National regulations require standardized flammability testing for a range of construction, automotive, and appliance materials. The country is investing in modernizing laboratory infrastructure, especially in fire research institutes and academic centers. Advanced testing equipment that offers dual-mode analysis and compliance with JIS and ISO fire test standards is gaining ground. Despite the mature market, evolving technology and focus on disaster resilience are supporting steady growth.
  • Increased public spending on fire safety research facilities
  • Focus on JIS-compliant testers in building certification processes
  • Demand for multifunctional instruments supporting multi-sample testing

Leading Heat Release Tester Manufacturer

Heat Release Tester Market Analysis By Company

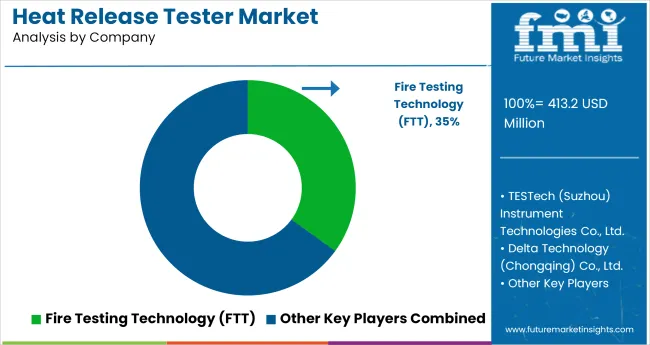
Fire Testing Technology (FTT), based in the UK, dominates the premium segment with an estimated 35% global market share, supplying advanced cone calorimeters compliant with ISO 5660 and ASTM E1354 standards. TESTech (Suzhou) follows with strong traction in Asia-Pacific, particularly in China and South Korea, due to its cost-effective lab-scale models, holding approximately 20% share. Delta Technology (Chongqing) Co. Ltd. has grown rapidly by integrating digital control systems and exporting to mid-tier European labs. Dongguan Daxian and Motis Fire Technology focus primarily on the domestic Chinese education and R&D sectors, supplying over 400 units annually. Emerging Indian players like Asian Test Equipments are gaining traction in South Asia, targeting material certification labs with budget-friendly systems.

Recent Heat Release Tester Industry News

In January 2025, Fire Testing Technology (FTT) launched a new U.S. subsidiary and designated Earth Products China as its exclusive agent for mainland China, Hong Kong, and Macau. These strategic moves enhance FTT’s global footprint, improving customer support and distribution for its advanced heat-release and smoke-density testers.

Report Coverage and Scope Summary

Report Attributes Details
Market Size (2025) USD 413.2 million
Projected Market Size (2035) USD 582.8 million
CAGR (2025 to 2035) 3.5%
Base Year for Estimation 2024
Historical Period 2020 to 2024
Projections Period 2025 to 2035
Quantitative Units USD million for market value
Product Types Analyzed (Segment 1) Cone Calorimeters, Oxygen Consumption Calorimeters, Mass Loss Calorimeters, Other Specialized Types
End Uses Analyzed (Segment 2) Automotive & Transportation, Aerospace, Certification & Research Laboratories, Process Industries, Mining & Metallurgy, Other Industrial Sectors
Regions Covered North America, Latin America, Eastern Europe, Western Europe, South Asia & Pacific, East Asia, Middle East & Africa
Countries Covered United States, Canada, Germany, United Kingdom, France, Italy, Spain, China, India, Japan, South Korea, Australia, Brazil, Mexico, Argentina, Saudi Arabia, UAE, South Africa
Key Players TESTech (Suzhou) Instrument Technologies Co., Ltd., Dongguan Skyline Industrial Co., Ltd., Asian Test Equipments , Delta Technology (Chongqing) Co., Ltd., Fire Testing Technology (FTT), Dongguan Daxian Instrument Equipment Co., Ltd., Motis Fire Technology (China) Co., Ltd.
Additional Attributes Dollar sales by product and end use, increasing demand for fire performance testing in transport and construction, evolving international safety standards, and rising investment in lab-based combustion analytics.

Leading Players in Heat Release Tester Market

  • TESTech (Suzhou) Instrument Technologies Co., Ltd.
  • Dongguan Skyline Industrial Co., Ltd.
  • Asian Test Equipments
  • Delta Technology (Chongqing) Co., Ltd.
  • Fire Testing Technology (FTT)
  • Dongguan Daxian Instrument Equipment Co., Ltd.
  • Motis Fire Technology (China) Co., Ltd.

Heat Release Tester Market Analyzed by Key Investment Segments

By Product Type:

The market is segmented into cone calorimeters, oxygen consumption calorimeters, mass loss calorimeters, and other specialized types used for fire behavior analysis across materials and systems.

By End Use:

End-use segments include automotive and transportation, aerospace, certification and research laboratories, process industries, mining and metallurgy, and other industrial sectors requiring fire performance testing.

By Region:

Regional analysis covers North America, Latin America, Eastern Europe, Western Europe, South Asia & Pacific, East Asia, and the Middle East & Africa, highlighting global demand dynamics and regulatory variations.

Table of Content

  1. Executive Summary
    • Global Market Outlook
    • Demand-side Trends
    • Supply-side Trends
    • Technology Roadmap Analysis
    • Analysis and Recommendations
  2. Market Overview
    • Market Coverage / Taxonomy
    • Market Definition / Scope / Limitations
  3. Market Background
    • Market Dynamics
      • Drivers
      • Restraints
      • Opportunity
      • Trends
    • Scenario Forecast
      • Demand in Optimistic Scenario
      • Demand in Likely Scenario
      • Demand in Conservative Scenario
    • Opportunity Map Analysis
    • Product Life Cycle Analysis
    • Supply Chain Analysis
      • Supply Side Participants and their Roles
        • Producers
        • Mid-Level Participants (Traders/ Agents/ Brokers)
        • Wholesalers and Distributors
      • Value Added and Value Created at Node in the Supply Chain
      • List of Raw Material Suppliers
      • List of Existing and Potential Buyer’s
    • Investment Feasibility Matrix
    • Value Chain Analysis
      • Profit Margin Analysis
      • Wholesalers and Distributors
      • Retailers
    • PESTLE and Porter’s Analysis
    • Regulatory Landscape
      • By Key Regions
      • By Key Countries
    • Regional Parent Market Outlook
    • Production and Consumption Statistics
    • Import and Export Statistics
  4. Global Market Analysis 2020-2024 and Forecast, 2025-2035
    • Historical Market Size Value (USD Million) & Volume (Units) Analysis, 2020-2024
    • Current and Future Market Size Value (USD Million) & Volume (Units) Projections, 2025-2035
      • Y-o-Y Growth Trend Analysis
      • Absolute $ Opportunity Analysis
  5. Global Market Pricing Analysis 2020-2024 and Forecast 2025-2035
  6. Global Market Analysis 2020-2024 and Forecast 2025-2035, By Product Type
    • Introduction / Key Findings
    • Historical Market Size Value (USD Million) & Volume (Units) Analysis By Product Type, 2020-2024
    • Current and Future Market Size Value (USD Million) & Volume (Units) Analysis and Forecast By Product Type, 2025-2035
      • Cone Calorimeter
      • Oxygen Consumption Calorimeter
      • Mass Loss Calorimeter
      • Others
    • Y-o-Y Growth Trend Analysis By Product Type, 2020-2024
    • Absolute $ Opportunity Analysis By Product Type, 2025-2035
  7. Global Market Analysis 2020-2024 and Forecast 2025-2035, By End Use
    • Introduction / Key Findings
    • Historical Market Size Value (USD Million) & Volume (Units) Analysis By End Use, 2020-2024
    • Current and Future Market Size Value (USD Million) & Volume (Units) Analysis and Forecast By End Use, 2025-2035
      • Automotive & Transportation
      • Aerospace
      • Certification & Research Labs
      • Process Industries
      • Mining & Metallurgy
      • Other Industrial
    • Y-o-Y Growth Trend Analysis By End Use, 2020-2024
    • Absolute $ Opportunity Analysis By End Use, 2025-2035
  8. Global Market Analysis 2020-2024 and Forecast 2025-2035, By Region
    • Introduction
    • Historical Market Size Value (USD Million) & Volume (Units) Analysis By Region, 2020-2024
    • Current Market Size Value (USD Million) & Volume (Units) Analysis and Forecast By Region, 2025-2035
      • North America
      • Latin America
      • Western Europe
      • Eastern Europe
      • East Asia
      • South Asia & Pacific
      • Middle East and Africa
    • Market Attractiveness Analysis By Region
  9. North America Market Analysis 2020-2024 and Forecast 2025-2035, By Country
    • Historical Market Size Value (USD Million) & Volume (Units) Trend Analysis By Market Taxonomy, 2020-2024
    • Market Size Value (USD Million) & Volume (Units) Forecast By Market Taxonomy, 2025-2035
      • By Country
        • U.S.
        • Canada
        • Mexico
      • By Product Type
      • By End Use
    • Market Attractiveness Analysis
      • By Country
      • By Product Type
      • By End Use
    • Key Takeaways
  10. Latin America Market Analysis 2020-2024 and Forecast 2025-2035, By Country
    • Historical Market Size Value (USD Million) & Volume (Units) Trend Analysis By Market Taxonomy, 2020-2024
    • Market Size Value (USD Million) & Volume (Units) Forecast By Market Taxonomy, 2025-2035
      • By Country
        • Brazil
        • Argentina
        • Rest of LATAM
      • By Product Type
      • By End Use
    • Market Attractiveness Analysis
      • By Country
      • By Product Type
      • By End Use
    • Key Takeaways
  11. Western Europe Market Analysis 2020-2024 and Forecast 2025-2035, By Country
    • Historical Market Size Value (USD Million) & Volume (Units) Trend Analysis By Market Taxonomy, 2020-2024
    • Market Size Value (USD Million) & Volume (Units) Forecast By Market Taxonomy, 2025-2035
      • By Country
        • Germany
        • Italy
        • France
        • UK
        • Spain
        • BENELUX
        • Nordic
        • Rest of W.Europe
      • By Product Type
      • By End Use
    • Market Attractiveness Analysis
      • By Country
      • By Product Type
      • By End Use
    • Key Takeaways
  12. Eastern Europe Market Analysis 2020-2024 and Forecast 2025-2035, By Country
    • Historical Market Size Value (USD Million) & Volume (Units) Trend Analysis By Market Taxonomy, 2020-2024
    • Market Size Value (USD Million) & Volume (Units) Forecast By Market Taxonomy, 2025-2035
      • By Country
        • Russia
        • Hungary
        • Poland
        • Balkan & Baltics
        • Rest of E. Europe
      • By Product Type
      • By End Use
    • Market Attractiveness Analysis
      • By Country
      • By Product Type
      • By End Use
    • Key Takeaways
  13. East Asia Market Analysis 2020-2024 and Forecast 2025-2035, By Country
    • Historical Market Size Value (USD Million) & Volume (Units) Trend Analysis By Market Taxonomy, 2020-2024
    • Market Size Value (USD Million) & Volume (Units) Forecast By Market Taxonomy, 2025-2035
      • By Country
        • China
        • Japan
        • South Korea
      • By Product Type
      • By End Use
    • Market Attractiveness Analysis
      • By Country
      • By Product Type
      • By End Use
    • Key Takeaways
  14. South Asia & Pacific Market Analysis 2020-2024 and Forecast 2025-2035, By Country
    • Historical Market Size Value (USD Million) & Volume (Units) Trend Analysis By Market Taxonomy, 2020-2024
    • Market Size Value (USD Million) & Volume (Units) Forecast By Market Taxonomy, 2025-2035
      • By Country
        • India
        • Australia & New Zealand
        • ASEAN
        • Rest of SAP
      • By Product Type
      • By End Use
    • Market Attractiveness Analysis
      • By Country
      • By Product Type
      • By End Use
    • Key Takeaways
  15. Middle East and Africa Market Analysis 2020-2024 and Forecast 2025-2035, By Country
    • Historical Market Size Value (USD Million) & Volume (Units) Trend Analysis By Market Taxonomy, 2020-2024
    • Market Size Value (USD Million) & Volume (Units) Forecast By Market Taxonomy, 2025-2035
      • By Country
        • GCC Countries
        • Northern Africa
        • South Africa
        • Turkiye
        • Rest of MEA
      • By Product Type
      • By End Use
    • Market Attractiveness Analysis
      • By Country
      • By Product Type
      • By End Use
    • Key Takeaways
  16. Key Countries Market Analysis
    • U.S.
      • Pricing Analysis
      • Market Share Analysis, 2024
        • By Product Type
        • By End Use
    • Canada
      • Pricing Analysis
      • Market Share Analysis, 2024
        • By Product Type
        • By End Use
    • Brazil
      • Pricing Analysis
      • Market Share Analysis, 2024
        • By Product Type
        • By End Use
    • Mexico
      • Pricing Analysis
      • Market Share Analysis, 2024
        • By Product Type
        • By End Use
    • Argentina
      • Pricing Analysis
      • Market Share Analysis, 2024
        • By Product Type
        • By End Use
  17. Market Structure Analysis
    • Competition Dashboard
    • Competition Benchmarking
    • Market Share Analysis of Top Players
      • By Regional
      • By Product Type
      • By End Use
  18. Competition Analysis
    • Competition Deep Dive
      • TESTech (Suzhou) Instrument Technologies Co., Ltd.
        • Overview
        • Product Portfolio
        • Profitability by Market Segments (Product/Age /Sales Channel/Region)
        • Sales Footprint
        • Strategy Overview
          • Marketing Strategy
          • Product Strategy
          • Channel Strategy
      • Dongguan Skyline Industrial Co., Ltd.
        • Overview
        • Product Portfolio
        • Profitability by Market Segments (Product/Age /Sales Channel/Region)
        • Sales Footprint
        • Strategy Overview
          • Marketing Strategy
          • Product Strategy
          • Channel Strategy
      • Asian Test Equipments
        • Overview
        • Product Portfolio
        • Profitability by Market Segments (Product/Age /Sales Channel/Region)
        • Sales Footprint
        • Strategy Overview
          • Marketing Strategy
          • Product Strategy
          • Channel Strategy
      • Delta Technology (Chongqing) Co., Ltd.
        • Overview
        • Product Portfolio
        • Profitability by Market Segments (Product/Age /Sales Channel/Region)
        • Sales Footprint
        • Strategy Overview
          • Marketing Strategy
          • Product Strategy
          • Channel Strategy
      • Fire Testing Technology (FTT)
        • Overview
        • Product Portfolio
        • Profitability by Market Segments (Product/Age /Sales Channel/Region)
        • Sales Footprint
        • Strategy Overview
          • Marketing Strategy
          • Product Strategy
          • Channel Strategy
      • Dongguan Daxian Instrument Equipment Co., Ltd.
        • Overview
        • Product Portfolio
        • Profitability by Market Segments (Product/Age /Sales Channel/Region)
        • Sales Footprint
        • Strategy Overview
          • Marketing Strategy
          • Product Strategy
          • Channel Strategy
      • Motis Fire Technology (China) Co., Ltd.
        • Overview
        • Product Portfolio
        • Profitability by Market Segments (Product/Age /Sales Channel/Region)
        • Sales Footprint
        • Strategy Overview
          • Marketing Strategy
          • Product Strategy
          • Channel Strategy
  19. Assumptions & Acronyms Used
  20. Research Methodology

List of Tables

  • Table 1: Global Market Value (USD Million) Forecast by Region, 2020-2035
  • Table 2: Global Market Volume (Units) Forecast by Region, 2020-2035
  • Table 3: Global Market Value (USD Million) Forecast by Product Type, 2020-2035
  • Table 4: Global Market Volume (Units) Forecast by Product Type, 2020-2035
  • Table 5: Global Market Value (USD Million) Forecast by End Use, 2020-2035
  • Table 6: Global Market Volume (Units) Forecast by End Use, 2020-2035
  • Table 7: North America Market Value (USD Million) Forecast by Country, 2020-2035
  • Table 8: North America Market Volume (Units) Forecast by Country, 2020-2035
  • Table 9: North America Market Value (USD Million) Forecast by Product Type, 2020-2035
  • Table 10: North America Market Volume (Units) Forecast by Product Type, 2020-2035
  • Table 11: North America Market Value (USD Million) Forecast by End Use, 2020-2035
  • Table 12: North America Market Volume (Units) Forecast by End Use, 2020-2035
  • Table 13: Latin America Market Value (USD Million) Forecast by Country, 2020-2035
  • Table 14: Latin America Market Volume (Units) Forecast by Country, 2020-2035
  • Table 15: Latin America Market Value (USD Million) Forecast by Product Type, 2020-2035
  • Table 16: Latin America Market Volume (Units) Forecast by Product Type, 2020-2035
  • Table 17: Latin America Market Value (USD Million) Forecast by End Use, 2020-2035
  • Table 18: Latin America Market Volume (Units) Forecast by End Use, 2020-2035
  • Table 19: Western Europe Market Value (USD Million) Forecast by Country, 2020-2035
  • Table 20: Western Europe Market Volume (Units) Forecast by Country, 2020-2035
  • Table 21: Western Europe Market Value (USD Million) Forecast by Product Type, 2020-2035
  • Table 22: Western Europe Market Volume (Units) Forecast by Product Type, 2020-2035
  • Table 23: Western Europe Market Value (USD Million) Forecast by End Use, 2020-2035
  • Table 24: Western Europe Market Volume (Units) Forecast by End Use, 2020-2035
  • Table 25: Eastern Europe Market Value (USD Million) Forecast by Country, 2020-2035
  • Table 26: Eastern Europe Market Volume (Units) Forecast by Country, 2020-2035
  • Table 27: Eastern Europe Market Value (USD Million) Forecast by Product Type, 2020-2035
  • Table 28: Eastern Europe Market Volume (Units) Forecast by Product Type, 2020-2035
  • Table 29: Eastern Europe Market Value (USD Million) Forecast by End Use, 2020-2035
  • Table 30: Eastern Europe Market Volume (Units) Forecast by End Use, 2020-2035
  • Table 31: East Asia Market Value (USD Million) Forecast by Country, 2020-2035
  • Table 32: East Asia Market Volume (Units) Forecast by Country, 2020-2035
  • Table 33: East Asia Market Value (USD Million) Forecast by Product Type, 2020-2035
  • Table 34: East Asia Market Volume (Units) Forecast by Product Type, 2020-2035
  • Table 35: East Asia Market Value (USD Million) Forecast by End Use, 2020-2035
  • Table 36: East Asia Market Volume (Units) Forecast by End Use, 2020-2035
  • Table 37: South Asia & Pacific Market Value (USD Million) Forecast by Country, 2020-2035
  • Table 38: South Asia & Pacific Market Volume (Units) Forecast by Country, 2020-2035
  • Table 39: South Asia & Pacific Market Value (USD Million) Forecast by Product Type, 2020-2035
  • Table 40: South Asia & Pacific Market Volume (Units) Forecast by Product Type, 2020-2035
  • Table 41: South Asia & Pacific Market Value (USD Million) Forecast by End Use, 2020-2035
  • Table 42: South Asia & Pacific Market Volume (Units) Forecast by End Use, 2020-2035
  • Table 43: Middle East and Africa Market Value (USD Million) Forecast by Country, 2020-2035
  • Table 44: Middle East and Africa Market Volume (Units) Forecast by Country, 2020-2035
  • Table 45: Middle East and Africa Market Value (USD Million) Forecast by Product Type, 2020-2035
  • Table 46: Middle East and Africa Market Volume (Units) Forecast by Product Type, 2020-2035
  • Table 47: Middle East and Africa Market Value (USD Million) Forecast by End Use, 2020-2035
  • Table 48: Middle East and Africa Market Volume (Units) Forecast by End Use, 2020-2035

List of Figures

  • Figure 1: Global Market Volume (Units) Forecast 2020-2035
  • Figure 2: Global Market Pricing Analysis
  • Figure 3: Global Market Value (USD Million) Forecast 2020-2035
  • Figure 4: Global Market Value Share and BPS Analysis by Product Type, 2025 and 2035
  • Figure 5: Global Market Y-o-Y Growth Comparison by Product Type, 2025-2035
  • Figure 6: Global Market Attractiveness Analysis by Product Type
  • Figure 7: Global Market Value Share and BPS Analysis by End Use, 2025 and 2035
  • Figure 8: Global Market Y-o-Y Growth Comparison by End Use, 2025-2035
  • Figure 9: Global Market Attractiveness Analysis by End Use
  • Figure 10: Global Market Value (USD Million) Share and BPS Analysis by Region, 2025 and 2035
  • Figure 11: Global Market Y-o-Y Growth Comparison by Region, 2025-2035
  • Figure 12: Global Market Attractiveness Analysis by Region
  • Figure 13: North America Market Incremental $ Opportunity, 2025-2035
  • Figure 14: Latin America Market Incremental $ Opportunity, 2025-2035
  • Figure 15: Western Europe Market Incremental $ Opportunity, 2025-2035
  • Figure 16: Eastern Europe Market Incremental $ Opportunity, 2025-2035
  • Figure 17: East Asia Market Incremental $ Opportunity, 2025-2035
  • Figure 18: South Asia & Pacific Market Incremental $ Opportunity, 2025-2035
  • Figure 19: Middle East and Africa Market Incremental $ Opportunity, 2025-2035
  • Figure 20: North America Market Value Share and BPS Analysis by Country, 2025 and 2035
  • Figure 21: North America Market Value Share and BPS Analysis by Product Type, 2025 and 2035
  • Figure 22: North America Market Y-o-Y Growth Comparison by Product Type, 2025-2035
  • Figure 23: North America Market Attractiveness Analysis by Product Type
  • Figure 24: North America Market Value Share and BPS Analysis by End Use, 2025 and 2035
  • Figure 25: North America Market Y-o-Y Growth Comparison by End Use, 2025-2035
  • Figure 26: North America Market Attractiveness Analysis by End Use
  • Figure 27: Latin America Market Value Share and BPS Analysis by Country, 2025 and 2035
  • Figure 28: Latin America Market Value Share and BPS Analysis by Product Type, 2025 and 2035
  • Figure 29: Latin America Market Y-o-Y Growth Comparison by Product Type, 2025-2035
  • Figure 30: Latin America Market Attractiveness Analysis by Product Type
  • Figure 31: Latin America Market Value Share and BPS Analysis by End Use, 2025 and 2035
  • Figure 32: Latin America Market Y-o-Y Growth Comparison by End Use, 2025-2035
  • Figure 33: Latin America Market Attractiveness Analysis by End Use
  • Figure 34: Western Europe Market Value Share and BPS Analysis by Country, 2025 and 2035
  • Figure 35: Western Europe Market Value Share and BPS Analysis by Product Type, 2025 and 2035
  • Figure 36: Western Europe Market Y-o-Y Growth Comparison by Product Type, 2025-2035
  • Figure 37: Western Europe Market Attractiveness Analysis by Product Type
  • Figure 38: Western Europe Market Value Share and BPS Analysis by End Use, 2025 and 2035
  • Figure 39: Western Europe Market Y-o-Y Growth Comparison by End Use, 2025-2035
  • Figure 40: Western Europe Market Attractiveness Analysis by End Use
  • Figure 41: Eastern Europe Market Value Share and BPS Analysis by Country, 2025 and 2035
  • Figure 42: Eastern Europe Market Value Share and BPS Analysis by Product Type, 2025 and 2035
  • Figure 43: Eastern Europe Market Y-o-Y Growth Comparison by Product Type, 2025-2035
  • Figure 44: Eastern Europe Market Attractiveness Analysis by Product Type
  • Figure 45: Eastern Europe Market Value Share and BPS Analysis by End Use, 2025 and 2035
  • Figure 46: Eastern Europe Market Y-o-Y Growth Comparison by End Use, 2025-2035
  • Figure 47: Eastern Europe Market Attractiveness Analysis by End Use
  • Figure 48: East Asia Market Value Share and BPS Analysis by Country, 2025 and 2035
  • Figure 49: East Asia Market Value Share and BPS Analysis by Product Type, 2025 and 2035
  • Figure 50: East Asia Market Y-o-Y Growth Comparison by Product Type, 2025-2035
  • Figure 51: East Asia Market Attractiveness Analysis by Product Type
  • Figure 52: East Asia Market Value Share and BPS Analysis by End Use, 2025 and 2035
  • Figure 53: East Asia Market Y-o-Y Growth Comparison by End Use, 2025-2035
  • Figure 54: East Asia Market Attractiveness Analysis by End Use
  • Figure 55: South Asia & Pacific Market Value Share and BPS Analysis by Country, 2025 and 2035
  • Figure 56: South Asia & Pacific Market Value Share and BPS Analysis by Product Type, 2025 and 2035
  • Figure 57: South Asia & Pacific Market Y-o-Y Growth Comparison by Product Type, 2025-2035
  • Figure 58: South Asia & Pacific Market Attractiveness Analysis by Product Type
  • Figure 59: South Asia & Pacific Market Value Share and BPS Analysis by End Use, 2025 and 2035
  • Figure 60: South Asia & Pacific Market Y-o-Y Growth Comparison by End Use, 2025-2035
  • Figure 61: South Asia & Pacific Market Attractiveness Analysis by End Use
  • Figure 62: Middle East and Africa Market Value Share and BPS Analysis by Country, 2025 and 2035
  • Figure 63: Middle East and Africa Market Value Share and BPS Analysis by Product Type, 2025 and 2035
  • Figure 64: Middle East and Africa Market Y-o-Y Growth Comparison by Product Type, 2025-2035
  • Figure 65: Middle East and Africa Market Attractiveness Analysis by Product Type
  • Figure 66: Middle East and Africa Market Value Share and BPS Analysis by End Use, 2025 and 2035
  • Figure 67: Middle East and Africa Market Y-o-Y Growth Comparison by End Use, 2025-2035
  • Figure 68: Middle East and Africa Market Attractiveness Analysis by End Use
  • Figure 69: Global Market - Tier Structure Analysis
  • Figure 70: Global Market - Company Share Analysis

Frequently Asked Questions

What is the market size of the heat release tester market in 2025?

The market is estimated to be worth USD 413.2 million in 2025.

What is the projected size of the heat release tester market by 2035?

The market is expected to reach USD 582.8 million by 2035.

What is the CAGR of the heat release tester market from 2025 to 2035?

The market is anticipated to grow at a CAGR of 3.5% during the forecast period.

Which product type holds the largest share in the heat release tester market?

Cone calorimeters lead the segment with a 48% share in 2025.

Which country is the fastest growing in the heat release tester market?

South Korea is the top growing country, expanding at a CAGR of 4.5% from 2025 to 2035.

Explore Similar Insights

Future Market Insights

Heat Release Tester Market