The Heat Moisture Exchanger Market is estimated to be valued at USD 302.8 million in 2025 and is projected to reach USD 448.2 million by 2035, registering a compound annual growth rate (CAGR) of 4.0% over the forecast period.
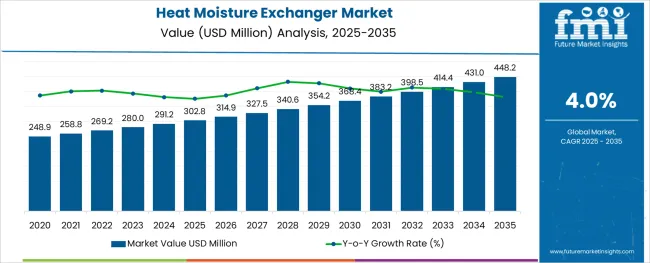
The heat moisture exchanger market is expanding steadily as respiratory care becomes a top priority across healthcare systems. Increased cases of respiratory diseases and post-surgical complications have contributed to the wider adoption of heat moisture exchangers in clinical settings. Healthcare professionals have increasingly recognized these devices for their role in preserving airway humidity and reducing the risk of infection during mechanical ventilation.
Product innovations that improve filtration efficiency and patient comfort have further supported market growth. The surge in surgical volumes and intensive care admissions has also raised the need for effective airway management solutions.
With ongoing improvements in patient care protocols and hospital infrastructure, demand for heat moisture exchangers is expected to continue rising. Segmental expansion is projected to be led by Disposable devices in the device type category, Respiratory Care as the primary application, and Hospitals as the key end-use sector.
The market is segmented by Device Type, Application, and End Use and region. By Device Type, the market is divided into Disposable and Reusable. In terms of Application, the market is classified into Respiratory Care, Geriatric Care, and Neonatal Care.
Based on End Use, the market is segmented into Hospitals, Clinics, Ambulatory Surgical Centers, Home Care Settings, and Others. Regionally, the market is classified into North America, Latin America, Western Europe, Eastern Europe, Balkan & Baltic Countries, Russia & Belarus, Central Asia, East Asia, South Asia & Pacific, and the Middle East & Africa.
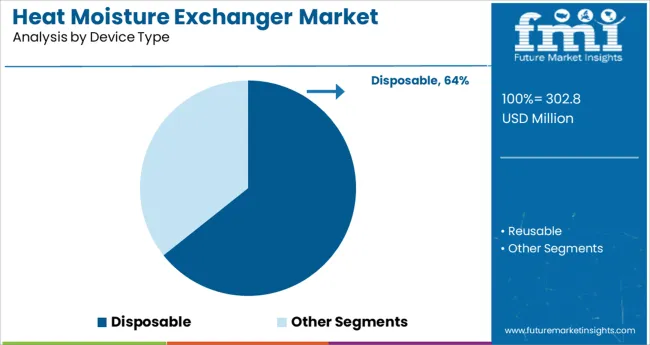
The Disposable segment is expected to contribute 64.3% of the heat moisture exchanger market revenue in 2025, making it the largest device type. This growth is supported by the increased preference for single-use products that help prevent cross-contamination in clinical environments. Healthcare providers have prioritized disposable heat moisture exchangers to meet infection control guidelines and reduce the risk of hospital-acquired infections.
These devices offer the advantage of being cost-effective for short-term use while eliminating the need for cleaning and sterilization between patients. Additionally, the convenience of disposable products has allowed hospitals and surgical centers to streamline respiratory care processes.
With infection prevention remaining a core focus in healthcare, the Disposable segment is expected to maintain its leading position.
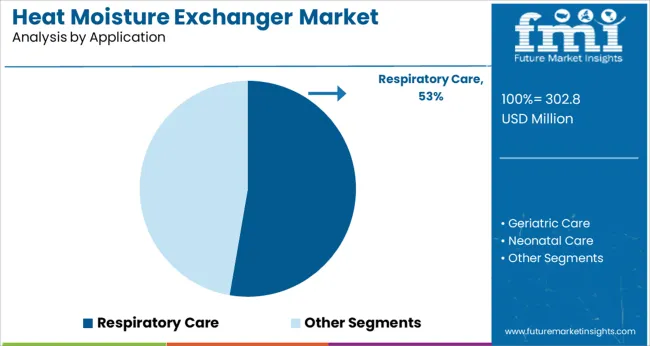
The Respiratory Care segment is projected to hold 52.7% of the heat moisture exchanger market revenue in 2025, maintaining its leadership across applications. This segment has grown due to the increasing incidence of chronic respiratory conditions and the rising demand for ventilator-associated care. Heat moisture exchangers have become a standard component in respiratory circuits, helping maintain airway humidity and reduce complications from mechanical ventilation.
Clinical practices have incorporated these devices across critical care, emergency, and post-operative respiratory management to ensure patient safety and comfort. Moreover, respiratory care units have adopted heat moisture exchangers as part of routine respiratory hygiene protocols.
As the need for supportive respiratory therapies grows, the Respiratory Care segment is expected to remain at the forefront of heat moisture exchanger usage.
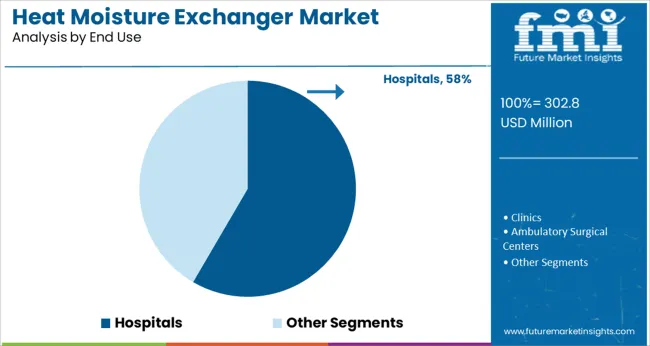
The Hospitals segment is forecasted to account for 58.4% of the heat moisture exchanger market revenue in 2025, establishing itself as the leading end-use segment. This growth has been driven by the high procedural volume and diverse patient base treated within hospital settings. Hospitals have relied on heat moisture exchangers for managing patients in intensive care units, operating rooms, and post-anesthesia care units where respiratory support is frequently required.
Standardization of infection control practices and the demand for efficient airway management tools have supported the adoption of these devices in hospitals. Furthermore, the expanding network of healthcare facilities and upgrades in critical care infrastructure have fueled product demand.
With hospitals continuing to play a central role in advanced respiratory care delivery, this end-use segment is expected to sustain its market dominance.
By combining with filters, sales of heat moisture exchangers are anticipated to grow for patients with an intubated trachea, as in conjunction they fulfill major functions.
To push the growth of the heat moisture exchanger market share, there should be an increase in conducting preventive therapeutic programs.
The increase in demand for heat moisture exchangers is the result of geriatric population treatment, respiratory diseases, traumatic injuries, and treatment.
Consumers are driven to heat moisture exchangers as they effectively conserve moisture that has been effective in improving patient care thereby spiking the overall sales of heat moisture exchangers.
Firm regulation policies in certain countries regarding the heat moisture exchanger’s cost, safety, and efficacy are expected to hamper the heat moisture exchanger market share.
Alternative devices, like heated humidifiers, if sought-after can be impeding for the sales of heat moisture exchangers.
Both global and regional manufacturers focus on the sales of heat moisture exchangers, therefore making the market extremely competitive.
New opportunities for the heat moisture exchanger market share are to be presented through ongoing Research and Development activities.
Manufacturers of heat moisture exchangers have introduced new approaches to expand their product line and impression in the market, in turn, augmenting the sales of heat moisture exchangers on the whole.
By expanding the product footprint and solemnly investing in Research and Development, they are trying to come up with innovative heat moisture exchanger products in developing nations, opening up a wide array of heat moisture exchanger market opportunities.
Various emerging trends in the heat moisture exchanger market are brought about in the market, one of which is the merging of small and local companies through investments brought in by several pivotal manufacturers.
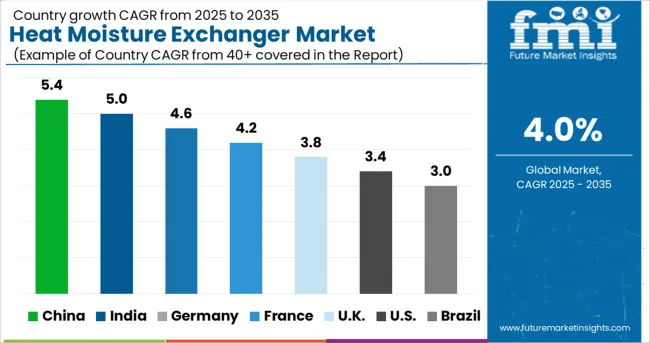
North America is currently leading in the global market with respect to demand for heat moisture exchangers.
The subsequent regions to be dominating the demand for heat moisture exchangers are Europe and Asia-Pacific. Russia is said to follow suit and lead the heat moisture exchanger market share, owing to the frequent cases of respiratory diseases in Russian adults, as analyzed in Russia’s Health Ministry report of 2020.
The forecast period can beget a growth of the sales of heat moisture exchangers at a rapid pace in Asia-Pacific countries like China and India.
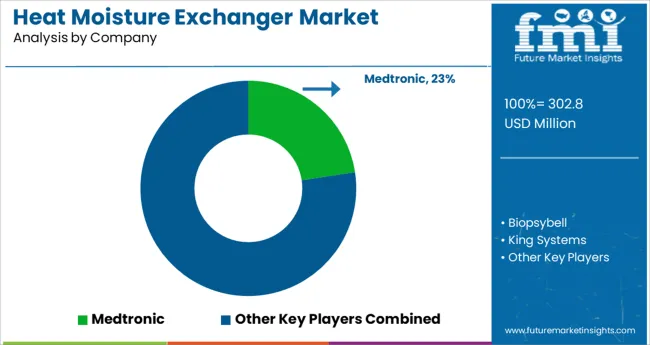
The key players present in the global heat moisture exchanger market are Biopsybell, King Systems, Vadi Medical, Toshiba Air Conditioning, Galemed, Draeger, Pharma Systems AB, Smiths Medical, Sarnova, Intersurgical, Medtronic Teleflex, etc.
There have been some recent developments in the heat moisture exchanger market
| Report Attribute | Details |
|---|---|
| Growth Rate | CAGR of 4% from 2025 to 2035 |
| The base year for estimation | 2024 |
| Historical data | 2020 to 2024 |
| Forecast period | 2025 to 2035 |
| Quantitative units | Revenue in million and CAGR from 2025 to 2035 |
| Report Coverage | Revenue forecast, volume forecast, company ranking, competitive landscape, growth factors, and trends, Pricing Analysis |
| Segments Covered | Device Type, Application, End Use, Region |
| Regional scope | North America; Latin America; Western Europe; Eastern Europe; Asia Pacific excluding Japan; Japan; The Middle East and Africa |
| Country scope | USA, Canada, Mexico, Germany, United Kingdom, France, Italy, Spain, Russia, Belgium, Poland, Czech Republic, China, India, Japan, Australia, Brazil, Argentina, Colombia, Saudi Arabia, United Arab Emirates(UAE), Iran, South Africa |
| Key companies profiled | Biopsybell; King Systems; Vadi Medical; Toshiba Air Conditioning; Galemed; Draeger; Pharma Systems AB; Smiths Medical; Sarnova; Intersurgical; Medtronic Teleflex |
| Customization scope | Free report customization (equivalent to up to 8 analysts' working days) with purchase. Addition or alteration to country, regional & segment scope. |
| Pricing and purchase options | Avail customized purchase options to meet your exact research needs. |
The global heat moisture exchanger market is estimated to be valued at USD 302.8 million in 2025.
It is projected to reach USD 448.2 million by 2035.
The market is expected to grow at a 4.0% CAGR between 2025 and 2035.
The key product types are disposable and reusable.
respiratory care segment is expected to dominate with a 52.7% industry share in 2025.


Our Research Products

The "Full Research Suite" delivers actionable market intel, deep dives on markets or technologies, so clients act faster, cut risk, and unlock growth.

The Leaderboard benchmarks and ranks top vendors, classifying them as Established Leaders, Leading Challengers, or Disruptors & Challengers.

Locates where complements amplify value and substitutes erode it, forecasting net impact by horizon

We deliver granular, decision-grade intel: market sizing, 5-year forecasts, pricing, adoption, usage, revenue, and operational KPIs—plus competitor tracking, regulation, and value chains—across 60 countries broadly.

Spot the shifts before they hit your P&L. We track inflection points, adoption curves, pricing moves, and ecosystem plays to show where demand is heading, why it is changing, and what to do next across high-growth markets and disruptive tech

Real-time reads of user behavior. We track shifting priorities, perceptions of today’s and next-gen services, and provider experience, then pace how fast tech moves from trial to adoption, blending buyer, consumer, and channel inputs with social signals (#WhySwitch, #UX).

Partner with our analyst team to build a custom report designed around your business priorities. From analysing market trends to assessing competitors or crafting bespoke datasets, we tailor insights to your needs.
Supplier Intelligence
Discovery & Profiling
Capacity & Footprint
Performance & Risk
Compliance & Governance
Commercial Readiness
Who Supplies Whom
Scorecards & Shortlists
Playbooks & Docs
Category Intelligence
Definition & Scope
Demand & Use Cases
Cost Drivers
Market Structure
Supply Chain Map
Trade & Policy
Operating Norms
Deliverables
Buyer Intelligence
Account Basics
Spend & Scope
Procurement Model
Vendor Requirements
Terms & Policies
Entry Strategy
Pain Points & Triggers
Outputs
Pricing Analysis
Benchmarks
Trends
Should-Cost
Indexation
Landed Cost
Commercial Terms
Deliverables
Brand Analysis
Positioning & Value Prop
Share & Presence
Customer Evidence
Go-to-Market
Digital & Reputation
Compliance & Trust
KPIs & Gaps
Outputs
Full Research Suite comprises of:
Market outlook & trends analysis
Interviews & case studies
Strategic recommendations
Vendor profiles & capabilities analysis
5-year forecasts
8 regions and 60+ country-level data splits
Market segment data splits
12 months of continuous data updates
DELIVERED AS:
PDF EXCEL ONLINE
Heat-Treated NiTi Endodontic File Market Size and Share Forecast Outlook 2025 to 2035
Heated Sampling Composite Tube Market Size and Share Forecast Outlook 2025 to 2035
Heat Seal Film Market Size and Share Forecast Outlook 2025 to 2035
Heat Shrink Fitting Machines Market Size and Share Forecast Outlook 2025 to 2035
Heat Detachable Tape Market Size and Share Forecast Outlook 2025 to 2035
Heat Induction Cap Liner Market Size and Share Forecast Outlook 2025 to 2035
Heat Pump Market Size and Share Forecast Outlook 2025 to 2035
Heat Transfer Film Market Size and Share Forecast Outlook 2025 to 2035
Heater-Cooler Devices Market Size and Share Forecast Outlook 2025 to 2035
Heat Sealing Equipment Market Size and Share Forecast Outlook 2025 to 2035
Heat Treating Market Size and Share Forecast Outlook 2025 to 2035
Heating Agents Market Size and Share Forecast Outlook 2025 to 2035
Heat Diffuser Market Size and Share Forecast Outlook 2025 to 2035
Heat Pump Market Analysis - Size, Share, and Forecast Outlook 2025 to 2035
Heat Pump Compressors Market Size and Share Forecast Outlook 2025 to 2035
Heat-Activated Beauty Masks Market Analysis - Size, Share, and Forecast Outlook 2025 to 2035
Heat Sealable Packaging Market Size and Share Forecast Outlook 2025 to 2035
Heat Recovery System Generator Market Size and Share Forecast Outlook 2025 to 2035
Heat Shrink Tubes Market Size and Share Forecast Outlook 2025 to 2035
Heat Pump Laundry Dryer Rotary Compressors Market Size and Share Forecast Outlook 2025 to 2035

Thank you!
You will receive an email from our Business Development Manager. Please be sure to check your SPAM/JUNK folder too.
Chat With
MaRIA