A Summary of the Countertop Blast Chiller Market Developments (2023 to 2033)

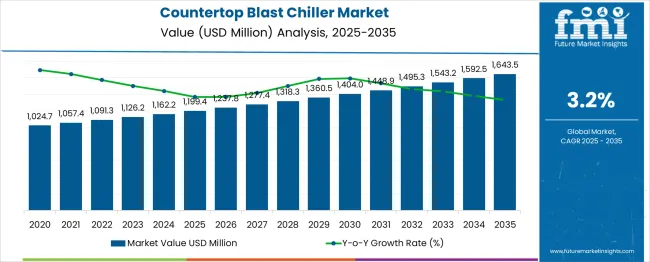
The global countertop blast chiller market is projected to have a moderate-paced CAGR of 3.2% during the forecast period. The current valuation of the market is US$ 1,126.20 million in 2023. The market value of the countertop blast chiller market is anticipated to reach a high of US$ 1,543.20 million by the year 2033. A historical market valuation of US$ 1,091.28 million has been recorded by the experts of Future Market Insights for the concerned market during the base year. This growth is supported by the following:

  • Shifting focus of major restaurants toward countertop blast chillers to preserve the food for a longer duration without any compromise made on the food quality.
  • Wider availability, lightweight frame, and durability, coupled with the quick operation, are increasing the market representation of countertop blast chillers worldwide.
  • A surge in demand for cooling solutions across the food industries is creating favorable growth opportunities for the key players in the market.
  • The expansion of delis and supermarkets worldwide, as well as the rapid propulsion of the restaurant sectors, is fueling the sales of countertop blast chillers in recent years.
  • Evolving consumer lifestyles, ascending demand from developing economies, and technological advancements are also aspects that need to be considered behind the growth of the forum.
  • Supportive government initiatives to reduce food wastage and improvement of food quality are expected to stir up industry statistics for countertop blast chillers.
  • Easy transportation and portability, along with the reduction of waste caused by the rapid decomposition of non-chilled food, is a major driving force in the countertop blast chiller market.

Although the forum is witnessing healthy growth, the expert analysts at Future Market Insights have revealed while analyzing the market in depth that certain elements are likely to curb the growth in the long run. They include:

  • The countertop blast chillers are more expensive than the traditional chilling systems. The initial set-up cost is anticipated to be 20-30% higher than the commercial blast chillers.
  • While installation of countertop blast chillers, operators end up purchasing expensive HVAC systems, which is likely to limit the sales of the product in the forthcoming years.
  • Frequent maintenance of the chillers especially related to compressors and evaporators impelled by suction line blockage is predicted to exert a negative influence on the countertop blast chillers industry and impede the growth of the global market during the forecast period.

Don't pay for what you don't need

Customize your report by selecting specific countries or regions and save 30%!

Penetration of IoT and AI: A Blessing to Boon

The expert analysts at FMI have identified that the key players in the countertop blast chiller market are adopting new technologies for these shock freezers. With the evolution of the lifestyle and business of the populace, there is a need for faster food services, fueling the sale of compact blast chillers.

To keep in tandem with consumer demand, the market is driven by Artificial Intelligence (AI) and Internet of Things (IoT)-based blast chillers, which are creating a huge impact on fast processing. For instance, a key manufacturer Rendell launched its new BC series reach-in blast chiller, a model that holds 18 standard pans, nine sheet pans, or a combination of both.

Report Attribute Details
Countertop Blast Chiller Market Value (2023) US$ 1,126.20 million
Countertop Blast Chiller Market Anticipated Value (2033) US$ 1,543.20 miillion
Countertop Blast Chiller Projected Growth Rate (2023 to 2033) 3.2%

Countertop Blast Chiller Market

A Contrast with the Historical Market Scenario

As per the analysis of FMI, the countertop blast chiller market has been witnessing an unprecedented surge in the past few years. There is an approximate rise of US$ 34.92 million surge in the total market value from 2022 to 2023.

The upsurge in the sale of countertop blast chillers can be attributed to the increasing demand for advanced machinery. Rising awareness regarding food safety and government initiatives to reduce food wastage are propelling the demand for this product further. Industry 4.0, Big Data, and the introduction of IoT has led to the rise of smart food industries to manufacture technology-based equipment.

The usage of countertop blast chillers is helping aid restaurants to achieve the highest level of food safety, improvement of traceability, cut down wastage, and reduce cost, self-diagnosis, and remote maintenance, due to which they are largely incorporating these freezers to avail the benefits. This aspect is driving the market demand and is expected to lead the market towards further expansion during the projection period.

Nandini Roy Choudhury

Principal Consultant

Talk to Analyst

Find your sweet spots for generating winning opportunities in this market.

Comparative Analysis of Adjacent Markets

Countertop Blast Chiller Market:

Differentiating Aspects Countertop Blast Chiller Market
CAGR 3.2%
Market Valuation in 2023 US$ 1,126.20 Million
Projected Market Value in 2033 US$ 1,543.20 Million
Drivers
  • Full-service restaurants integrating automated technologies like AI and IoT are expected to fuel market growth.
  • Increasing awareness regarding food safety and longer shelf-life of food, and concerns to reduce wastage are likely to propel the expansion of the countertop blast chiller market.

Roll-in Chiller Market:

Differentiating Aspects Roll-in Chiller Market
CAGR 7%
Market Valuation in 2023 US$ 1.69 Billion
Projected Market Value in 2033 US$ 3.67 Billion
Drivers
  • High demand consumers for convenience food or ready-to-eat food and its storage is likely to aid the growth of the market shares for roll-in blast chillers.
  • The blast freezers have multiple shelves where food pans or sheet pans can be stored and chilled at extremely low temperatures, making it convenient for restaurants.

Commercial Food Warming Equipment Market:

Differentiating Aspects Commercial Food Warming Equipment Market
CAGR 4.5%
Market Valuation in 2023 US$ 5.87 Billion
Projected Market Value in 2033 US$ 9.12 Billion
Drivers
  • Technological innovations along with the launch of novel products owing to fluctuating consumer preferences augmenting growth in the commercial food warming equipment market.
  • Food service participants are continually putting efforts to ensure that the cooked food is free from harmful bacteria and remains at the desired temperature level through the use of holding and warming equipment.

Category-wise Insights - Identifying the Domineering Segments

Roll-in Blast Chillers - By Type

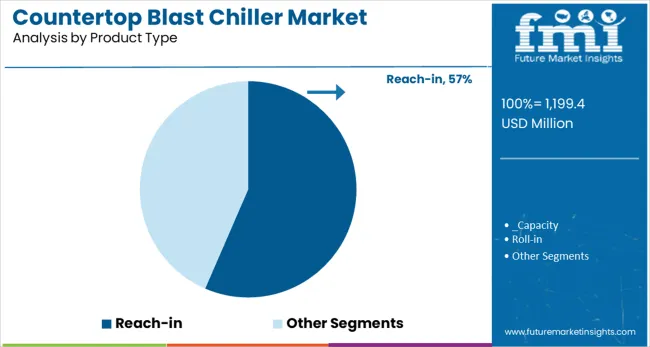
It is anticipated that the roll-in blast chillers are dominating the product type segment and are likely to advance at a moderate pace, registering a CAGR of 7.5% through the forecast period. The roll-in freezers are further classified into below 100KG, 100-200KG, and above 200 KG. The main factors attributing to the growth of this segment can be identified as follows:

  • The roll-in blast chillers possess the ability to inhibit the expansion of harmful bacteria in food.
  • They have high payload capacity, which is likely to create a positive environment and unveil growth prospects for manufacturers, bolstering industry growth through 2033.

Bakery & Confectionary Sector - By End-use

FMI has analyzed that OEMs are focusing on developing countertop blast chillers for the bakery and confectionary sector. This segment accounted for an approximate share of 10% during the base year. The rising application in the bakery and confectionary sector is due to the following aspects:

  • These chillers possess the capacity to maintain the proper temperature for pastries and bread.
  • Flash freezers retain the structure of the cakes intact as well as maintain the inside confectionery products’ hygiene for a longer duration.

Countertop blast chiller manufacturers are launching their new products, especially for bakery & confectionary applications, to improve their market share. OEMs, including Irinox and Hobart Dayton Mexicana, are unveiling their latest innovations to stay competitive in the market.
Get the data you need at a Fraction of the cost

Personalize your report by choosing insights you need
and save 40%!

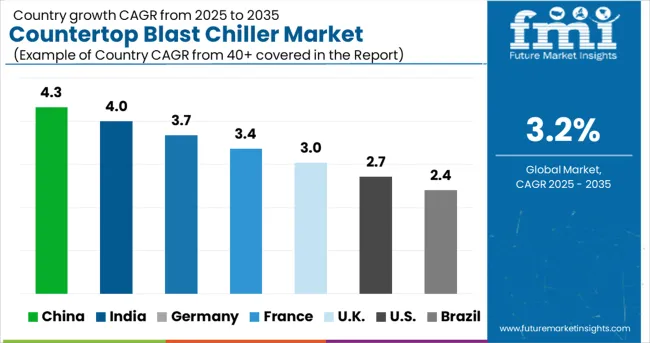
Country-wise Insights

An initiative of Diverse Countries to Expand their Business in Potential Areas for Higher Profitability

Country/Region United States
Statistics The countertop blast chiller market in the USA is projected to record a moderate-paced CAGR of 6% through 2033. The current market valuation stands at US$ 565.73 million in 2023.
Growth Propellants Aspects fueling the growth of the market in the USA are:
  • The rapid rise in the number of restaurants is witnessed since the country has been registering increasing visitor footfall and sales across the restaurant segment.
  • Demand to preserve food products at accurate temperatures to drive growth.
Country/Region Europe
Statistics The European countertop blast chiller market is anticipated to register a CAGR of 7%, and the market valuation is estimated to surpass US$ 876 million by 2033.
Growth Propellants
  • The accelerating growth in this region is due to:
    The presence of prominent players like Master-Bilt Products, Williams Refrigeration, and more.
  • The trend of eating out is expected to stay afloat in Germany.
  • Changing preferences of individuals due to their hectic work schedules have been generating increasing demand for preserved food, otherwise known as convenience food, which is fueling the adoption of countertop blast chillers.
Country/Region Japan
Statistics The countertop blast chiller market In Japan is poised to register a CAGR of 6% during the forecast period.
Growth Propellants The factors attributing to the propulsion of the market in Japan can be identified as follows:
  • Significant urbanization and supportive government regulations for the hospitality sector in Japan are creating remarkable opportunities for market expansion.
  • Integration of automated technologies across Japan, which is helping in the maintenance of hygiene, sterilization, and accurate temperature is boosting the expansion of the forum.
Country/Region Korea
Statistics Korea is expected to advance at an average-paced CAGR of 6.5% during the period 2023 to 2033.
Growth Propellants The aspects responsible for the expansion of the countertop blast chiller market in Korea are as follows:
  • This country is having a quest towards achieving resource and energy efficiency amid the growth of food sectors, which is fueling the adoption of countertop blast chillers in Korea.
  • Innovations made by manufacturers in Korea after rigorous research and development activities, coupled with demand for convenience food led to expanding the market size of countertop blast chillers in this country.

Start-up Ecosystem

Attempts of Start-up Firms in Stirring Up the Market Dynamics

The new entrants in the countertop blast chiller market are leveraging advancements in technology to launch new products and gain a competitive advantage. These firms are continually investing in research and development activities to keep themselves in tandem with the changing consumer preferences and end-use industry demands. Efforts are being made to strengthen their foothold in the forum and aid the further progression of the countertop blast chiller market.

Top Start-ups to Watch For

KREW - This India-based firm is manufacturing fully automatic ice machines and has been focusing on developing products that are particular about the quality of ice; and are unveiling their new products to improve market statistics in the potential industry.

Labh Projects Pvt. Ltd - This emerging company is professionally competent in manufacturing customized process chillers. You can share your industrial requirements, dimensions, applications, etc., with the team comprising engineers and technicians. Their team dedicatedly works on the customer requirement to deliver the product you require.
Competitive Landscape

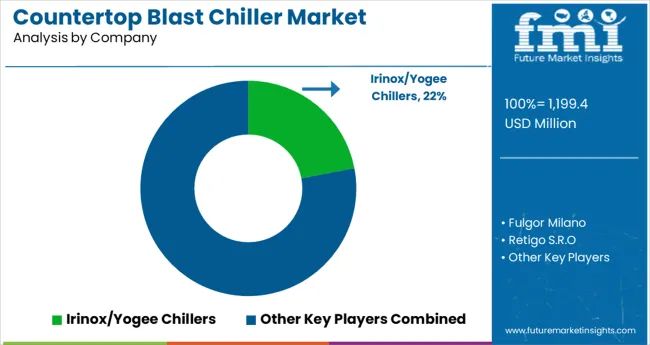
Industry Biggies Cede a Silver Lining to the Market-o-nomics

Countertop blast chillers have garnered significant popularity over the past few years, owing to fluctuating consumer preferences.

Countertop blast chiller manufacturers are launching the mini blast chiller series to improve their market position. Manufacturers are investing heavily in their Research and Development (R&D) to invent new blast freezers with multiple features and easy-handling facilities. OEMs are designing large quantity blast chillers & freezers to attract established hotel business companies to increase their flash freezers sale.

3 Top Players Identified in the Forum

  • IRINOX

IRINOX manufactures and sells shock freezers, blast chillers, holding cabinets, and proofing systems. The company has installed more than 40,000 machines and distributed its products in more than 80 countries. The company focuses on investments in R&D to develop innovative products with improved technology.

  • Williams Refrigeration

Williams Refrigeration manufactures and supplies refrigeration solutions across the world. Its offerings include reach-in/modular blast chillers and freezers, merchandisers, back bars, counters, cabinets, and specialist bakery equipment. It operates as a subsidiary of the AFE Group and has manufacturing facilities in China and Australia. Williams Refrigeration focuses on R&D, the manufacture of new products, and the redesigning of its existing products.

  • Traulsen & Co

Traulsen engages in the design, manufacture, and servicing of refrigeration equipment that include quick and blast chillers, dual-temperature models, prep tables, and hot-food holding cabinets. It also offers convertible freezers, sliding-glass-door refrigerators, fast freezers, and wine coolers. It operates as a subsidiary of Hobart Corporation.

The company is continuously developing new products and incorporating innovative technologies to meet the demands of customers. It focuses on the development of new electronic systems that include temperature controls and monitors.

Recent Developments

  • In May 2021, Nuovair partnered with Welbilt, Inc. to expand its business operations in North America. With this partnership, Wellbilt, Inc. will be able to sell Nuovair’s blast freezers of various capacities including 100-200KG in the USA and Canada.
  • In February 2021, Irinox announced the launch of its new sustainable refrigerant, MutliFresh Next, which can offer up to 40% faster chilling and freezing for quicker cycles, promising zero emissions. Operators can also remotely monitor the operating data by connecting their smartphones to the FreshCloud app.
  • In May 2020, William Refrigeration launched cabinet designed blast freezer WTBC70 that supports the combi oven trolleys. WTBC70 possesses multiple features such as an air-smart airflow system, instant temperature reduction, and a simple blast control panel.

Some of the key companies identified in the market are

  • Fulgor Milano
  • Retigo S.R.O
  • Friginox
  • Irinox
  • Master-Bilt Products
  • Infrico SL
  • SMEG SPA
  • Williams Refrigeration
  • Tecnomac
  • Alto Shaam Inc.
  • Victory refrigeration
  • Traulsen & Co.
  • AB Electrolux

Key Segments in the Countertop Blast Chiller Market

By Product Type:

  • Reach-in
    • By Capacity
      • Below 50KG
      • 50 - 100 KG
  • Roll-in
    • By Capacity
      • Below 100KG
      • 100 - 200KG
      • Above 200KG

By Chilling:

  • Soft Chilling
  • Hard Chilling
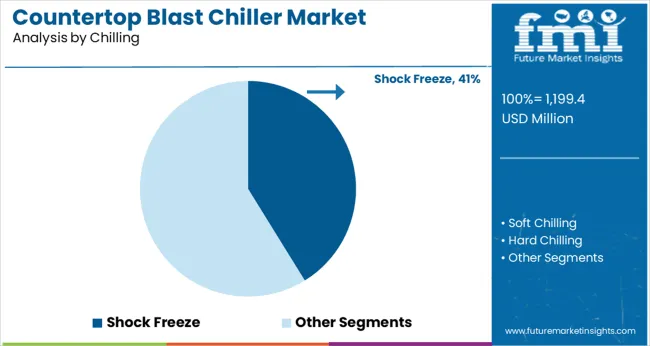
  • Shock Freeze

By Application:

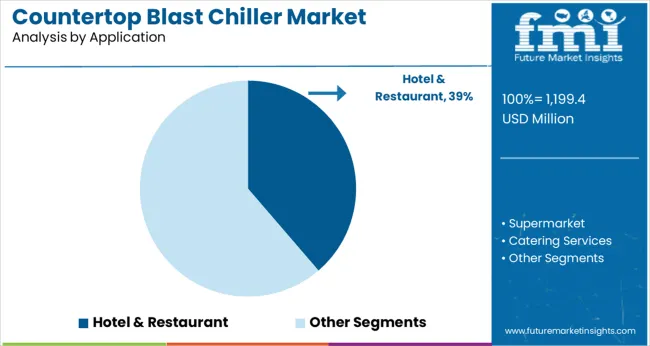
  • Hotel & Restaurant
  • Supermarket
  • Catering Services
  • Bakery & Confectionary
  • Others

By Region:

  • North America
  • Latin America
  • Asia Pacific
  • Middle East and Africa (MEA)
  • Europe

Frequently Asked Questions

What is the Growth Outlook for the Countertop Blast Chiller Market?

The growth outlook for the countertop blast chiller market is predicted to advance at a CAGR of 3.2% from 2023 to 2033.

Which Region Leads the Countertop Blast Chiller Market?

The North American region is anticipated to lead the countertop blast chiller market during the forecast period.

What is the market valuation of Countertop Blast Chiller in 2023?

The market valuation of the countertop blast chiller market stands at US$ 1,126.20 million in 2023.

How much Growth Potential does the Countertop Blast Chiller hold?

The countertop blast chiller market is likely to hold a valuation of US$ 1,543.20 million by 2033.

Which sector is the key driver in the Countertop Blast Chiller Market?

The bakery & confectionary sector is the key driver in the countertop blast chiller market.

Table of Content
1. Executive Summary | Countertop Blast Chiller Market

    1.1. Global Market Outlook

    1.2. Demand-side Trends

    1.3. Supply-side Trends

    1.4. Technology Roadmap Analysis

    1.5. Analysis and Recommendations

2. Market Overview

    2.1. Market Coverage / Taxonomy

    2.2. Market Definition / Scope / Limitations

3. Market Background

    3.1. Market Dynamics

        3.1.1. Drivers

        3.1.2. Restraints

        3.1.3. Opportunity

        3.1.4. Trends

    3.2. Scenario Forecast

        3.2.1. Demand in Optimistic Scenario

        3.2.2. Demand in Likely Scenario

        3.2.3. Demand in Conservative Scenario

    3.3. Product launches & Recent Developments

    3.4. Product Life Cycle Analysis

    3.5. Value Chain Analysis

        3.5.1. Supply Side Participants and their Roles

            3.5.1.1. Producers

            3.5.1.2. Mid-Level Participants (Traders/ Agents/ Brokers)

            3.5.1.3. Wholesalers and Distributors

        3.5.2. % of Operating Margin Analysis

        3.5.3. List of Raw Material Suppliers

        3.5.4. List of Existing and Potential Buyer’s

    3.6. Global Market - Pricing Analysis

        3.6.1. Price Point Assessment by Region

        3.6.2. Price Point Assessment by Product Type

        3.6.3. Price Forecast till 2033

        3.6.4. Factors affecting pricing

    3.7. Forecast Factors - Relevance & Impact

    3.8. PESTLE and Porter’s Analysis

    3.9. Regulatory Landscape

        3.9.1. Packaging & Labelling Regulations

        3.9.2. Certifications and Certifying Agency Overview

        3.9.3. Import/Export Policies

    3.10. Regional Parent Market Outlook

    3.11. Production and Consumption Statistics

    3.12. Import and Export Statistics

    3.13. Consumers Survey Analysis

    3.14. Macro-Economic Factors

    3.15. Product Claims & Nutritional Information scanned by Buyers

4. Global Market Analysis 2018 to 2022 and Forecast, 2023 to 2033

    4.1. Historical Market Size Value (US$ million) & Volume (MT) Analysis, 2018 to 2022

    4.2. Current and Future Market Size Value (US$ million) & Volume (MT) Projections, 2023 to 2033

        4.2.1. Y-o-Y Growth Trend Analysis

        4.2.2. Absolute $ Opportunity Analysis

5. Global Market Analysis 2018 to 2022 and Forecast 2023 to 2033, By Structure

    5.1. Introduction / Key Findings

    5.2. Historical Market Size Value (US$ million) & Volume (MT) Analysis By Structure, 2018 to 2022

    5.3. Current and Future Market Size Value (US$ million) & Volume (MT) Analysis and Forecast By Structure, 2023 to 2033

        5.3.1. Single door

        5.3.2. Double door

    5.4. Y-o-Y Growth Trend Analysis By Structure, 2018 to 2022

    5.5. Absolute $ Opportunity Analysis By Structure, 2023 to 2033

6. Global Market Analysis 2018 to 2022 and Forecast 2023 to 2033, By Chilling capacity

    6.1. Introduction / Key Findings

    6.2. Historical Market Size Value (US$ million) & Volume (MT) Analysis By Chilling capacity, 2018 to 2022

    6.3. Current and Future Market Size Value (US$ million) & Volume (MT) Analysis and Forecast By Chilling capacity, 2023 to 2033

        6.3.1. 22 kgs in 90 mins

        6.3.2. 18 kgs in 90 mins

        6.3.3. 8 kgs in 90 mins

    6.4. Y-o-Y Growth Trend Analysis By Chilling capacity, 2018 to 2022

    6.5. Absolute $ Opportunity Analysis By Chilling capacity, 2023 to 2033

7. Global Market Analysis 2018 to 2022 and Forecast 2023 to 2033, By Freezing capacity

    7.1. Introduction / Key Findings

    7.2. Historical Market Size Value (US$ million) & Volume (MT) Analysis By Freezing capacity, 2018 to 2022

    7.3. Current and Future Market Size Value (US$ million) & Volume (MT) Analysis and Forecast By Freezing capacity, 2023 to 2033

        7.3.1. 12 kgs in 240 mins

        7.3.2. 5 kgs in 240 mins

    7.4. Y-o-Y Growth Trend Analysis By Freezing capacity, 2018 to 2022

    7.5. Absolute $ Opportunity Analysis By Freezing capacity, 2023 to 2033

8. Global Market Analysis 2018 to 2022 and Forecast 2023 to 2033, By End-user

    8.1. Introduction / Key Findings

    8.2. Historical Market Size Value (US$ million) & Volume (MT) Analysis By End-user, 2018 to 2022

    8.3. Current and Future Market Size Value (US$ million) & Volume (MT) Analysis and Forecast By End-user, 2023 to 2033

        8.3.1. Bakery

        8.3.2. Restaurants

        8.3.3. Confectionery

        8.3.4. Household

    8.4. Y-o-Y Growth Trend Analysis By End-user, 2018 to 2022

    8.5. Absolute $ Opportunity Analysis By End-user, 2023 to 2033

9. Global Market Analysis 2018 to 2022 and Forecast 2023 to 2033, By Region

    9.1. Introduction

    9.2. Historical Market Size Value (US$ million) & Volume (MT) Analysis By Region, 2018 to 2022

    9.3. Current Market Size Value (US$ million) & Volume (MT) Analysis and Forecast By Region, 2023 to 2033

        9.3.1. North America

        9.3.2. Latin America

        9.3.3. Europe

        9.3.4. East Asia

        9.3.5. South Asia

        9.3.6. Oceania

        9.3.7. Middle East and Africa (MEA)

    9.4. Market Attractiveness Analysis By Region

10. North America Market Analysis 2018 to 2022 and Forecast 2023 to 2033, By Country

    10.1. Historical Market Size Value (US$ million) & Volume (MT) Trend Analysis By Market Taxonomy, 2018 to 2022

    10.2. Market Size Value (US$ million) & Volume (MT) Forecast By Market Taxonomy, 2023 to 2033

        10.2.1. By Country

            10.2.1.1. The USA

            10.2.1.2. Canada

        10.2.2. By Structure

        10.2.3. By Chilling capacity

        10.2.4. By Freezing capacity

        10.2.5. By End-user

    10.3. Market Attractiveness Analysis

        10.3.1. By Country

        10.3.2. By Structure

        10.3.3. By Chilling capacity

        10.3.4. By Freezing capacity

        10.3.5. By End-user

    10.4. Key Takeaways

11. Latin America Market Analysis 2018 to 2022 and Forecast 2023 to 2033, By Country

    11.1. Historical Market Size Value (US$ million) & Volume (MT) Trend Analysis By Market Taxonomy, 2018 to 2022

    11.2. Market Size Value (US$ million) & Volume (MT) Forecast By Market Taxonomy, 2023 to 2033

        11.2.1. By Country

            11.2.1.1. Brazil

            11.2.1.2. Mexico

            11.2.1.3. Argentina

            11.2.1.4. Chile

            11.2.1.5. Peru

            11.2.1.6. Rest of Latin America

        11.2.2. By Structure

        11.2.3. By Chilling capacity

        11.2.4. By Freezing capacity

        11.2.5. By End-user

    11.3. Market Attractiveness Analysis

        11.3.1. By Country

        11.3.2. By Structure

        11.3.3. By Chilling capacity

        11.3.4. By Freezing capacity

        11.3.5. By End-user

    11.4. Key Takeaways

12. Europe Market Analysis 2018 to 2022 and Forecast 2023 to 2033, By Country

    12.1. Historical Market Size Value (US$ million) & Volume (MT) Trend Analysis By Market Taxonomy, 2018 to 2022

    12.2. Market Size Value (US$ million) & Volume (MT) Forecast By Market Taxonomy, 2023 to 2033

        12.2.1. By Country

            12.2.1.1. Germany

            12.2.1.2. Italy

            12.2.1.3. France

            12.2.1.4. The United Kingdom

            12.2.1.5. Spain

            12.2.1.6. Russia

            12.2.1.7. BENELUX

            12.2.1.8. Poland

            12.2.1.9. Nordic Countries

            12.2.1.10. Rest of Europe

        12.2.2. By Structure

        12.2.3. By Chilling capacity

        12.2.4. By Freezing capacity

        12.2.5. By End-user

    12.3. Market Attractiveness Analysis

        12.3.1. By Country

        12.3.2. By Structure

        12.3.3. By Chilling capacity

        12.3.4. By Freezing capacity

        12.3.5. By End-user

    12.4. Key Takeaways

13. East Asia Market Analysis 2018 to 2022 and Forecast 2023 to 2033, By Country

    13.1. Historical Market Size Value (US$ million) & Volume (MT) Trend Analysis By Market Taxonomy, 2018 to 2022

    13.2. Market Size Value (US$ million) & Volume (MT) Forecast By Market Taxonomy, 2023 to 2033

        13.2.1. By Country

            13.2.1.1. China

            13.2.1.2. Japan

            13.2.1.3. South Korea

        13.2.2. By Structure

        13.2.3. By Chilling capacity

        13.2.4. By Freezing capacity

        13.2.5. By End-user

    13.3. Market Attractiveness Analysis

        13.3.1. By Country

        13.3.2. By Structure

        13.3.3. By Chilling capacity

        13.3.4. By Freezing capacity

        13.3.5. By End-user

    13.4. Key Takeaways

14. South Asia Market Analysis 2018 to 2022 and Forecast 2023 to 2033, By Country

    14.1. Historical Market Size Value (US$ million) & Volume (MT) Trend Analysis By Market Taxonomy, 2018 to 2022

    14.2. Market Size Value (US$ million) & Volume (MT) Forecast By Market Taxonomy, 2023 to 2033

        14.2.1. By Country

            14.2.1.1. India

            14.2.1.2. Thailand

            14.2.1.3. Malaysia

            14.2.1.4. Indonesia

            14.2.1.5. Singapore

            14.2.1.6. Rest of South Asia

        14.2.2. By Structure

        14.2.3. By Chilling capacity

        14.2.4. By Freezing capacity

        14.2.5. By End-user

    14.3. Market Attractiveness Analysis

        14.3.1. By Country

        14.3.2. By Structure

        14.3.3. By Chilling capacity

        14.3.4. By Freezing capacity

        14.3.5. By End-user

    14.4. Key Takeaways

15. Oceania Market Analysis 2018 to 2022 and Forecast 2023 to 2033, By Country

    15.1. Historical Market Size Value (US$ million) & Volume (MT) Trend Analysis By Market Taxonomy, 2018 to 2022

    15.2. Market Size Value (US$ million) & Volume (MT) Forecast By Market Taxonomy, 2023 to 2033

        15.2.1. By Country

            15.2.1.1. Australia

            15.2.1.2. New Zealand

        15.2.2. By Structure

        15.2.3. By Chilling capacity

        15.2.4. By Freezing capacity

        15.2.5. By End-user

    15.3. Market Attractiveness Analysis

        15.3.1. By Country

        15.3.2. By Structure

        15.3.3. By Chilling capacity

        15.3.4. By Freezing capacity

        15.3.5. By End-user

    15.4. Key Takeaways

16. MEA Market Analysis 2018 to 2022 and Forecast 2023 to 2033, By Country

    16.1. Historical Market Size Value (US$ million) & Volume (MT) Trend Analysis By Market Taxonomy, 2018 to 2022

    16.2. Market Size Value (US$ million) & Volume (MT) Forecast By Market Taxonomy, 2023 to 2033

        16.2.1. By Country

            16.2.1.1. GCC Countries

            16.2.1.2. South Africa

            16.2.1.3. Central Africa

            16.2.1.4. North Africa

        16.2.2. By Structure

        16.2.3. By Chilling capacity

        16.2.4. By Freezing capacity

        16.2.5. By End-user

    16.3. Market Attractiveness Analysis

        16.3.1. By Country

        16.3.2. By Structure

        16.3.3. By Chilling capacity

        16.3.4. By Freezing capacity

        16.3.5. By End-user

    16.4. Key Takeaways

17. Key Countries Market Analysis

    17.1. The USA

        17.1.1. Pricing Analysis

        17.1.2. Market Share Analysis, 2022

            17.1.2.1. By Structure

            17.1.2.2. By Chilling capacity

            17.1.2.3. By Freezing capacity

            17.1.2.4. By End-user

    17.2. Canada

        17.2.1. Pricing Analysis

        17.2.2. Market Share Analysis, 2022

            17.2.2.1. By Structure

            17.2.2.2. By Chilling capacity

            17.2.2.3. By Freezing capacity

            17.2.2.4. By End-user

    17.3. Brazil

        17.3.1. Pricing Analysis

        17.3.2. Market Share Analysis, 2022

            17.3.2.1. By Structure

            17.3.2.2. By Chilling capacity

            17.3.2.3. By Freezing capacity

            17.3.2.4. By End-user

    17.4. Mexico

        17.4.1. Pricing Analysis

        17.4.2. Market Share Analysis, 2022

            17.4.2.1. By Structure

            17.4.2.2. By Chilling capacity

            17.4.2.3. By Freezing capacity

            17.4.2.4. By End-user

    17.5. Argentina

        17.5.1. Pricing Analysis

        17.5.2. Market Share Analysis, 2022

            17.5.2.1. By Structure

            17.5.2.2. By Chilling capacity

            17.5.2.3. By Freezing capacity

            17.5.2.4. By End-user

    17.6. Chile

        17.6.1. Pricing Analysis

        17.6.2. Market Share Analysis, 2022

            17.6.2.1. By Structure

            17.6.2.2. By Chilling capacity

            17.6.2.3. By Freezing capacity

            17.6.2.4. By End-user

    17.7. Peru

        17.7.1. Pricing Analysis

        17.7.2. Market Share Analysis, 2022

            17.7.2.1. By Structure

            17.7.2.2. By Chilling capacity

            17.7.2.3. By Freezing capacity

            17.7.2.4. By End-user

    17.8. Germany

        17.8.1. Pricing Analysis

        17.8.2. Market Share Analysis, 2022

            17.8.2.1. By Structure

            17.8.2.2. By Chilling capacity

            17.8.2.3. By Freezing capacity

            17.8.2.4. By End-user

    17.9. Italy

        17.9.1. Pricing Analysis

        17.9.2. Market Share Analysis, 2022

            17.9.2.1. By Structure

            17.9.2.2. By Chilling capacity

            17.9.2.3. By Freezing capacity

            17.9.2.4. By End-user

    17.10. France

        17.10.1. Pricing Analysis

        17.10.2. Market Share Analysis, 2022

            17.10.2.1. By Structure

            17.10.2.2. By Chilling capacity

            17.10.2.3. By Freezing capacity

            17.10.2.4. By End-user

    17.11. Spain

        17.11.1. Pricing Analysis

        17.11.2. Market Share Analysis, 2022

            17.11.2.1. By Structure

            17.11.2.2. By Chilling capacity

            17.11.2.3. By Freezing capacity

            17.11.2.4. By End-user

    17.12. The United Kingdom

        17.12.1. Pricing Analysis

        17.12.2. Market Share Analysis, 2022

            17.12.2.1. By Structure

            17.12.2.2. By Chilling capacity

            17.12.2.3. By Freezing capacity

            17.12.2.4. By End-user

    17.13. Russia

        17.13.1. Pricing Analysis

        17.13.2. Market Share Analysis, 2022

            17.13.2.1. By Structure

            17.13.2.2. By Chilling capacity

            17.13.2.3. By Freezing capacity

            17.13.2.4. By End-user

    17.14. Poland

        17.14.1. Pricing Analysis

        17.14.2. Market Share Analysis, 2022

            17.14.2.1. By Structure

            17.14.2.2. By Chilling capacity

            17.14.2.3. By Freezing capacity

            17.14.2.4. By End-user

    17.15. BENELUX

        17.15.1. Pricing Analysis

        17.15.2. Market Share Analysis, 2022

            17.15.2.1. By Structure

            17.15.2.2. By Chilling capacity

            17.15.2.3. By Freezing capacity

            17.15.2.4. By End-user

    17.16. Nordic Countries

        17.16.1. Pricing Analysis

        17.16.2. Market Share Analysis, 2022

            17.16.2.1. By Structure

            17.16.2.2. By Chilling capacity

            17.16.2.3. By Freezing capacity

            17.16.2.4. By End-user

    17.17. China

        17.17.1. Pricing Analysis

        17.17.2. Market Share Analysis, 2022

            17.17.2.1. By Structure

            17.17.2.2. By Chilling capacity

            17.17.2.3. By Freezing capacity

            17.17.2.4. By End-user

    17.18. Japan

        17.18.1. Pricing Analysis

        17.18.2. Market Share Analysis, 2022

            17.18.2.1. By Structure

            17.18.2.2. By Chilling capacity

            17.18.2.3. By Freezing capacity

            17.18.2.4. By End-user

    17.19. South Korea

        17.19.1. Pricing Analysis

        17.19.2. Market Share Analysis, 2022

            17.19.2.1. By Structure

            17.19.2.2. By Chilling capacity

            17.19.2.3. By Freezing capacity

            17.19.2.4. By End-user

    17.20. India

        17.20.1. Pricing Analysis

        17.20.2. Market Share Analysis, 2022

            17.20.2.1. By Structure

            17.20.2.2. By Chilling capacity

            17.20.2.3. By Freezing capacity

            17.20.2.4. By End-user

    17.21. Thailand

        17.21.1. Pricing Analysis

        17.21.2. Market Share Analysis, 2022

            17.21.2.1. By Structure

            17.21.2.2. By Chilling capacity

            17.21.2.3. By Freezing capacity

            17.21.2.4. By End-user

    17.22. Indonesia

        17.22.1. Pricing Analysis

        17.22.2. Market Share Analysis, 2022

            17.22.2.1. By Structure

            17.22.2.2. By Chilling capacity

            17.22.2.3. By Freezing capacity

            17.22.2.4. By End-user

    17.23. Malaysia

        17.23.1. Pricing Analysis

        17.23.2. Market Share Analysis, 2022

            17.23.2.1. By Structure

            17.23.2.2. By Chilling capacity

            17.23.2.3. By Freezing capacity

            17.23.2.4. By End-user

    17.24. Singapore

        17.24.1. Pricing Analysis

        17.24.2. Market Share Analysis, 2022

            17.24.2.1. By Structure

            17.24.2.2. By Chilling capacity

            17.24.2.3. By Freezing capacity

            17.24.2.4. By End-user

    17.25. Australia

        17.25.1. Pricing Analysis

        17.25.2. Market Share Analysis, 2022

            17.25.2.1. By Structure

            17.25.2.2. By Chilling capacity

            17.25.2.3. By Freezing capacity

            17.25.2.4. By End-user

    17.26. New Zealand

        17.26.1. Pricing Analysis

        17.26.2. Market Share Analysis, 2022

            17.26.2.1. By Structure

            17.26.2.2. By Chilling capacity

            17.26.2.3. By Freezing capacity

            17.26.2.4. By End-user

    17.27. GCC Countries

        17.27.1. Pricing Analysis

        17.27.2. Market Share Analysis, 2022

            17.27.2.1. By Structure

            17.27.2.2. By Chilling capacity

            17.27.2.3. By Freezing capacity

            17.27.2.4. By End-user

    17.28. South Africa

        17.28.1. Pricing Analysis

        17.28.2. Market Share Analysis, 2022

            17.28.2.1. By Structure

            17.28.2.2. By Chilling capacity

            17.28.2.3. By Freezing capacity

            17.28.2.4. By End-user

    17.29. North Africa

        17.29.1. Pricing Analysis

        17.29.2. Market Share Analysis, 2022

            17.29.2.1. By Structure

            17.29.2.2. By Chilling capacity

            17.29.2.3. By Freezing capacity

            17.29.2.4. By End-user

    17.30. Central Africa

        17.30.1. Pricing Analysis

        17.30.2. Market Share Analysis, 2022

            17.30.2.1. By Structure

            17.30.2.2. By Chilling capacity

            17.30.2.3. By Freezing capacity

            17.30.2.4. By End-user

18. Market Structure Analysis

    18.1. Competition Dashboard

    18.2. Competition Benchmarking

    18.3. Market Share Analysis of Top Players

        18.3.1. By Regional

        18.3.2. By Structure

        18.3.3. By Chilling capacity

        18.3.4. By Freezing capacity

        18.3.5. By End-user

19. Competition Analysis

    19.1. Competition Deep Dive

        19.1.1. Ubasko Appliances

            19.1.1.1. Overview

            19.1.1.2. Product Portfolio

            19.1.1.3. Profitability by Market Segments (Structure/Chilling capacity/Freezing capacity/End-user/Region)

            19.1.1.4. Sales Footprint

            19.1.1.5. Strategy Overview

                19.1.1.5.1. Marketing Strategy

                19.1.1.5.2. Product Strategy

                19.1.1.5.3. Channel Strategy

        19.1.2. Catering Hygiene Specialists

            19.1.2.1. Overview

            19.1.2.2. Product Portfolio

            19.1.2.3. Profitability by Market Segments (Structure/Chilling capacity/Freezing capacity/End-user/Region)

            19.1.2.4. Sales Footprint

            19.1.2.5. Strategy Overview

                19.1.2.5.1. Marketing Strategy

                19.1.2.5.2. Product Strategy

                19.1.2.5.3. Channel Strategy

        19.1.3. Polar Refrigeration

            19.1.3.1. Overview

            19.1.3.2. Product Portfolio

            19.1.3.3. Profitability by Market Segments (Structure/Chilling capacity/Freezing capacity/End-user/Region)

            19.1.3.4. Sales Footprint

            19.1.3.5. Strategy Overview

                19.1.3.5.1. Marketing Strategy

                19.1.3.5.2. Product Strategy

                19.1.3.5.3. Channel Strategy

        19.1.4. Williams Refrigeration

            19.1.4.1. Overview

            19.1.4.2. Product Portfolio

            19.1.4.3. Profitability by Market Segments (Structure/Chilling capacity/Freezing capacity/End-user/Region)

            19.1.4.4. Sales Footprint

            19.1.4.5. Strategy Overview

                19.1.4.5.1. Marketing Strategy

                19.1.4.5.2. Product Strategy

                19.1.4.5.3. Channel Strategy

        19.1.5. Chef AAA

            19.1.5.1. Overview

            19.1.5.2. Product Portfolio

            19.1.5.3. Profitability by Market Segments (Structure/Chilling capacity/Freezing capacity/End-user/Region)

            19.1.5.4. Sales Footprint

            19.1.5.5. Strategy Overview

                19.1.5.5.1. Marketing Strategy

                19.1.5.5.2. Product Strategy

                19.1.5.5.3. Channel Strategy

        19.1.6. Smeg

            19.1.6.1. Overview

            19.1.6.2. Product Portfolio

            19.1.6.3. Profitability by Market Segments (Structure/Chilling capacity/Freezing capacity/End-user/Region)

            19.1.6.4. Sales Footprint

            19.1.6.5. Strategy Overview

                19.1.6.5.1. Marketing Strategy

                19.1.6.5.2. Product Strategy

                19.1.6.5.3. Channel Strategy

        19.1.7. Danby

            19.1.7.1. Overview

            19.1.7.2. Product Portfolio

            19.1.7.3. Profitability by Market Segments (Structure/Chilling capacity/Freezing capacity/End-user/Region)

            19.1.7.4. Sales Footprint

            19.1.7.5. Strategy Overview

                19.1.7.5.1. Marketing Strategy

                19.1.7.5.2. Product Strategy

                19.1.7.5.3. Channel Strategy

20. Assumptions & Acronyms Used

21. Research Methodology

Explore Process Automation Insights

View Reports
Future Market Insights

Countertop Blast Chiller Market