North America Hardware Asset Management Market Size and Share Forecast Outlook From 2025 to 2035

The hardware asset management industry in North America is experiencing strong growth driven by the expansion of digital infrastructure, increasing IT spending, and the growing importance of asset lifecycle optimization. Organizations are focusing on managing hardware assets more efficiently to enhance productivity, reduce operational costs, and ensure compliance with data security regulations.

The integration of automation, cloud-based tracking, and analytics tools is transforming traditional asset management processes, enabling real-time visibility and predictive maintenance. Enterprises across sectors such as BFSI, IT, healthcare, and manufacturing are adopting hardware asset management solutions to address challenges related to equipment tracking and depreciation management.

The future outlook remains positive, supported by growing demand for centralized asset control and sustainability initiatives promoting hardware recycling and reuse The market’s growth rationale is reinforced by rising remote work adoption, hybrid IT infrastructure expansion, and the need for enhanced governance frameworks, positioning North America as a leading region for technological and operational maturity in asset management practices.
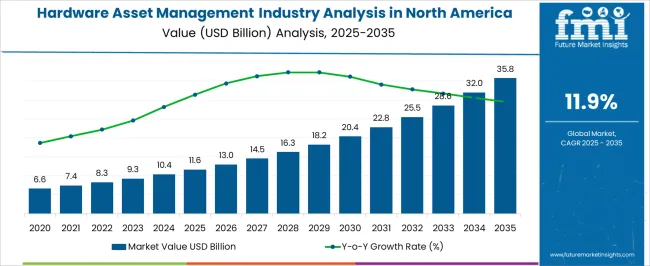
Quick Stats for Hardware Asset Management Industry Analysis in North America

  • Hardware Asset Management Industry Analysis in North America Industry Value (2025): USD 11.6 billion
  • Hardware Asset Management Industry Analysis in North America Forecast Value (2035): USD 35.8 billion
  • Hardware Asset Management Industry Analysis in North America Forecast CAGR: 11.9%
  • Leading Segment in Hardware Asset Management Industry Analysis in North America in 2025: Software (55.4%)
  • Key Growth Region in Hardware Asset Management Industry Analysis in North America: North America, Asia-Pacific, Europe
  • Top Key Players in Hardware Asset Management Industry Analysis in North America: Dell, Microsoft Azure, IBM Cloud, Oracle, HP, Broadcom, BMC Software, Service Now, Flexera Software, Ivanti, Solar Winds, Freshworks Inc., Manage Engine, Asset Sonar, SyAM Software

Hardware Asset Management Industry Analysis In North America Market Value Analysis

Metric Value
Hardware Asset Management Industry Analysis in North America Estimated Value in (2025 E) USD 11.6 billion
Hardware Asset Management Industry Analysis in North America Forecast Value in (2035 F) USD 35.8 billion
Forecast CAGR (2025 to 2035) 11.9%

Segmental Analysis

The market is segmented by Solution, Asset Type, Enterprise Size, and Industry and region. By Solution, the market is divided into Software and Services. In terms of Asset Type, the market is classified into Laptops, Desktops/PCs, Routers, Storage Drives, Workstations, Servers, and Other IT Hardware Assets. Based on Enterprise Size, the market is segmented into Very Large Enterprises (1,000+ employees), Small Offices (1 to 9 employees), Small Enterprises (10 to 99 employees), Medium-Sized Enterprise (100 to 499 employees), and Large Enterprises (500 to 999 employees). By Industry, the market is divided into Services, Finance, Manufacturing & Resources, Distribution Services, Public Sector, and Infrastructure. Regionally, the market is classified into North America, Latin America, Western Europe, Eastern Europe, Balkan & Baltic Countries, Russia & Belarus, Central Asia, East Asia, South Asia & Pacific, and the Middle East & Africa.
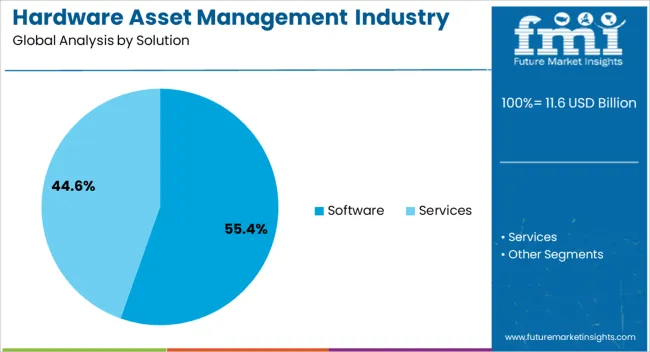
Insights into the Solution Segment

Hardware Asset Management Industry Analysis In North America Analysis By Solution

The software segment, accounting for 55.40% of the solution category, has emerged as the leading offering due to its critical role in automating inventory tracking, maintenance scheduling, and compliance reporting. Its adoption has been strengthened by the growing need for centralized data management and real-time visibility into asset performance.

Enterprises are increasingly integrating AI-driven and cloud-based software platforms to enhance operational efficiency and minimize downtime. The segment’s growth has also been supported by regulatory requirements for asset transparency and the rising trend of digital transformation across large organizations.

Continuous software innovation, including predictive analytics and automated audit functions, is expected to further optimize asset utilization and cost control This has positioned software solutions as the cornerstone of hardware asset management strategies across North American enterprises.
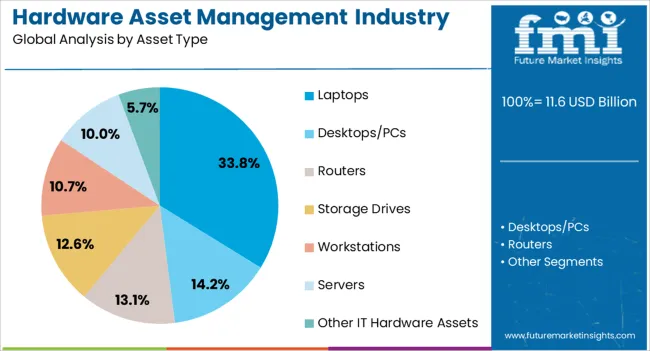
Insights into the Asset Type Segment

Hardware Asset Management Industry Analysis In North America Analysis By Asset Type

The laptops segment, holding 33.80% of the asset type category, dominates due to the widespread use of portable computing devices across corporate, educational, and government sectors. The surge in remote and hybrid work models has accelerated demand for efficient tracking, lifecycle management, and security of laptop assets.

Organizations are increasingly focusing on software-driven monitoring systems that provide visibility into hardware usage, maintenance needs, and end-of-life processes. Asset tagging, device health analytics, and compliance management have become key functionalities driving segment expansion.

Additionally, procurement optimization and device recycling initiatives are contributing to sustainable asset strategies As device fleets continue to grow in number and complexity, demand for efficient laptop management systems is expected to remain robust, supporting long-term growth within this segment.
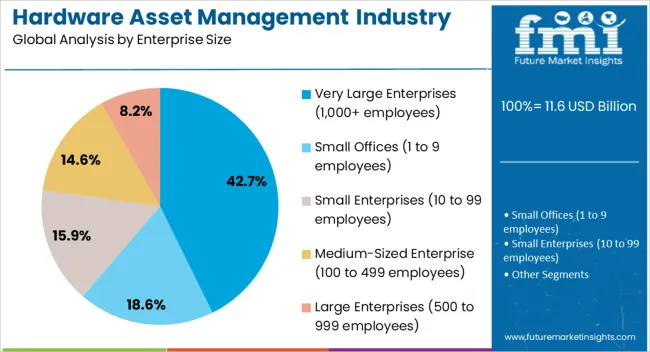
Insights into the Enterprise Size Segment

Hardware Asset Management Industry Analysis In North America Analysis By Enterprise Size

The very large enterprises segment, representing 42.70% of the enterprise size category, leads the market owing to their extensive IT infrastructure and the critical need for managing thousands of interconnected hardware devices across multiple locations. These organizations prioritize advanced asset management platforms capable of integrating with enterprise resource planning (ERP) and IT service management (ITSM) systems.

The scale and complexity of operations have driven higher adoption of automation, data analytics, and artificial intelligence in hardware asset management frameworks. Regulatory compliance, cybersecurity, and cost optimization remain key decision factors influencing deployment.

Continuous investment in modernization and standardization initiatives across global facilities has further solidified the dominance of this segment Ongoing digital transformation and cloud migration strategies are expected to sustain its leadership position and drive continued growth across the North American hardware asset management industry.

Top North America Hardware Asset Management Market Dynamics and Industry Trends

  • Hardware asset management solutions are witnessing high demand across North America. This is because these solutions help businesses efficiently and effectively manage their physical IT assets, including computers, servers, networking devices, storage devices, and other equipment throughout their lifecycle.
  • Hardware asset management helps to optimize the use of hardware assets, ensure compliance with licensing and regulatory requirements, enhance security, and maximize the overall value of the IT investment. As a result, demand for hardware asset management solutions in North America is set to grow rapidly.
  • Hardware asset management is a critical component in a mature CDM capability. It identifies devices that are present on the network and compares them with the desired state inventory to determine if they are authorized. Some devices are network-addressable, and others are removable and connected to one or more network-addressable devices, such as USB drives.
  • The ability of hardware asset management solutions to enhance cost control, minimize risks associated with unauthorized or obsolete hardware, and streamline operations to achieve a more agile and responsive IT infrastructure will fuel their adoption in the region.
  • Growing focus on data privacy is driving organizations to implement hardware asset management solutions to safeguard sensitive information and comply with privacy regulations.

Key Drivers Propelling Growth in the Hardware Asset Management (HAM) Industry in North America

  • Growing emphasis on regulatory compliance in North America
  • Increasing spending on hardware asset management solutions to enhance cybersecurity measures and protect sensitive data
  • Reduced overhead cost, leading companies to adopt HAM
  • The trend among companies to utilize BYOD approaches
  • Increasing adoption of remote work
  • The rapid growth of technology necessitates effective hardware asset management strategies to keep pace with advancements and ensure optimal utilization of emerging hardware solutions.
  • Increasing awareness of cost optimization
  • Growing shift towards cloud computing in North America
  • Increasing demand for hardware asset management in North America to ensure alignment with organizational objectives, risk management, and compliance

Challenges for Companies in the North America Hardware Asset Management Industry

  • The fragmentation of solutions makes integration and standardization difficult.
  • Limited budgets hinder the adoption of comprehensive hardware asset management solutions.
  • Incorporating legacy systems into modern hardware asset management frameworks poses challenges.
  • A shortage of skilled professionals proficient in hardware asset management tools and practices creates a barrier for organizations aiming to optimize their asset utilization.
  • Dependency on specific hardware vendors can restrict flexibility and hinder organizations from adopting the most cost-effective and innovative solutions.
  • Lack of accurate information and frequent changes in IT Assets
  • Limited awareness and understanding of HAM solutions among small and medium-sized enterprises.

Strategic Opportunities in the North America Hardware Asset Management Industry

  • Rising demand for efficient IT infrastructure drives opportunities for hardware asset management solutions in North America.
  • Increased emphasis on cybersecurity prompts organizations to invest in robust hardware asset management systems.
  • High cloud adoption creates opportunities for hardware asset management services to optimize resource utilization.
  • The growth of IoT devices amplifies the need for effective hardware asset management in North America.
  • Integration of artificial intelligence and machine learning to enhance the capabilities of hardware asset management tools, creating growth opportunities.
  • The increasing complexity of IT environments creates opportunities for hardware asset management providers to offer streamlined and comprehensive solutions.
  • Transforming hardware management through real-time analytics in asset tracking
  • Revolutionizing asset maintenance with IoT-Powered predictive analytics in HAM solutions.

Latest Trends in the North America Hardware Asset Management Industry

  • Shift towards subscription-based models for hardware asset management services, providing flexibility and cost-effectiveness for businesses.
  • The utilization of blockchain technology for transparent and secure tracking of hardware assets through their lifecycle
  • Adoption of artificial intelligence (AI) and machine learning (ML) technologies
  • Growing cybersecurity concerns and rising trend towards implementing robust security features within hardware asset management solutions to safeguard sensitive data and devices.
  • Integration of Internet of Things (IoT) technologies into hardware asset management systems to enable real-time tracking and monitoring of devices.
  • Growing trend towards cloud-based solutions for efficient and centralized management of hardware assets.

Comparison of Historical vs Future Outlook for the North America Hardware Asset Management Industry

The hardware asset management industry in North America experienced a CAGR of 8.5% from 2020 to 2025. It attained a total valuation of USD 9,356.03 million at the end of 2025.

  • Demand for hardware asset management solutions in North America grew steadily during the historical period due to increased awareness of the importance of efficient asset tracking and the need for cost optimization.
  • Factors such as the rise of remote work, cybersecurity threats, and technological advancements contributed to the adoption of hardware asset management solutions.

Future Forecast for the North America Hardware Asset Management Industry

Over the forecast period, the North America hardware asset management industry is expected to thrive at a CAGR of 11.9%. It will likely reach a valuation of USD 10,380.23 million. Continued digitization of businesses, advancements in IoT and AI technologies, and an increasing focus on data security and compliance are key factors expected to boost the target industry.

Semi-annual Update

Particular Value CAGR
H1 11.7% (2025 to 2035)
H2 12.0% (2025 to 2035)
H1 11.8% (2025 to 2035)
H2 12.2% (2025 to 2035)

Analysis of Top Countries Producing, Formulating, Packaging, Distributing, and Using Hardware Asset Management Solutions in North America

The table section highlights growth projections in leading North America’s countries. The United States is expected to retain its dominance during the assessment period, while Mexico will likely register faster growth.

Countries Projected CAGR (2025 to 2035)
United States 11.1%
Mexico 14.8%
Canada 14.1%

United States to Retain its Dominance in North America through 2035

The United States hardware asset management industry is expected to rise at 11.1% CAGR during the forecast period, reaching a valuation of about USD 23,277.70 million by 2035. This can be attributed to factors like:

  • Expanding technological infrastructure in the nation
  • Rising BYOD (Bring Your Own Device) trends
  • Increasing proliferation of IoT devices
  • Growing cybersecurity concerns
  • Rising adoption of cloud computing
  • Integration of hardware asset management solutions with IT service management (ITSM) platforms
  • Increasing digital transformation initiatives

The United States’ robust industrial infrastructure provides fertile ground for the development and deployment of sophisticated hardware asset management tools. These solutions help industries such as finance, healthcare, manufacturing, and technology to manage hardware assets efficiently and effectively.

Rising need for complying with regulations like HIPAA and GDPR is prompting industries across the United States to employ hardware assessment management solutions. This will likely boost growth of the hardware assessment management industry in the United States through 2035.

High adoption of cloud computing in the United States is leading to a surge in the number of IT assets that businesses need to manage. This is expected to drive demand for efficient and scalable hardware management solutions during the forecast period.

Industries in the United States demand versatile and scalable hardware asset management solutions. As a result, top companies in the nation are constantly innovating to offer novel solutions. This will likely improve the United States hardware asset management industry share.

Rising Focus on Cost Optimization and Efficiency Driving Demand in Mexico

The hardware asset management industry size in Mexico is expected to reach USD 3,270.25 million in 2035. Overall demand for hardware asset management solutions in Mexico will likely rise at an impressive CAGR of 14.8% during the forecast period. This is due to factors like:

  • Growing awareness of the importance of efficient asset tracking
  • Increasing need for robust IT asset monitoring and management
  • Rising emphasis on cost optimization and efficiency
  • Increasing adoption of cloud computing and IoT devices
  • Surging popularity of cloud-based hardware asset management solutions
  • Rising demand for robust hardware asset management solutions to manage the large and complex hardware infrastructure in thriving manufacturing sector

As businesses in Mexico recognize the need to track and manage hardware assets, the demand for advanced asset management solutions increases. This increase in demand can be attributed to the growing understanding that effective asset tracking not only increases operational efficiency but also contributes to cost efficiency and safety.

Hardware asset management solutions help businesses across Mexico optimize hardware utilization, extend the life of assets, and reduce downtime. This will continue to propel their demand amid rising emphasis on cost reduction and enhanced efficiency.

Hardware Asset Management Industry Analysis by Top Investment Segments

The section below shows the software segment dominating the hardware asset management industry across North America. It is set to expand at 10.3% CAGR through 2035. Based on enterprise size, the medium-sized enterprise segment is estimated to progress at a CAGR of 14.7%. By industry, the finance segment will likely exhibit a higher CAGR of 15.1% over the forecast period.

Software Segment Dominates the Hardware Asset Management Industry

Growth Outlook by Solution

Solution Value CAGR
Software 10.3%
Services 13.6%

Based on solution, the software segment is set to dominate the North America industry, holding a share of 55.4% in 2025. This is attributable to increasing reliance on software-based solutions for efficient tracking, monitoring, and management of hardware assets.

Demand for hardware asset management software is anticipated to increase at a CAGR of 10.3% during the assessment period. It will likely total USD 5,750.81 million by the end of 2025.

  • The growing recognition among businesses of the pivotal role that advanced software plays in achieving efficient tracking, monitoring, and management of hardware assets is expected to boost the segment growth.
  • The need for real-time visibility, streamlined operations, and adherence to compliance standards drives the emphasis on software-driven approaches.
  • As organizations prioritize the optimization of hardware asset utilization, the prevalence of software solutions underscores their crucial contribution to enhancing overall operational efficiency in the dynamic landscape of hardware asset management in North America.
  • Software provides advanced functionalities, including centralized management, data analytics, and automated tasks, making them highly popular.
  • The flexibility, scalability, and cost-effectiveness of hardware asset management software will continue to encourage its adoption globally.
  • Another key factor expected to boost the software segment is the rising popularity of cloud-based hardware asset management solutions.

On the other hand, the hardware asset management services segment is expected to expand at a robust CAGR of 13.6% through 2035. This is due to rising demand for managed services and evolving industry requirements.

HAM Solutions Gaining Wider Popularity among Medium-sized Enterprises

Growth Outlook by Enterprise Size

Enterprise Size Value CAGR
Small Offices (1 to 9 employees) 9.3%
Small Enterprises (10 to 99 employees) 13.0%
Medium-sized Enterprise (100 to 499 employees) 14.7%
Large Enterprises (500 to 999 employees) 11.3%
Very Large Enterprises (1,000+ employees) 10.5%

As per the latest analysis, the medium-sized enterprise (100 to 499 employees) segment is projected to grow at a CAGR of 14.7% during the forecast period. This is due to increasing adoption of advanced asset management solutions by medium-sized enterprises.

  • As medium-sized businesses (SMEs) increasingly prioritize efficiency, cost-effectiveness, and regulatory compliance, the deployment of sophisticated asset management solutions becomes pivotal. These tools offer streamlined processes, real-time visibility, and improved decision-making capabilities, contributing significantly to the growth potential of medium-sized enterprises in North America.
  • Increasing IT complexity in medium-sized enterprises is expected to create a high need for effective asset management.
  • To cater to specific needs of medium-sized enterprises, leading hardware asset management solution companies are developing new solutions that are more affordable and easier to implement.

Financial Institutions Emerging as Leading Users

Growth Outlook by Industry

Industry Value CAGR
Finance 15.1%
Manufacturing & Resources 11.3%
Distribution Services 8.1%
Services 14.0%
Public Sector 5.2%
Infrastructure 6.6%

As per the latest report, the finance industry will likely emerge as the leading end-use industry for hardware asset management solutions, exhibiting a CAGR of 15.1%. This is because financial institutions in North America prioritize advanced asset-tracking tools for operational resilience, security, and compliance in a digital landscape.
  • Financial institutions are placing a heightened emphasis on advanced asset-tracking tools. Recognizing the strategic importance of these tools, they are integral to bolstering operational resilience, fortifying security measures, and ensuring regulatory compliance within the evolving digital landscape. This prioritization underscores the finance sector's commitment to leveraging technology for effective hardware asset management in the pursuit of robust and secure financial operations.
  • Growing focus of financial institutions to comply with strict data security and risk management regulations is expected to fuel adoption of hardware asset management solutions.
  • Rising emphasis on improving operational efficiency and reducing overall costs is another key factor expected to drive demand for hardware asset management solutions in the finance industry.

Competitive Landscape of the North America Hardware Asset Management Market

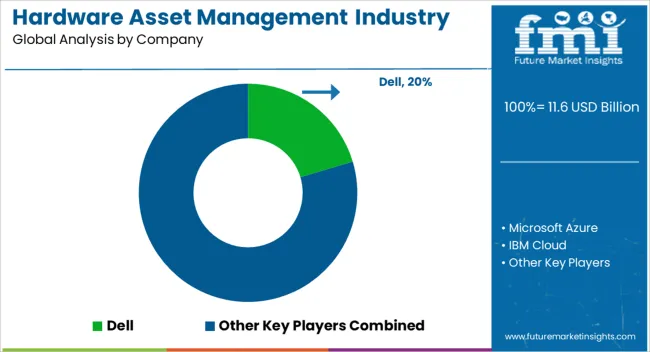
Hardware Asset Management Industry Analysis In North America Analysis By Company

Key players are focusing on providing tailored hardware asset management solutions to meet the specific needs of their clients.

Key Strategies Adopted by the Players

Product Innovation

Key players are investing in research and development to create cutting-edge hardware asset management solutions that offer improved efficiency, security, and scalability. They are continuously launching new software and services to meet the evolving needs of businesses in North America, incorporating technologies like AI, cloud integration and sustainable energy solutions.

Mergers and Acquisitions

Several hardware asset management providers adopt strategies like mergers and acquisitions to expand their customer bases.

Key Developments in the North America Hardware Asset Management Industry

  • In January 2025, IBM launched a new program called IBM Partner Plus, which is designed to provide enhanced support and incentives to its business partners. The program aims to deepen partners' technical expertise, accelerate their time to market, and fuel their growth.
  • In October 2025, Oracle launched a new asset-based service solution for high-tech and manufacturing businesses to help them predict and prevent asset downtime, reduce costs, optimize service efficiency, and enhance the overall customer experience. The solution is part of Oracle Fusion Cloud Applications Suite and is pre-integrated with Oracle Fusion Cloud Supply Chain & Manufacturing and Oracle Field Service.
  • In May 2025, Dell Technologies and NVIDIA collaborated to introduce Project Helix, a solution that enables safe, secure, and personalized generative AI for high-tech and manufacturing businesses. Project Helix is a full-stack solution built on Dell infrastructure and software, using NVIDIA's software stack and accelerator technology. It provides proactive monitoring and maintenance, automated field service, and asset-specific preventative maintenance plans.
  • In July 2025, Broadcom introduced industry-leading cloud technology for enterprise data centers, aiming to bring cloud technologies into enterprise data centers. The company's solutions include data center networking and storage, enterprise, mainframe, and cybersecurity software focused on automation, monitoring, and security.

Scope and Coverage of the North America Hardware Asset Management Market Report

  • Adjacent Study on Asset Management Services Industry, Hardware Asset Tracking System Industry, Hardware Asset Tracking Software Industry and Software Asset Management Market
  • Detailed Analysis of Asset Lifecycle Management Industry
  • Future Prospects of Hardware Inventory Management Industry
  • Scope of Asset Tracking and Management Industry
  • Top Companies in IT Asset Management Industry
  • Growth Prospects for Wireless Asset Management Market in North America
  • North America Enterprise Asset Management Industry Share

Top Segments Studied in the North America Hardware Asset Management Market

By Solution:

  • Software
    • Standalone Hardware Asset Management Software
    • Integrated Hardware Asset Management Software
  • Services
    • Asset Maintenance & Repair Services
    • Asset Tracking & Monitoring
    • Consulting Services
    • Managed Services

By Asset Type:

  • Desktops/PCs
  • Laptops
  • Routers
  • Storage Drives
  • Workstations
  • Servers
  • Other IT Hardware Assets

By Enterprise Size:

  • Small Offices (1 to 9 employees)
  • Small Enterprises (10 to 99 employees)
  • Medium-sized Enterprise (100 to 499 employees)
  • Large Enterprises (500 to 999 employees)
  • Very Large Enterprises (1,000+ employees)

By Industry:

  • Finance
    • Banking
    • Insurance
    • Investment/Securities
  • Manufacturing & Resources
    • Discrete Manufacturing
    • Process Manufacturing
    • Resource industries
    • Agriculture
  • Distribution Services
    • Retail
    • Wholesales
    • Transportation /Logistics Services
    • Warehousing & Storage
    • Shipping
  • Services
    • IT/Professional Services
    • Cloud Services
    • Media, Entertainment & Publishing
    • Travel & Hospitality
    • Legal Services
  • Public Sector
    • Government (State/Central)
    • Education
    • Healthcare
    • Aerospace & Defense
    • Non-profit
  • Infrastructure
    • Telecommunication
    • Data Centers
    • Energy & Utilities
    • Building & Construction

By Country:

  • United States
  • Canada
  • Mexico

Frequently Asked Questions

How big is the hardware asset management industry analysis in north america in 2025?

The global hardware asset management industry analysis in north america is estimated to be valued at USD 11.6 billion in 2025.

What will be the size of hardware asset management industry analysis in north america in 2035?

The market size for the hardware asset management industry analysis in north america is projected to reach USD 35.8 billion by 2035.

How much will be the hardware asset management industry analysis in north america growth between 2025 and 2035?

The hardware asset management industry analysis in north america is expected to grow at a 11.9% CAGR between 2025 and 2035.

What are the key product types in the hardware asset management industry analysis in north america?

The key product types in hardware asset management industry analysis in north america are software, _standalone hardware asset management software, _integrated hardware asset management software, services, _asset maintenance & repair services, _asset tracking & monitoring, _consulting services and _managed services.

Which asset type segment to contribute significant share in the hardware asset management industry analysis in north america in 2025?

In terms of asset type, laptops segment to command 33.8% share in the hardware asset management industry analysis in north america in 2025.

Table of Content

  1. Executive Summary
    • Global Market Outlook
    • Demand-side Trends
    • Supply-side Trends
    • Technology Roadmap Analysis
    • Analysis and Recommendations
  2. Market Overview
    • Market Coverage / Taxonomy
    • Market Definition / Scope / Limitations
  3. Market Background
    • Market Dynamics
      • Drivers
      • Restraints
      • Opportunity
      • Trends
    • Scenario Forecast
      • Demand in Optimistic Scenario
      • Demand in Likely Scenario
      • Demand in Conservative Scenario
    • Opportunity Map Analysis
    • Product Life Cycle Analysis
    • Supply Chain Analysis
    • Investment Feasibility Matrix
    • Value Chain Analysis
    • PESTLE and Porter’s Analysis
    • Regulatory Landscape
    • Regional Parent Market Outlook
    • Production and Consumption Statistics
    • Import and Export Statistics
  4. Global Analysis 2020 to 2024 and Forecast, 2025 to 2035
    • Historical Market Size Value (USD Million) Analysis, 2020 to 2024
    • Current and Future Market Size Value (USD Million) Projections, 2025 to 2035
      • Y-o-Y Growth Trend Analysis
      • Absolute $ Opportunity Analysis
  5. Global Pricing Analysis 2020 to 2024 and Forecast 2025 to 2035
  6. Global Analysis 2020 to 2024 and Forecast 2025 to 2035, By Solution
    • Introduction / Key Findings
    • Historical Market Size Value (USD Million) Analysis By Solution , 2020 to 2024
    • Current and Future Market Size Value (USD Million) Analysis and Forecast By Solution , 2025 to 2035
      • Software
        • Standalone Hardware Asset Management Software
        • Integrated Hardware Asset Management Software
      • Services
        • Asset Maintenance & Repair Services
        • Asset Tracking & Monitoring
        • Consulting Services
        • Managed Services
    • Y-o-Y Growth Trend Analysis By Solution , 2020 to 2024
    • Absolute $ Opportunity Analysis By Solution , 2025 to 2035
  7. Global Analysis 2020 to 2024 and Forecast 2025 to 2035, By Asset Type
    • Introduction / Key Findings
    • Historical Market Size Value (USD Million) Analysis By Asset Type, 2020 to 2024
    • Current and Future Market Size Value (USD Million) Analysis and Forecast By Asset Type, 2025 to 2035
      • Laptops
      • Desktops/PCs
      • Routers
      • Storage Drives
      • Workstations
      • Servers
      • Other IT Hardware Assets
    • Y-o-Y Growth Trend Analysis By Asset Type, 2020 to 2024
    • Absolute $ Opportunity Analysis By Asset Type, 2025 to 2035
  8. Global Analysis 2020 to 2024 and Forecast 2025 to 2035, By Enterprise Size
    • Introduction / Key Findings
    • Historical Market Size Value (USD Million) Analysis By Enterprise Size, 2020 to 2024
    • Current and Future Market Size Value (USD Million) Analysis and Forecast By Enterprise Size, 2025 to 2035
      • Very Large Enterprises (1,000+ employees)
      • Small Offices (1 to 9 employees)
      • Small Enterprises (10 to 99 employees)
      • Medium-Sized Enterprise (100 to 499 employees)
      • Large Enterprises (500 to 999 employees)
    • Y-o-Y Growth Trend Analysis By Enterprise Size, 2020 to 2024
    • Absolute $ Opportunity Analysis By Enterprise Size, 2025 to 2035
  9. Global Analysis 2020 to 2024 and Forecast 2025 to 2035, By Industry
    • Introduction / Key Findings
    • Historical Market Size Value (USD Million) Analysis By Industry, 2020 to 2024
    • Current and Future Market Size Value (USD Million) Analysis and Forecast By Industry, 2025 to 2035
      • Services
        • IT/Professional Services
        • Cloud Services
        • Media, Entertainment & Publishing
        • Travel & Hospitality
        • Legal Services
      • Finance
        • Banking
        • Insurance
        • Investment/Securities
      • Manufacturing & Resources
        • Discrete Manufacturing
        • Process Manufacturing
        • Resource industries
        • Agriculture
      • Distribution Services
        • Retail
        • Wholesales
        • Transportation /Logistics Services
        • Warehousing & Storage
        • Shipping
      • Public Sector
        • Government (State/Central)
        • Education
        • Healthcare
        • Aerospace & Defense
        • Non-Profit
      • Infrastructure
        • Telecommunication
        • Data Centers
        • Energy & Utilities
        • Building & Construction
    • Y-o-Y Growth Trend Analysis By Industry, 2020 to 2024
    • Absolute $ Opportunity Analysis By Industry, 2025 to 2035
  10. Global Analysis 2020 to 2024 and Forecast 2025 to 2035, By Region
    • Introduction
    • Historical Market Size Value (USD Million) Analysis By Region, 2020 to 2024
    • Current Market Size Value (USD Million) Analysis and Forecast By Region, 2025 to 2035
      • North America
      • Latin America
      • Western Europe
      • Eastern Europe
      • East Asia
      • South Asia and Pacific
      • Middle East & Africa
    • Market Attractiveness Analysis By Region
  11. North America Analysis 2020 to 2024 and Forecast 2025 to 2035, By Country
    • Historical Market Size Value (USD Million) Trend Analysis By Market Taxonomy, 2020 to 2024
    • Market Size Value (USD Million) Forecast By Market Taxonomy, 2025 to 2035
      • By Country
        • USA
        • Canada
        • Mexico
      • By Solution
      • By Asset Type
      • By Enterprise Size
      • By Industry
    • Market Attractiveness Analysis
      • By Country
      • By Solution
      • By Asset Type
      • By Enterprise Size
      • By Industry
    • Key Takeaways
  12. Latin America Analysis 2020 to 2024 and Forecast 2025 to 2035, By Country
    • Historical Market Size Value (USD Million) Trend Analysis By Market Taxonomy, 2020 to 2024
    • Market Size Value (USD Million) Forecast By Market Taxonomy, 2025 to 2035
      • By Country
        • Brazil
        • Chile
        • Rest of Latin America
      • By Solution
      • By Asset Type
      • By Enterprise Size
      • By Industry
    • Market Attractiveness Analysis
      • By Country
      • By Solution
      • By Asset Type
      • By Enterprise Size
      • By Industry
    • Key Takeaways
  13. Western Europe Analysis 2020 to 2024 and Forecast 2025 to 2035, By Country
    • Historical Market Size Value (USD Million) Trend Analysis By Market Taxonomy, 2020 to 2024
    • Market Size Value (USD Million) Forecast By Market Taxonomy, 2025 to 2035
      • By Country
        • Germany
        • UK
        • Italy
        • Spain
        • France
        • Nordic
        • BENELUX
        • Rest of Western Europe
      • By Solution
      • By Asset Type
      • By Enterprise Size
      • By Industry
    • Market Attractiveness Analysis
      • By Country
      • By Solution
      • By Asset Type
      • By Enterprise Size
      • By Industry
    • Key Takeaways
  14. Eastern Europe Analysis 2020 to 2024 and Forecast 2025 to 2035, By Country
    • Historical Market Size Value (USD Million) Trend Analysis By Market Taxonomy, 2020 to 2024
    • Market Size Value (USD Million) Forecast By Market Taxonomy, 2025 to 2035
      • By Country
        • Russia
        • Poland
        • Hungary
        • Balkan & Baltic
        • Rest of Eastern Europe
      • By Solution
      • By Asset Type
      • By Enterprise Size
      • By Industry
    • Market Attractiveness Analysis
      • By Country
      • By Solution
      • By Asset Type
      • By Enterprise Size
      • By Industry
    • Key Takeaways
  15. East Asia Analysis 2020 to 2024 and Forecast 2025 to 2035, By Country
    • Historical Market Size Value (USD Million) Trend Analysis By Market Taxonomy, 2020 to 2024
    • Market Size Value (USD Million) Forecast By Market Taxonomy, 2025 to 2035
      • By Country
        • China
        • Japan
        • South Korea
      • By Solution
      • By Asset Type
      • By Enterprise Size
      • By Industry
    • Market Attractiveness Analysis
      • By Country
      • By Solution
      • By Asset Type
      • By Enterprise Size
      • By Industry
    • Key Takeaways
  16. South Asia and Pacific Analysis 2020 to 2024 and Forecast 2025 to 2035, By Country
    • Historical Market Size Value (USD Million) Trend Analysis By Market Taxonomy, 2020 to 2024
    • Market Size Value (USD Million) Forecast By Market Taxonomy, 2025 to 2035
      • By Country
        • India
        • ASEAN
        • Australia & New Zealand
        • Rest of South Asia and Pacific
      • By Solution
      • By Asset Type
      • By Enterprise Size
      • By Industry
    • Market Attractiveness Analysis
      • By Country
      • By Solution
      • By Asset Type
      • By Enterprise Size
      • By Industry
    • Key Takeaways
  17. Middle East & Africa Analysis 2020 to 2024 and Forecast 2025 to 2035, By Country
    • Historical Market Size Value (USD Million) Trend Analysis By Market Taxonomy, 2020 to 2024
    • Market Size Value (USD Million) Forecast By Market Taxonomy, 2025 to 2035
      • By Country
        • Kingdom of Saudi Arabia
        • Other GCC Countries
        • Turkiye
        • South Africa
        • Other African Union
        • Rest of Middle East & Africa
      • By Solution
      • By Asset Type
      • By Enterprise Size
      • By Industry
    • Market Attractiveness Analysis
      • By Country
      • By Solution
      • By Asset Type
      • By Enterprise Size
      • By Industry
    • Key Takeaways
  18. Key Countries Analysis
    • USA
      • Pricing Analysis
      • Market Share Analysis, 2024
        • By Solution
        • By Asset Type
        • By Enterprise Size
        • By Industry
    • Canada
      • Pricing Analysis
      • Market Share Analysis, 2024
        • By Solution
        • By Asset Type
        • By Enterprise Size
        • By Industry
    • Mexico
      • Pricing Analysis
      • Market Share Analysis, 2024
        • By Solution
        • By Asset Type
        • By Enterprise Size
        • By Industry
    • Brazil
      • Pricing Analysis
      • Market Share Analysis, 2024
        • By Solution
        • By Asset Type
        • By Enterprise Size
        • By Industry
    • Chile
      • Pricing Analysis
      • Market Share Analysis, 2024
        • By Solution
        • By Asset Type
        • By Enterprise Size
        • By Industry
    • Germany
      • Pricing Analysis
      • Market Share Analysis, 2024
        • By Solution
        • By Asset Type
        • By Enterprise Size
        • By Industry
    • UK
      • Pricing Analysis
      • Market Share Analysis, 2024
        • By Solution
        • By Asset Type
        • By Enterprise Size
        • By Industry
    • Italy
      • Pricing Analysis
      • Market Share Analysis, 2024
        • By Solution
        • By Asset Type
        • By Enterprise Size
        • By Industry
    • Spain
      • Pricing Analysis
      • Market Share Analysis, 2024
        • By Solution
        • By Asset Type
        • By Enterprise Size
        • By Industry
    • France
      • Pricing Analysis
      • Market Share Analysis, 2024
        • By Solution
        • By Asset Type
        • By Enterprise Size
        • By Industry
    • India
      • Pricing Analysis
      • Market Share Analysis, 2024
        • By Solution
        • By Asset Type
        • By Enterprise Size
        • By Industry
    • ASEAN
      • Pricing Analysis
      • Market Share Analysis, 2024
        • By Solution
        • By Asset Type
        • By Enterprise Size
        • By Industry
    • Australia & New Zealand
      • Pricing Analysis
      • Market Share Analysis, 2024
        • By Solution
        • By Asset Type
        • By Enterprise Size
        • By Industry
    • China
      • Pricing Analysis
      • Market Share Analysis, 2024
        • By Solution
        • By Asset Type
        • By Enterprise Size
        • By Industry
    • Japan
      • Pricing Analysis
      • Market Share Analysis, 2024
        • By Solution
        • By Asset Type
        • By Enterprise Size
        • By Industry
    • South Korea
      • Pricing Analysis
      • Market Share Analysis, 2024
        • By Solution
        • By Asset Type
        • By Enterprise Size
        • By Industry
    • Russia
      • Pricing Analysis
      • Market Share Analysis, 2024
        • By Solution
        • By Asset Type
        • By Enterprise Size
        • By Industry
    • Poland
      • Pricing Analysis
      • Market Share Analysis, 2024
        • By Solution
        • By Asset Type
        • By Enterprise Size
        • By Industry
    • Hungary
      • Pricing Analysis
      • Market Share Analysis, 2024
        • By Solution
        • By Asset Type
        • By Enterprise Size
        • By Industry
    • Kingdom of Saudi Arabia
      • Pricing Analysis
      • Market Share Analysis, 2024
        • By Solution
        • By Asset Type
        • By Enterprise Size
        • By Industry
    • Turkiye
      • Pricing Analysis
      • Market Share Analysis, 2024
        • By Solution
        • By Asset Type
        • By Enterprise Size
        • By Industry
    • South Africa
      • Pricing Analysis
      • Market Share Analysis, 2024
        • By Solution
        • By Asset Type
        • By Enterprise Size
        • By Industry
  19. Market Structure Analysis
    • Competition Dashboard
    • Competition Benchmarking
    • Market Share Analysis of Top Players
      • By Regional
      • By Solution
      • By Asset Type
      • By Enterprise Size
      • By Industry
  20. Competition Analysis
    • Competition Deep Dive
      • Dell
        • Overview
        • Product Portfolio
        • Profitability by Market Segments (Product/Age /Sales Channel/Region)
        • Sales Footprint
        • Strategy Overview
          • Marketing Strategy
          • Product Strategy
          • Channel Strategy
      • Microsoft Azure
      • IBM Cloud
      • Oracle
      • HP
      • Broadcom
      • BMC Software
      • Service Now
      • Flexera Software
      • Ivanti
      • Solar Winds
      • Freshworks Inc.
      • Manage Engine
      • Asset Sonar
      • SyAM Software
  21. Assumptions & Acronyms Used
  22. Research Methodology

List of Tables

  • Table 1: Global Value (USD Million) Forecast by Region, 2020 to 2035
  • Table 2: Global Value (USD Million) Forecast by Solution , 2020 to 2035
  • Table 3: Global Value (USD Million) Forecast by Asset Type, 2020 to 2035
  • Table 4: Global Value (USD Million) Forecast by Enterprise Size, 2020 to 2035
  • Table 5: Global Value (USD Million) Forecast by Industry, 2020 to 2035
  • Table 6: North America Value (USD Million) Forecast by Country, 2020 to 2035
  • Table 7: North America Value (USD Million) Forecast by Solution , 2020 to 2035
  • Table 8: North America Value (USD Million) Forecast by Asset Type, 2020 to 2035
  • Table 9: North America Value (USD Million) Forecast by Enterprise Size, 2020 to 2035
  • Table 10: North America Value (USD Million) Forecast by Industry, 2020 to 2035
  • Table 11: Latin America Value (USD Million) Forecast by Country, 2020 to 2035
  • Table 12: Latin America Value (USD Million) Forecast by Solution , 2020 to 2035
  • Table 13: Latin America Value (USD Million) Forecast by Asset Type, 2020 to 2035
  • Table 14: Latin America Value (USD Million) Forecast by Enterprise Size, 2020 to 2035
  • Table 15: Latin America Value (USD Million) Forecast by Industry, 2020 to 2035
  • Table 16: Western Europe Value (USD Million) Forecast by Country, 2020 to 2035
  • Table 17: Western Europe Value (USD Million) Forecast by Solution , 2020 to 2035
  • Table 18: Western Europe Value (USD Million) Forecast by Asset Type, 2020 to 2035
  • Table 19: Western Europe Value (USD Million) Forecast by Enterprise Size, 2020 to 2035
  • Table 20: Western Europe Value (USD Million) Forecast by Industry, 2020 to 2035
  • Table 21: Eastern Europe Value (USD Million) Forecast by Country, 2020 to 2035
  • Table 22: Eastern Europe Value (USD Million) Forecast by Solution , 2020 to 2035
  • Table 23: Eastern Europe Value (USD Million) Forecast by Asset Type, 2020 to 2035
  • Table 24: Eastern Europe Value (USD Million) Forecast by Enterprise Size, 2020 to 2035
  • Table 25: Eastern Europe Value (USD Million) Forecast by Industry, 2020 to 2035
  • Table 26: East Asia Value (USD Million) Forecast by Country, 2020 to 2035
  • Table 27: East Asia Value (USD Million) Forecast by Solution , 2020 to 2035
  • Table 28: East Asia Value (USD Million) Forecast by Asset Type, 2020 to 2035
  • Table 29: East Asia Value (USD Million) Forecast by Enterprise Size, 2020 to 2035
  • Table 30: East Asia Value (USD Million) Forecast by Industry, 2020 to 2035
  • Table 31: South Asia and Pacific Value (USD Million) Forecast by Country, 2020 to 2035
  • Table 32: South Asia and Pacific Value (USD Million) Forecast by Solution , 2020 to 2035
  • Table 33: South Asia and Pacific Value (USD Million) Forecast by Asset Type, 2020 to 2035
  • Table 34: South Asia and Pacific Value (USD Million) Forecast by Enterprise Size, 2020 to 2035
  • Table 35: South Asia and Pacific Value (USD Million) Forecast by Industry, 2020 to 2035
  • Table 36: Middle East & Africa Value (USD Million) Forecast by Country, 2020 to 2035
  • Table 37: Middle East & Africa Value (USD Million) Forecast by Solution , 2020 to 2035
  • Table 38: Middle East & Africa Value (USD Million) Forecast by Asset Type, 2020 to 2035
  • Table 39: Middle East & Africa Value (USD Million) Forecast by Enterprise Size, 2020 to 2035
  • Table 40: Middle East & Africa Value (USD Million) Forecast by Industry, 2020 to 2035

List of Figures

  • Figure 1: Global Pricing Analysis
  • Figure 2: Global Value (USD Million) Forecast 2020-2035
  • Figure 3: Global Value Share and BPS Analysis by Solution , 2025 and 2035
  • Figure 4: Global Y-o-Y Growth Comparison by Solution , 2025-2035
  • Figure 5: Global Attractiveness Analysis by Solution
  • Figure 6: Global Value Share and BPS Analysis by Asset Type, 2025 and 2035
  • Figure 7: Global Y-o-Y Growth Comparison by Asset Type, 2025-2035
  • Figure 8: Global Attractiveness Analysis by Asset Type
  • Figure 9: Global Value Share and BPS Analysis by Enterprise Size, 2025 and 2035
  • Figure 10: Global Y-o-Y Growth Comparison by Enterprise Size, 2025-2035
  • Figure 11: Global Attractiveness Analysis by Enterprise Size
  • Figure 12: Global Value Share and BPS Analysis by Industry, 2025 and 2035
  • Figure 13: Global Y-o-Y Growth Comparison by Industry, 2025-2035
  • Figure 14: Global Attractiveness Analysis by Industry
  • Figure 15: Global Value (USD Million) Share and BPS Analysis by Region, 2025 and 2035
  • Figure 16: Global Y-o-Y Growth Comparison by Region, 2025-2035
  • Figure 17: Global Attractiveness Analysis by Region
  • Figure 18: North America Incremental Dollar Opportunity, 2025-2035
  • Figure 19: Latin America Incremental Dollar Opportunity, 2025-2035
  • Figure 20: Western Europe Incremental Dollar Opportunity, 2025-2035
  • Figure 21: Eastern Europe Incremental Dollar Opportunity, 2025-2035
  • Figure 22: East Asia Incremental Dollar Opportunity, 2025-2035
  • Figure 23: South Asia and Pacific Incremental Dollar Opportunity, 2025-2035
  • Figure 24: Middle East & Africa Incremental Dollar Opportunity, 2025-2035
  • Figure 25: North America Value Share and BPS Analysis by Country, 2025 and 2035
  • Figure 26: North America Value Share and BPS Analysis by Solution , 2025 and 2035
  • Figure 27: North America Y-o-Y Growth Comparison by Solution , 2025-2035
  • Figure 28: North America Attractiveness Analysis by Solution
  • Figure 29: North America Value Share and BPS Analysis by Asset Type, 2025 and 2035
  • Figure 30: North America Y-o-Y Growth Comparison by Asset Type, 2025-2035
  • Figure 31: North America Attractiveness Analysis by Asset Type
  • Figure 32: North America Value Share and BPS Analysis by Enterprise Size, 2025 and 2035
  • Figure 33: North America Y-o-Y Growth Comparison by Enterprise Size, 2025-2035
  • Figure 34: North America Attractiveness Analysis by Enterprise Size
  • Figure 35: North America Value Share and BPS Analysis by Industry, 2025 and 2035
  • Figure 36: North America Y-o-Y Growth Comparison by Industry, 2025-2035
  • Figure 37: North America Attractiveness Analysis by Industry
  • Figure 38: Latin America Value Share and BPS Analysis by Country, 2025 and 2035
  • Figure 39: Latin America Value Share and BPS Analysis by Solution , 2025 and 2035
  • Figure 40: Latin America Y-o-Y Growth Comparison by Solution , 2025-2035
  • Figure 41: Latin America Attractiveness Analysis by Solution
  • Figure 42: Latin America Value Share and BPS Analysis by Asset Type, 2025 and 2035
  • Figure 43: Latin America Y-o-Y Growth Comparison by Asset Type, 2025-2035
  • Figure 44: Latin America Attractiveness Analysis by Asset Type
  • Figure 45: Latin America Value Share and BPS Analysis by Enterprise Size, 2025 and 2035
  • Figure 46: Latin America Y-o-Y Growth Comparison by Enterprise Size, 2025-2035
  • Figure 47: Latin America Attractiveness Analysis by Enterprise Size
  • Figure 48: Latin America Value Share and BPS Analysis by Industry, 2025 and 2035
  • Figure 49: Latin America Y-o-Y Growth Comparison by Industry, 2025-2035
  • Figure 50: Latin America Attractiveness Analysis by Industry
  • Figure 51: Western Europe Value Share and BPS Analysis by Country, 2025 and 2035
  • Figure 52: Western Europe Value Share and BPS Analysis by Solution , 2025 and 2035
  • Figure 53: Western Europe Y-o-Y Growth Comparison by Solution , 2025-2035
  • Figure 54: Western Europe Attractiveness Analysis by Solution
  • Figure 55: Western Europe Value Share and BPS Analysis by Asset Type, 2025 and 2035
  • Figure 56: Western Europe Y-o-Y Growth Comparison by Asset Type, 2025-2035
  • Figure 57: Western Europe Attractiveness Analysis by Asset Type
  • Figure 58: Western Europe Value Share and BPS Analysis by Enterprise Size, 2025 and 2035
  • Figure 59: Western Europe Y-o-Y Growth Comparison by Enterprise Size, 2025-2035
  • Figure 60: Western Europe Attractiveness Analysis by Enterprise Size
  • Figure 61: Western Europe Value Share and BPS Analysis by Industry, 2025 and 2035
  • Figure 62: Western Europe Y-o-Y Growth Comparison by Industry, 2025-2035
  • Figure 63: Western Europe Attractiveness Analysis by Industry
  • Figure 64: Eastern Europe Value Share and BPS Analysis by Country, 2025 and 2035
  • Figure 65: Eastern Europe Value Share and BPS Analysis by Solution , 2025 and 2035
  • Figure 66: Eastern Europe Y-o-Y Growth Comparison by Solution , 2025-2035
  • Figure 67: Eastern Europe Attractiveness Analysis by Solution
  • Figure 68: Eastern Europe Value Share and BPS Analysis by Asset Type, 2025 and 2035
  • Figure 69: Eastern Europe Y-o-Y Growth Comparison by Asset Type, 2025-2035
  • Figure 70: Eastern Europe Attractiveness Analysis by Asset Type
  • Figure 71: Eastern Europe Value Share and BPS Analysis by Enterprise Size, 2025 and 2035
  • Figure 72: Eastern Europe Y-o-Y Growth Comparison by Enterprise Size, 2025-2035
  • Figure 73: Eastern Europe Attractiveness Analysis by Enterprise Size
  • Figure 74: Eastern Europe Value Share and BPS Analysis by Industry, 2025 and 2035
  • Figure 75: Eastern Europe Y-o-Y Growth Comparison by Industry, 2025-2035
  • Figure 76: Eastern Europe Attractiveness Analysis by Industry
  • Figure 77: East Asia Value Share and BPS Analysis by Country, 2025 and 2035
  • Figure 78: East Asia Value Share and BPS Analysis by Solution , 2025 and 2035
  • Figure 79: East Asia Y-o-Y Growth Comparison by Solution , 2025-2035
  • Figure 80: East Asia Attractiveness Analysis by Solution
  • Figure 81: East Asia Value Share and BPS Analysis by Asset Type, 2025 and 2035
  • Figure 82: East Asia Y-o-Y Growth Comparison by Asset Type, 2025-2035
  • Figure 83: East Asia Attractiveness Analysis by Asset Type
  • Figure 84: East Asia Value Share and BPS Analysis by Enterprise Size, 2025 and 2035
  • Figure 85: East Asia Y-o-Y Growth Comparison by Enterprise Size, 2025-2035
  • Figure 86: East Asia Attractiveness Analysis by Enterprise Size
  • Figure 87: East Asia Value Share and BPS Analysis by Industry, 2025 and 2035
  • Figure 88: East Asia Y-o-Y Growth Comparison by Industry, 2025-2035
  • Figure 89: East Asia Attractiveness Analysis by Industry
  • Figure 90: South Asia and Pacific Value Share and BPS Analysis by Country, 2025 and 2035
  • Figure 91: South Asia and Pacific Value Share and BPS Analysis by Solution , 2025 and 2035
  • Figure 92: South Asia and Pacific Y-o-Y Growth Comparison by Solution , 2025-2035
  • Figure 93: South Asia and Pacific Attractiveness Analysis by Solution
  • Figure 94: South Asia and Pacific Value Share and BPS Analysis by Asset Type, 2025 and 2035
  • Figure 95: South Asia and Pacific Y-o-Y Growth Comparison by Asset Type, 2025-2035
  • Figure 96: South Asia and Pacific Attractiveness Analysis by Asset Type
  • Figure 97: South Asia and Pacific Value Share and BPS Analysis by Enterprise Size, 2025 and 2035
  • Figure 98: South Asia and Pacific Y-o-Y Growth Comparison by Enterprise Size, 2025-2035
  • Figure 99: South Asia and Pacific Attractiveness Analysis by Enterprise Size
  • Figure 100: South Asia and Pacific Value Share and BPS Analysis by Industry, 2025 and 2035
  • Figure 101: South Asia and Pacific Y-o-Y Growth Comparison by Industry, 2025-2035
  • Figure 102: South Asia and Pacific Attractiveness Analysis by Industry
  • Figure 103: Middle East & Africa Value Share and BPS Analysis by Country, 2025 and 2035
  • Figure 104: Middle East & Africa Value Share and BPS Analysis by Solution , 2025 and 2035
  • Figure 105: Middle East & Africa Y-o-Y Growth Comparison by Solution , 2025-2035
  • Figure 106: Middle East & Africa Attractiveness Analysis by Solution
  • Figure 107: Middle East & Africa Value Share and BPS Analysis by Asset Type, 2025 and 2035
  • Figure 108: Middle East & Africa Y-o-Y Growth Comparison by Asset Type, 2025-2035
  • Figure 109: Middle East & Africa Attractiveness Analysis by Asset Type
  • Figure 110: Middle East & Africa Value Share and BPS Analysis by Enterprise Size, 2025 and 2035
  • Figure 111: Middle East & Africa Y-o-Y Growth Comparison by Enterprise Size, 2025-2035
  • Figure 112: Middle East & Africa Attractiveness Analysis by Enterprise Size
  • Figure 113: Middle East & Africa Value Share and BPS Analysis by Industry, 2025 and 2035
  • Figure 114: Middle East & Africa Y-o-Y Growth Comparison by Industry, 2025-2035
  • Figure 115: Middle East & Africa Attractiveness Analysis by Industry
  • Figure 116: Global - Tier Structure Analysis
  • Figure 117: Global - Company Share Analysis
Dashboard
Dashboard
Dashboard
Dashboard
Dashboard
Dashboard

Full Research Suite comprises of:

Market outlook & trends analysis

Market outlook & trends analysis

Interviews & case studies

Interviews & case studies

Strategic recommendations

Strategic recommendations

Vendor profiles & capabilities analysis

Vendor profiles & capabilities analysis

5-year forecasts

5-year forecasts

8 regions and 60+ country-level data splits

8 regions and 60+ country-level data splits

Market segment data splits

Market segment data splits

12 months of continuous data updates

12 months of continuous data updates

DELIVERED AS:

PDF EXCEL ONLINE

Full Research Suite


$5000

$7500

$10000

Buy Report Now
Similar Industry Reports

Similar Industry Reports

Hardware-Assisted Verification Market

Hardware-Assisted Verification Market Size and Share Forecast Outlook 2025 to 2035

Hardware Security Module Market

Hardware Security Module Market Analysis - Size, Share & Forecast 2025 to 2035

Hardware Encryption Market

Hardware Encryption Market

Hardware Asset Management Market

Hardware Asset Management Market Analysis - Size, Share, and Forecast Outlook 2025 to 2035

Door Hardware Market

Door Hardware Market

Gaming Hardware Market

Gaming Hardware Market Analysis by Gaming Platform, Product Type, End-user, and Region Through 2035

Automotive Hardware Market

Automotive Hardware Market Growth - Trends & Forecast 2025 to 2035

Bitcoin Mining Hardware Market

Bitcoin Mining Hardware Market

Data Acquisition Hardware Market

Data Acquisition Hardware Market Size and Share Forecast Outlook 2025 to 2035

Telecom Mounting Hardware Market

Telecom Mounting Hardware Market Size and Share Forecast Outlook 2025 to 2035

Cloud IT Infrastructure Hardware Market

Cloud IT Infrastructure Hardware Market Size and Share Forecast Outlook 2025 to 2035

Asset Tags Market
Asset Tags Market

Asset Tags Market Size and Share Forecast Outlook 2025 to 2035

Asset Financing Platform Market

Asset Financing Platform Market Growth - Trends & Forecast 2025 to 2035

Asset-Based Lending Market

Asset-Based Lending Market Size and Share Forecast Outlook 2025 to 2035

Asset Tags Market Share Analysis

Key Players & Market Share in the Asset Tags Sector

Asset Management System Market

Asset Management System Market

Asset Integrity Management Market

Asset Integrity Management Market Growth - Trends & Forecast 2025 to 2035

Asset Performance Management Market

Asset Performance Management Market Size and Share Forecast Outlook 2025 to 2035

Asset And Liability Management Solutions Market

Asset And Liability Management Solutions Market

IT Asset Disposition Market

IT Asset Disposition Market Forecast and Outlook 2025 to 2035

Future Market Insights

Hardware Asset Management Industry Analysis in North America

Chat With MaRIA

Chat With

MaRIA

Hi There, I am MaRIA, Your Market Research Intelligence Assistant. How may I help you?