Reports

- Global Locations -

Headquarters

Future Market Insights, Inc.

Christiana Corporate, 200
Continental Drive, Suite 401,
Newark, Delaware - 19713,
United States

T: +1-845-579-5705

Americas

Future Market Insights, Inc.

616 Corporate Way, Suite 2-9018,
Valley Cottage, NY 10989, United States

T: +1-347-918-3531

MEA

Future Market Insights

1602-6 Jumeirah Bay X2 Tower, Plot No: JLT-PH2-X2A,
Jumeirah Lakes Towers, Dubai,
United Arab Emirates

Europe

Future Market Insights

3rd Floor, 207 Regent Street,
W1B 3HH London
United Kingdom

T: + 44 (0) 20 8123 9659
D: +44 (0) 20 3287 4268

Asia Pacific

Future Market Insights

IndiaLand Global Tech Park, Unit UG-1, Behind Grand HighStreet, Phase 1, Hinjawadi, MH, Pune – 411057, India

Hardware Asset Management Market Outlook from 2024 to 2034

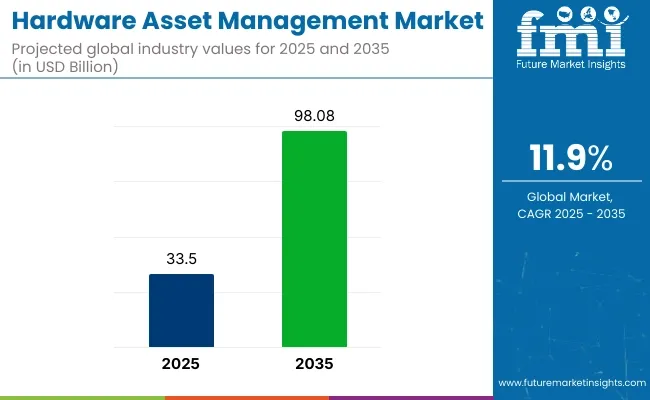
Increasing emphasis on regulatory compliance and surging threat landscape are compelling organizations to invest in hardware asset management (HAM) to enhance cybersecurity measures. Emerging themes indicate an estimation of US$ 30,193.02 million in 2024 for the market.

Thematic analysis of the global hardware asset management market points to a potential CAGR of 11.9% from 2024 to 2034. Looking ahead to 2034, the market is set to attain a valuation of US$ 93,056.19 million. The market recorded a y-o-y growth of 9.9% in 2023.

Global Hardware Asset Management (HAM) Market Analysis

Attributes Details
Hardware Asset Management Market Size, 2023 US$ 9,356.03 million
Estimated Market Value, 2024 US$ 30,193.02 million
Projected Market Size, 2034 US$ 93,056.19 million
Value-based CAGR (2024 to 2034) 11.9%

Don't pay for what you don't need

Customize your report by selecting specific countries or regions and save 30%!

Factors Propelling Demand in the Hardware Inventory Management Market

Reduced overhead costs are pushing companies to adopt HAM. Rapid innovations in technology also necessitate effective HAM strategies to ensure optimal utilization of emerging hardware solutions. Increasing demand for HAM solutions to ensure alignment with organizational objectives, risk management, and compliance would aid growth of hardware asset management market.

Latest Trends in the Hardware Asset Management Market

Rapid shift toward subscription-based models providing flexibility and cost-effectiveness to companies is projected to be a leading trend. Increasing utilization of blockchain technology for transparent and secure tracking of hardware assets through their lifecycle is another key trend.

With the growing threat landscape, there is a notable trend toward implementing robust security features in hardware asset management solutions to safeguard sensitive data and devices. Integration of Internet of Things (IoT) technologies into these solutions is on the rise, enabling real-time tracking and monitoring of devices.

Sudip Saha
Sudip Saha

Principal Consultant

Talk to Analyst

Find your sweet spots for generating winning opportunities in this market.

2019 to 2023 Hardware Asset Management Demand Outlook Compared to 2024 to 2034

From 2019 to 2023, the hardware asset management market experienced a CAGR of 8.5%, reaching a size of US$ 9,356.03 million in 2023. Individual's awareness of the relevance of cost optimization, security issues, and effective asset monitoring has led to a steady rise in the demand for HAM technologies.

Adoption of these solutions was also influenced by factors such as rising shift toward remote work, growing cybersecurity issues, and technological innovations.

Semi-annual Market Update

Particular Value CAGR
H1 11.7% (2023 to 2033)
H2 12.0% (2023 to 2033)
H1 11.8% (2024 to 2034)
H2 12.2% (2024 to 2034)

Comparative View of Adjacent Markets

The section below analyzes three interrelated markets in the technology division. These include the hardware asset management market, gaming hardware market, and hardware security module market. The tables show the hardware security module market is estimated to dominate out of the three markets with a CAGR of 16.5%.

Hardware Asset Management Market:

Attributes Hardware Asset Management Market
Value-based CAGR (2024 to 2034) 11.9%
Key Trends Increasing need for asset control and growing demand for cloud computing worldwide are set to be key trends.
Growth Opportunity Key companies are coming up with novel cloud-based software solutions to offer cost-effective and highly flexible operations.

Gaming Hardware Market:

Attributes Gaming Hardware Market
Value-based CAGR (2024 to 2034) 4.9%
Key Trends Innovations such as augmented reality glasses and 3D gaming systems are projected to be leading trends.
Growth Opportunity Renowned companies are developing cutting-edge gaming consoles with next-generation features to increase sales.

Hardware Security Module Market:

Attributes Hardware Security Module Market
Value-based CAGR (2024 to 2034) 16.5%
Key Trends The ability of hardware security modules to perform several functions, such as cryptographic tasks, authentication, and digital signatures, is set to propel demand.
Growth Opportunity Key players are developing new hardware security modules to help financial institutions strengthen the security of mobile banking apps.

Get the data you need at a Fraction of the cost

Personalize your report by choosing insights you need
and save 40%!

Country-wise Insights

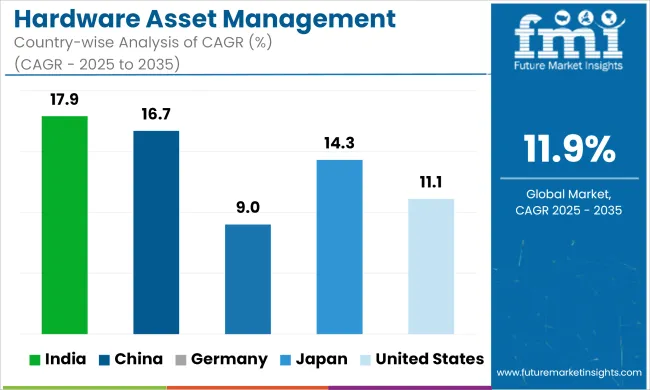
The section below highlights information about leading countries in the global market. The United States and Mexico are the two significant countries in the hardware procurement market. The United States is set to witness a CAGR of 11.1% through 2034, whereas Mexico is anticipated to showcase a 14.8% CAGR through 2034.

Countries Value-based CAGR (2024 to 2034)
United States 11.1%
Mexico 14.8%

Adoption of Complex IT Solutions to Boost Demand in the United States

The United States hardware asset management market is predicted to hold a share of 79.2% in 2034. It is set to reach US$ 23,277.70 million by 2034, surging at a CAGR of 11.1%.

The United States has a well-developed industrial infrastructure. It offers a suitable environment for the deployment and development of innovative HAM solutions. Growing use of complex IT software solutions across technology, manufacturing, healthcare, and finance industries would also augment demand for tools to manage hardware assets efficiently and effectively.

Companies in the United States are gradually moving toward unique asset tracking and management solutions as they seek scalable and diverse HAM systems. The aforementioned factors are set to propel the asset lifecycle management market in the country.

Need to Improve Operational Efficiency Spurs Sales in Mexico

Mexico’s asset tracking and monitoring market is set to reach a valuation of US$ 3,270.25 million by 2034. It is anticipated to rise at a CAGR of 14.8% during the forecast period.

Demand for unique asset management solutions is on the rise across Mexico as key companies recognize the necessity to track and manage physical assets. Growing demand for these solutions can also be attributed to the surging need for operational efficiency, cost savings, and safety. As a result, adopting hardware asset management tools is a significant strategy for enterprises in Mexico.

Category-wise Insights

The section below highlights the top segments of the hardware asset-tracking software market. By solution, the services segment is anticipated to showcase a CAGR of 13.6% through 2034.

Based on enterprise size, the medium-sized enterprise (100 to 499 employees) segment is projected to witness a CAGR of 14.7% from 2024 to 2034. Information about the segments would enable potential clients to invest in the right areas and gain profit.

Market Growth Outlook by Type

Solution Value CAGR (2024 to 2034)
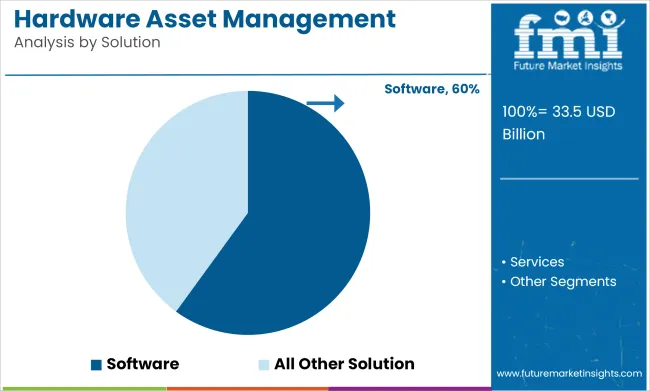
Software 10.3%
Services 13.6%

Software-based Solutions Gain Traction in the Market

Companies are increasingly recognizing the significant role that smart software plays in attaining effective hardware tracking, monitoring, and management. Emphasis on software-driven systems stems from the need for real-time visibility, efficient processes, and adherence to compliance standards.

As organizations prioritize the optimization of hardware asset utilization, the predominance of software solutions highlights their significant contribution to improving operational efficiency. Due to these factors, the software segment held the dominant share of 55.4% in 2023. It is set to witness a 10.3% CAGR through 2034.

Market Growth Outlook by Enterprise Size

Enterprise Size Value CAGR (2024 to 2034)
Small Offices (1 to 9 employees) 9.3%
Small Enterprises (10 to 99 employees) 13.0%
Medium-sized Enterprise (100 to 499 employees) 14.7%
Large Enterprises (500 to 999 employees) 11.3%
Very Large Enterprises (1,000+ employees) 10.5%

Medium-sized Enterprises to Lead the IT Asset Management Industry

Medium-sized enterprises (100 to 499 employees) are projected to rise at a CAGR of 14.7% over the forecast period. These enterprises are set to propel sales of hardware asset management tools.

Medium-sized enterprises are gradually turning toward cloud-based infrastructure to lower the number of manual tasks and enhance efficiency. Cloud-based solutions need regular maintenance and monitoring to ensure cost efficiency and smooth performance. Novel HAM solutions are adopted by these enterprises to provide visibility into these assets to optimize their workflow.

Market Growth Outlook by Industry

Industry Value CAGR (2024 to 2034)
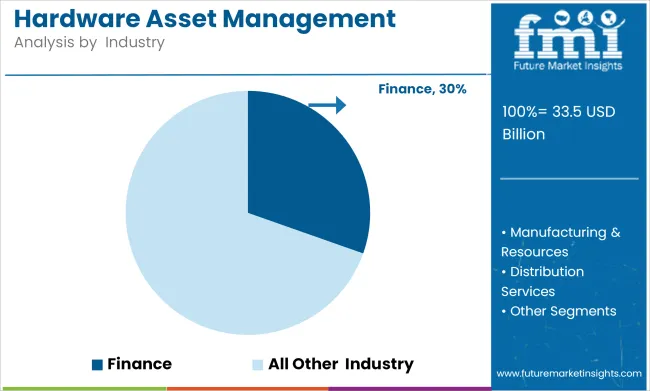
Finance 15.1%
Manufacturing & Resources 11.3%
Distribution Services 8.1%
Services 14.0%
Public Sector 5.2%
Infrastructure 6.6%

Financial Institutions Look for Unique Asset Tracking Solutions

The finance segment is anticipated to surge at a CAGR of 15.1% over the forecast period. Growth is attributed to the rising adoption of IT management software solutions in the banking sector to enhance asset life. As these solutions provide maintenance of assets on a daily basis, organizations can gain real-time information.

Competitive Landscape

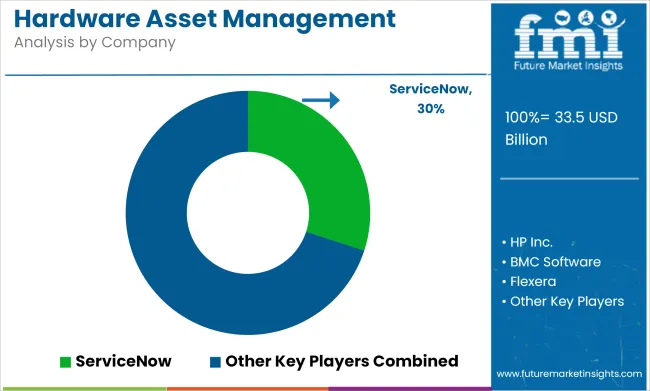
Leading players in the device management market are investing huge sums in research & development activities to discover novel product ranges. They are also focusing on developing new production hubs across emerging countries to generate high shares.

Key Players in the Hardware Asset Management Industry

  • Microsoft Azure
  • IBM Cloud
  • Oracle
  • Dell
  • HP
  • Broadcom
  • BMC Software
  • Service Now
  • Flexera Software
  • Ivanti
  • Solar Winds
  • Freshworks Inc.
  • Manage Engine
  • Asset Sonar
  • SyAM Software

Key Developments in the Hardware Asset Management Market

  • In March 2024, Netherlands-based Workwize introduced its latest IT HAM platform. IT teams will be able to retrieve, manage, and use IT hardware efficiently for their global workforce. The platform also intends to reduce nearly 40% of time by optimizing manual work.
  • In February 2024, Canada-based Geotab Inc. launched its innovative Geotab GO Anywhere asset tracker. The hardware management solution can improve how firms scrutinize and manage their assets across government, construction, transportation, mining, and supply chain industries.
  • In October 2023, PDQ, based in Florida, bagged significant investments from Berkshire Partners. The company wants to strengthen its technology capabilities to broaden its product range. This includes easy-to-use scanning software and IT asset management software solutions.

Key Coverage in Hardware Asset Management Market Report

  • IT Asset Management Market Size, Share, & Industry Growth
  • Market Guide for Hardware Asset Management Tools
  • Impact of Asset Lifecycle Management Strategies
  • Hardware Asset Management Process Flow
  • Emerging Trends in Device Management
  • Software Asset Management as a Service Industry
  • Digital Asset Management ServiceNow
  • Hardware Asset Management Best Practices
  • Hardware Asset Management Lifecycle
  • Asset Tracking Market Size & Share Analysis
  • Best Hardware Asset Management Tools Reviews 2024
  • Asset Management System Market Size
  • Overview of Asset Tracking Solutions
  • Software Asset Management Market Size and Share
  • Analysis of IT Asset Management Industry
  • Importance of Effective Hardware Asset Management
  • Market Dynamics of Hardware Inventory Management

Segmentation Analysis of the Hardware Asset Management Market

By Solution:

  • Software
    • Standalone Software
    • Integrated Software
  • Services
    • Asset Maintenance & Repair Services
    • Asset Tracking & Monitoring
    • Consulting Services
    • Managed Services

By Asset Type:

  • Desktops/PCs
  • Laptops
  • Routers
  • Storage Drives
  • Workstations
  • Servers
  • Other IT Hardware Assets

By Enterprise Size:

  • Small Offices (1 to 9 employees)
  • Small Enterprises (10 to 99 employees)
  • Medium-sized Enterprise (100 to 499 employees)
  • Large Enterprises (500 to 999 employees)
  • Very Large Enterprises (1,000+ employees)

By Industry:

  • Finance
    • Banking
    • Insurance
    • Investment/Securities
  • Manufacturing & Resources
    • Discrete Manufacturing
    • Process Manufacturing
    • Resource Industries
    • Agriculture
  • Distribution Services
    • Retail
    • Wholesales
    • Transportation /Logistics Services
    • Warehousing & Storage
    • Shipping
  • Services
    • IT/Professional Services
    • Cloud Services
    • Media, Entertainment & Publishing
    • Travel & Hospitality
    • Legal Services
  • Public Sector
    • Government (State/Central)
    • Education
    • Healthcare
    • Aerospace & Defense
    • Non-profit
  • Infrastructure
    • Telecommunication
    • Data Centers
    • Energy & Utilities
    • Building & Construction

By Region:

  • North America
  • Latin America
  • South Asia & Pacific
  • East Asia
  • Western Europe
  • Eastern Europe
  • Middle East and Africa

Frequently Asked Questions

What is the value of hardware asset management?

The market is expected to hit a value of US$ 30,193.02 million by 2024.

Which industry holds the notable market share?

Finance is set to hold a notable market share by 2024.

What is the predicted valuation of the global market by 2034?

The market is predicted to reach US$ 93,056.19 million by 2034.

Which enterprise is set to generate a high hardware asset management market share?

Medium-sized enterprises are set to dominate the market.

Which solution is predicted to grow rapidly between 2024 and 2034?

The services segment is set to grow with a CAGR of 13.6% from 2024 to 2034.

Who are the major vendors in the hardware asset management market?

Microsoft Azure, IBM Cloud, Oracle, Dell, and HP.

What do you mean by hardware asset management?

It is the process of tracking and inventorying physical IT components.

What is the difference between HAM and SAM?

HAM is hardware management, and SAM is software management.

What is hardware management?

It is a process of developing the components of networks and computers.

Table of Content

1. Executive Summary

    1.1. Global Market Outlook

    1.2. Demand Side Trends

    1.3. Supply Side Trends

    1.4. Analysis and Recommendations

2. Market Overview

    2.1. Market Coverage / Taxonomy

    2.2. Market Definition / Scope / Limitations

3. Key Market Trends

    3.1. Key Trends Impacting the Market

    3.2. Product Innovation / Development Trends

4. Pricing Analysis

    4.1. Pricing Analysis, By Pricing Model

        4.1.1. Subscription Pricing Model

        4.1.2. Perpetual Licensing

    4.2. Average Pricing Analysis Benchmark

5. Global Market Demand (Value in US$ million) Analysis 2019 to 2023 and forecast, 2024 to 2034

    5.1. Historical Market Value (US$ million) Analysis, 2019 to 2023

    5.2. Current and Future Market Value (US$ million) Projections, 2024 to 2034

        5.2.1. Y-o-Y Growth Trend Analysis

        5.2.2. Absolute $ Opportunity Analysis

6. Market Background

    6.1. Macro-Economic Factors

    6.2. Forecast Factors - Relevance & Impact

    6.3. Value Chain

    6.4. COVID-19 Crisis - Impact Assessment

        6.4.1. Current Statistics

        6.4.2. Short-Mid-Long Term Outlook

        6.4.3. Likely Rebound

    6.5. Market Dynamics

        6.5.1. Drivers

        6.5.2. Restraints

        6.5.3. Opportunities

7. Global Market Analysis 2019 to 2023 and Forecast 2024 to 2034, By Solution

    7.1. Introduction / Key Findings

    7.2. Historical Market Size (US$ million) Analysis By Solution, 2019 to 2023

    7.3. Current and Future Market Size (US$ million) Analysis and Forecast By Solution, 2024 to 2034

        7.3.1. Software

            7.3.1.1. Standalone Software

            7.3.1.2. Integrated Software

        7.3.2. Services

            7.3.2.1. Asset Maintenance & Repair Services

            7.3.2.2. Asset Tracking & Monitoring

            7.3.2.3. Consulting Services

            7.3.2.4. Managed Services

    7.4. Market Attractiveness Analysis By Solution

8. Global Market Analysis 2019 to 2023 and Forecast 2024 to 2034, By Asset Type

    8.1. Introduction / Key Findings

    8.2. Historical Market Size (US$ million) Analysis By Asset Type, 2019 to 2023

    8.3. Current and Future Market Size (US$ million) Analysis and Forecast By Asset Type, 2024 to 2034

        8.3.1. Desktops/PCs

        8.3.2. Laptops

        8.3.3. Routers

        8.3.4. Storage Drives

        8.3.5. Workstations

        8.3.6. Servers

        8.3.7. Other IT Hardware Assets

    8.4. Market Attractiveness Analysis By Asset Type

9. Global Market Analysis 2019 to 2023 and Forecast 2024 to 2034, By Industry

    9.1. Introduction / Key Findings

    9.2. Historical Market Size (US$ million) Analysis By Industry, 2019 to 2023

    9.3. Current and Future Market Size (US$ million) Analysis and Forecast By Industry, 2024 to 2034

        9.3.1. Finance

            9.3.1.1. Banking

            9.3.1.2. Insurance

            9.3.1.3. Investment/Securities

        9.3.2. Manufacturing & Resources

            9.3.2.1. Discrete Manufacturing

            9.3.2.2. Process Manufacturing

            9.3.2.3. Resource Industries

            9.3.2.4. Agriculture

        9.3.3. Distribution Services

            9.3.3.1. Retail

            9.3.3.2. Wholesales

            9.3.3.3. Transportation /Logistics Services

            9.3.3.4. Warehousing & Storage

            9.3.3.5. Shipping

        9.3.4. Services

            9.3.4.1. IT/Professional Services

            9.3.4.2. Cloud Services

            9.3.4.3. Media, Entertainment, and Publishing

            9.3.4.4. Travel and Hospitality

            9.3.4.5. Legal Services

        9.3.5. Public Sector

            9.3.5.1. Government (State/Central)

            9.3.5.2. Education

            9.3.5.3. Healthcare

            9.3.5.4. Aerospace and Defense

            9.3.5.5. Non-profit

        9.3.6. Infrastructure

            9.3.6.1. Telecommunication

            9.3.6.2. Data Centers

            9.3.6.3. Energy & Utilities

            9.3.6.4. Building & Construction

    9.4. Market Attractiveness Analysis By Industry

10. Global Market Analysis 2019 to 2023 and Forecast 2024 to 2034, By Enterprise Size

    10.1. Introduction / Key Findings

    10.2. Historical Market Size (US$ million) Analysis By Enterprise Size, 2019 to 2023

    10.3. Current and Future Market Size (US$ million) Analysis and Forecast By Enterprise Size, 2024 to 2034

        10.3.1. Small Offices (1 to 9 Employees)

        10.3.2. Small Enterprises (10 to 99 Employees)

        10.3.3. Medium-sized Enterprise (100 to 499 Employees)

        10.3.4. Large Enterprises (500 to 999 Employees)

        10.3.5. Very Large Enterprises (1,000+ Employees)

    10.4. Market Attractiveness Analysis By Enterprise Size

11. Global Market Analysis 2019 to 2023 and Forecast 2024 to 2034, By Region

    11.1. Introduction / Key Findings

    11.2. Historical Market Size (US$ million) Analysis By Region, 2019 to 2023

    11.3. Current and Future Market Size (US$ million) Analysis and Forecast By Region, 2024 to 2034

        11.3.1. North America

        11.3.2. Latin America

        11.3.3. Europe

        11.3.4. East Asia

        11.3.5. South Asia Pacific

        11.3.6. Middle East and Africa

    11.4. Market Attractiveness Analysis By Region

12. North America Market Analysis 2019 to 2023 and Forecast 2024 to 2034

    12.1. Introduction

    12.2. Historical Market Size (US$ million) Trend Analysis By Market Taxonomy, 2019 to 2023

    12.3. Current and Future Market Size (US$ million) Forecast By Market Taxonomy, 2024 to 2034

        12.3.1. By Solution

        12.3.2. By Asset Type

        12.3.3. By Industry

        12.3.4. By Enterprise Size

        12.3.5. By Country

            12.3.5.1. United States

            12.3.5.2. Canada

            12.3.5.3. Mexico

    12.4. Market Attractiveness Analysis

        12.4.1. By Solution

        12.4.2. By Asset Type

        12.4.3. By Industry

        12.4.4. By Enterprise Size

        12.4.5. By Country

    12.5. Market Trends

        12.5.1. Key Market Participants - Intensity Mapping

13. Latin America Market Analysis 2019 to 2023 and Forecast 2024 to 2034

    13.1. Introduction

    13.2. Historical Market Size (US$ million) Trend Analysis By Market Taxonomy, 2019 to 2023

    13.3. Current and Future Market Size (US$ million) Forecast By Market Taxonomy, 2024 to 2034

        13.3.1. By Solution

        13.3.2. By Asset Type

        13.3.3. By Industry

        13.3.4. By Enterprise Size

        13.3.5. By Country

            13.3.5.1. Brazil

            13.3.5.2. Chile

            13.3.5.3. Latin America

    13.4. Market Attractiveness Analysis

        13.4.1. By Solution

        13.4.2. By Asset Type

        13.4.3. By Industry

        13.4.4. By Enterprise Size

        13.4.5. By Country

14. South Asia & Pacific Market Analysis 2019 to 2023 and Forecast 2024 to 2034

    14.1. Introduction

    14.2. Historical Market Size (US$ million) Trend Analysis By Market Taxonomy, 2019 to 2023

    14.3. Current and Future Market Size (US$ million) Forecast By Market Taxonomy, 2024 to 2034

        14.3.1. By Solution

        14.3.2. By Asset Type

        14.3.3. By Industry

        14.3.4. By Enterprise Size

        14.3.5. By Country

            14.3.5.1. India

            14.3.5.2. Indonesia

            14.3.5.3. Malaysia

            14.3.5.4. Singapore

            14.3.5.5. Australia & New Zealand

            14.3.5.6. South Asia and Pacific

    14.4. Market Attractiveness Analysis

        14.4.1. By Solution

        14.4.2. By Asset Type

        14.4.3. By Industry

        14.4.4. By Enterprise Size

        14.4.5. By Country

15. East Asia Market Analysis 2019 to 2023 and Forecast 2024 to 2034

    15.1. Introduction

    15.2. Historical Market Size (US$ million) Trend Analysis By Market Taxonomy, 2019 to 2023

    15.3. Current and Future Market Size (US$ million) Forecast By Market Taxonomy, 2024 to 2034

        15.3.1. By Solution

        15.3.2. By Asset Type

        15.3.3. By Industry

        15.3.4. By Enterprise Size

        15.3.5. By Country

            15.3.5.1. China

            15.3.5.2. Japan

            15.3.5.3. South Korea

    15.4. Market Attractiveness Analysis

        15.4.1. By Solution

        15.4.2. By Asset Type

        15.4.3. By Industry

        15.4.4. By Enterprise Size

        15.4.5. By Country

16. Western Europe Market Analysis 2019 to 2023 and Forecast 2024 to 2034

    16.1. Introduction

    16.2. Historical Market Size (US$ million) Trend Analysis By Market Taxonomy, 2019 to 2023

    16.3. Current and Future Market Size (US$ million) Forecast By Market Taxonomy, 2024 to 2034

        16.3.1. By Solution

        16.3.2. By Asset Type

        16.3.3. By Industry

        16.3.4. By Enterprise Size

        16.3.5. By Country

            16.3.5.1. Germany

            16.3.5.2. Italy

            16.3.5.3. France

            16.3.5.4. United Kingdom

            16.3.5.5. Spain

            16.3.5.6. BENELUX

            16.3.5.7. Nordics

            16.3.5.8. Western Europe

    16.4. Market Attractiveness Analysis

        16.4.1. By Solution

        16.4.2. By Asset Type

        16.4.3. By Industry

        16.4.4. By Enterprise Size

        16.4.5. By Country

17. Eastern Europe Market Analysis 2019 to 2023 and Forecast 2024 to 2034

    17.1. Introduction

    17.2. Historical Market Size (US$ million) Trend Analysis By Market Taxonomy, 2019 to 2023

    17.3. Current and Future Market Size (US$ million) Forecast By Market Taxonomy, 2024 to 2034

        17.3.1. By Solution

        17.3.2. By Asset Type

        17.3.3. By Industry

        17.3.4. By Enterprise Size

        17.3.5. By Country

            17.3.5.1. Russia

            17.3.5.2. Poland

            17.3.5.3. Balkan & Baltics

            17.3.5.4. Eastern Europe

    17.4. Market Attractiveness Analysis

        17.4.1. By Solution

        17.4.2. By Asset Type

        17.4.3. By Industry

        17.4.4. By Enterprise Size

        17.4.5. By Country

18. Middle East and Africa Market Analysis 2019 to 2023 and Forecast 2024 to 2034

    18.1. Introduction

    18.2. Historical Market Size (US$ million) Trend Analysis By Market Taxonomy, 2019 to 2023

    18.3. Current and Future Market Size (US$ million) Forecast By Market Taxonomy, 2024 to 2034

        18.3.1. By Solution

        18.3.2. By Asset Type

        18.3.3. By Industry

        18.3.4. By Enterprise Size

        18.3.5. By Country

            18.3.5.1. KSA

            18.3.5.2. Other GCC

            18.3.5.3. Türkiye

            18.3.5.4. South Africa

            18.3.5.5. Middle East and Africa

    18.4. Market Attractiveness Analysis

        18.4.1. By Solution

        18.4.2. By Asset Type

        18.4.3. By Industry

        18.4.4. By Enterprise Size

        18.4.5. By Country

19. Key Countries Analysis - Market

    19.1. United States Market Analysis

        19.1.1. By Solution

        19.1.2. By Asset Type

        19.1.3. By Industry

        19.1.4. By Enterprise Size

    19.2. Canada Market Analysis

        19.2.1. By Solution

        19.2.2. By Asset Type

        19.2.3. By Industry

        19.2.4. By Enterprise Size

    19.3. Mexico Market Analysis

        19.3.1. By Solution

        19.3.2. By Asset Type

        19.3.3. By Industry

        19.3.4. By Enterprise Size

    19.4. Brazil Market Analysis

        19.4.1. By Solution

        19.4.2. By Asset Type

        19.4.3. By Industry

        19.4.4. By Enterprise Size

    19.5. Chile Market Analysis

        19.5.1. By Solution

        19.5.2. By Asset Type

        19.5.3. By Industry

        19.5.4. By Enterprise Size

    19.6. Germany Market Analysis

        19.6.1. By Solution

        19.6.2. By Asset Type

        19.6.3. By Industry

        19.6.4. By Enterprise Size

    19.7. Italy Market Analysis

        19.7.1. By Solution

        19.7.2. By Asset Type

        19.7.3. By Industry

        19.7.4. By Enterprise Size

    19.8. France Market Analysis

        19.8.1. By Solution

        19.8.2. By Asset Type

        19.8.3. By Industry

        19.8.4. By Enterprise Size

    19.9. United Kingdom Market Analysis

        19.9.1. By Solution

        19.9.2. By Asset Type

        19.9.3. By Industry

        19.9.4. By Enterprise Size

    19.10. Spain Market Analysis

        19.10.1. By Solution

        19.10.2. By Asset Type

        19.10.3. By Industry

        19.10.4. By Enterprise Size

    19.11. BENELUX Market Analysis

        19.11.1. By Solution

        19.11.2. By Asset Type

        19.11.3. By Industry

        19.11.4. By Enterprise Size

    19.12. Russia Market Analysis

        19.12.1. By Solution

        19.12.2. By Asset Type

        19.12.3. By Industry

        19.12.4. By Enterprise Size

    19.13. Poland Market Analysis

        19.13.1. By Solution

        19.13.2. By Asset Type

        19.13.3. By Industry

        19.13.4. By Enterprise Size

    19.14. Balkan & Baltics Market Analysis

        19.14.1. By Solution

        19.14.2. By Asset Type

        19.14.3. By Industry

        19.14.4. By Enterprise Size

    19.15. China Market Analysis

        19.15.1. By Solution

        19.15.2. By Asset Type

        19.15.3. By Industry

        19.15.4. By Enterprise Size

    19.16. Japan Market Analysis

        19.16.1. By Solution

        19.16.2. By Asset Type

        19.16.3. By Industry

        19.16.4. By Enterprise Size

    19.17. South Korea Market Analysis

        19.17.1. By Solution

        19.17.2. By Asset Type

        19.17.3. By Industry

        19.17.4. By Enterprise Size

    19.18. India Market Analysis

        19.18.1. By Solution

        19.18.2. By Asset Type

        19.18.3. By Industry

        19.18.4. By Enterprise Size

    19.19. Australia and New Zealand Market Analysis

        19.19.1. By Solution

        19.19.2. By Asset Type

        19.19.3. By Industry

        19.19.4. By Enterprise Size

    19.20. KSA Market Analysis

        19.20.1. By Solution

        19.20.2. By Asset Type

        19.20.3. By Industry

        19.20.4. By Enterprise Size

    19.21. GCC Countries Market Analysis

        19.21.1. By Solution

        19.21.2. By Asset Type

        19.21.3. By Industry

        19.21.4. By Enterprise Size

    19.22. Turkey Market Analysis

        19.22.1. By Solution

        19.22.2. By Asset Type

        19.22.3. By Industry

        19.22.4. By Enterprise Size

    19.23. South Africa Market Analysis

        19.23.1. By Solution

        19.23.2. By Asset Type

        19.23.3. By Industry

        19.23.4. By Enterprise Size

20. Market Structure Analysis

    20.1. Market Analysis by Tier of Companies

    20.2. Market Share Analysis of Top Players

    20.3. Market Presence Analysis

21. Competition Analysis

    21.1. Competition Dashboard

    21.2. Competition Deep Dive

        21.2.1. Business Overview

        21.2.2. Solution Portfolio

        21.2.3. Go-To-Market Approach & Strategies

        21.2.4. Recent Developments (Partnerships, Mergers)

    21.3. Hardware Vendors

        21.3.1. Microsoft Azure

        21.3.2. IBM Cloud

        21.3.3. Oracle

        21.3.4. Dell

        21.3.5. HP

        21.3.6. Broadcom

        21.3.7. BMC Software

        21.3.8. Service Now

        21.3.9. Flexera Software

        21.3.10. Ivanti

        21.3.11. Solar Winds

        21.3.12. Freshworks Inc.

        21.3.13. Manage Engine

        21.3.14. Asset Sonar

        21.3.15. SyAM Software

22. Assumptions and Acronyms Used

23. Research Methodology

Don't pay for what you don't need

Customize your report by selecting specific countries or regions and save 30%!

List of Tables

Table 1: Global Market Value (US$ million) Analysis (2019 to 2023) By Solution

Table 2: Global Market Value (US$ million) Forecast (2024 to 2034) By Solution

Table 3: Global Market Value (US$ million) Analysis (2019 to 2023) By Asset Type

Table 4: Global Market Value (US$ million) Forecast (2024 to 2034) By Asset Type

Table 5: Global Market Value (US$ million) Analysis (2019 to 2023) By Industry

Table 6: Global Market Value (US$ million) Forecast (2024 to 2034) By Industry

Table 7: Global Market Value (US$ million) Analysis (2019 to 2023) By Enterprise Size

Table 8: Global Market Value (US$ million) Forecast (2024 to 2034) By Enterprise Size

Table 9: Global Market Value (US$ million) Analysis (2019 to 2023) By Region

Table 10: Global Market Value (US$ million) Forecast (2024 to 2034) By Region

Table 11: North America Market Value (US$ million) Analysis (2019 to 2023) By Solution

Table 12: North America Market Value (US$ million) Forecast (2024 to 2034) By Solution

Table 13: North America Market Value (US$ million) Analysis (2019 to 2023) By Asset Type

Table 14: North America Market Value (US$ million) Forecast (2024 to 2034) By Asset Type

Table 15: North America Market Value (US$ million) Analysis (2019 to 2023) By Industry

Table 16: North America Market Value (US$ million) Forecast (2024 to 2034) By Industry

Table 17: North America Market Value (US$ million) Analysis (2019 to 2023) By Enterprise Size

Table 18: North America Market Value (US$ million) Forecast (2024 to 2034) By Enterprise Size

Table 19: North America Market Value (US$ million) Analysis (2019 to 2023) by Country

Table 20: North America Market Value (US$ million) Forecast (2024 to 2034) by Country

Table 21: Latin America Market Value (US$ million) Analysis (2019 to 2023) By Solution

Table 22: Latin America Market Value (US$ million) Forecast (2024 to 2034) By Solution

Table 23: Latin America Market Value (US$ million) Analysis (2019 to 2023) By Asset Type

Table 24: Latin America Market Value (US$ million) Forecast (2024 to 2034) By Asset Type

Table 25: Latin America Market Value (US$ million) Analysis (2019 to 2023) By Industry

Table 26: Latin America Market Value (US$ million) Forecast (2024 to 2034) By Industry

Table 27: Latin America Market Value (US$ million) Analysis (2019 to 2023) By Enterprise Size

Table 28: Latin America Market Value (US$ million) Forecast (2024 to 2034) By Enterprise Size

Table 29: Latin America Market Value (US$ million) Analysis (2019 to 2023) by Country

Table 30: Latin America Market Value (US$ million) Forecast (2024 to 2034) by Country

Table 31: Europe Market Value (US$ million) Analysis (2019 to 2023) By Solution

Table 32: Europe Market Value (US$ million) Forecast (2024 to 2034) By Solution

Table 33: Europe Market Value (US$ million) Analysis (2019 to 2023) By Asset Type

Table 34: Europe Market Value (US$ million) Forecast (2024 to 2034) By Asset Type

Table 35: Europe Market Value (US$ million) Analysis (2019 to 2023) By Industry

Table 36: Europe Market Value (US$ million) Forecast (2024 to 2034) By Industry

Table 37: Europe Market Value (US$ million) Analysis (2019 to 2023) By Enterprise Size

Table 38: Europe Market Value (US$ million) Forecast (2024 to 2034) By Enterprise Size

Table 39: Europe Market Value (US$ million) Analysis (2019 to 2023) by Country

Table 40: Europe Market Value (US$ million) Forecast (2024 to 2034) by Country

Table 41: South Asia & Pacific Market Value (US$ million) Analysis (2019 to 2023) By Solution

Table 42: South Asia & Pacific Market Value (US$ million) Forecast (2024 to 2034) By Solution

Table 43: South Asia & Pacific Market Value (US$ million) Analysis (2019 to 2023) By Asset Type

Table 44: South Asia & Pacific Market Value (US$ million) Forecast (2024 to 2034) By Asset Type

Table 45: South Asia & Pacific Market Value (US$ million) Analysis (2019 to 2023) By Industry

Table 46: South Asia & Pacific Market Value (US$ million) Forecast (2024 to 2034) By Industry

Table 47: South Asia & Pacific Market Value (US$ million) Analysis (2019 to 2023) By Enterprise Size

Table 48: South Asia & Pacific Market Value (US$ million) Forecast (2024 to 2034) By Enterprise Size

Table 49: South Asia & Pacific Market Value (US$ million) Analysis (2019 to 2023) by Country

Table 50: South Asia & Pacific Market Value (US$ million) Forecast (2024 to 2034) by Country

Table 51: East Asia Market Value (US$ million) Analysis (2019 to 2023) By Solution

Table 52: East Asia Market Value (US$ million) Forecast (2024 to 2034) By Solution

Table 53: East Asia Market Value (US$ million) Analysis (2019 to 2023) By Asset Type

Table 54: East Asia Market Value (US$ million) Forecast (2024 to 2034) By Asset Type

Table 55: East Asia Market Value (US$ million) Analysis (2019 to 2023) By Industry

Table 56: East Asia Market Value (US$ million) Forecast (2024 to 2034) By Industry

Table 57: East Asia Market Value (US$ million) Analysis (2019 to 2023) By Enterprise Size

Table 58: East Asia Market Value (US$ million) Forecast (2024 to 2034) By Enterprise Size

Table 59: East Asia Market Value (US$ million) Analysis (2019 to 2023) by Country

Table 60: East Asia Market Value (US$ million) Forecast (2024 to 2034) by Country

Table 61: Middle East and Africa Market Value (US$ million) Analysis (2019 to 2023) By Solution

Table 62: Middle East and Africa Market Value (US$ million) Forecast (2024 to 2034) By Solution

Table 63: Middle East and Africa Market Value (US$ million) Analysis (2019 to 2023) By Asset Type

Table 64: Middle East and Africa Market Value (US$ million) Forecast (2024 to 2034) By Asset Type

Table 65: Middle East and Africa Market Value (US$ million) Analysis (2019 to 2023) By Industry

Table 66: Middle East and Africa Market Value (US$ million) Forecast (2024 to 2034) By Industry

Table 67: Middle East and Africa Market Value (US$ million) Analysis (2019 to 2023) By Enterprise Size

Table 68: Middle East and Africa Market Value (US$ million) Forecast (2024 to 2034) By Enterprise Size

Table 69: Middle East and Africa Market Value (US$ million) Analysis (2019 to 2023) by Country

Table 70: Middle East and Africa Market Value (US$ million) Forecast (2024 to 2034) by Country
Sudip Saha
Sudip Saha

Principal Consultant

Talk to Analyst

Find your sweet spots for generating winning opportunities in this market.

List of Charts

Figure 1: Global Market Size (US$ million) and Y-o-Y Growth Rate from 2024 to 2034

Figure 2: Global Market Size and Y-o-Y Growth Rate from 2024 to 2034

Figure 3: Global Market Value (US$ million), 2019 to 2023

Figure 4: Global Market Value (US$ million), 2024 to 2034

Figure 5: Global Market Value Share Analysis (2024 to 2034) By Solution

Figure 6: Global Market Value Y-o-Y Growth Trend Analysis (2019 to 2023) By Solution

Figure 7: Global Market Attractiveness By Solution

Figure 8: Global Market Value Share Analysis (2024 to 2034) By Asset Type

Figure 9: Global Market Value Y-o-Y Growth Trend Analysis (2019 to 2023) By Asset Type

Figure 10: Global Market Attractiveness By Asset Type

Figure 11: Global Market Value Share Analysis (2024 to 2034) By Industry

Figure 12: Global Market Value Y-o-Y Growth Trend Analysis (2019 to 2023) By Industry

Figure 13: Global Market Attractiveness By Industry

Figure 14: Global Market Value Share Analysis (2024 to 2034) By Enterprise Size

Figure 15: Global Market Value Y-o-Y Growth Trend Analysis (2019 to 2023) By Enterprise Size

Figure 16: Global Market Attractiveness By Enterprise Size

Figure 17: Global Market Value Share Analysis (2024 to 2034) By Region

Figure 18: Global Market Value Y-o-Y Growth Trend Analysis (2019 to 2023) By Region

Figure 19: Global Market Attractiveness By Region

Figure 20: North America Market Absolute $ Opportunity (US$ million), 2019 to 2023

Figure 21: Latin America Market Absolute $ Opportunity (US$ million), 2019 to 2023

Figure 22: Europe Market Absolute $ Opportunity (US$ million), 2019 to 2023

Figure 23: East Asia Market Absolute $ Opportunity (US$ million), 2019 to 2034

Figure 24: South Asia & Pacific Market Absolute $ Opportunity (US$ million), 2019 to 2023

Figure 25: Middle East & Africa Market Absolute $ Opportunity (US$ million), 2019 to 2023

Figure 26: North America Market Value (US$ million), 2019 to 2023

Figure 27: North America Market Value (US$ million), 2024 to 2034

Figure 28: North America Market Value Share Analysis (2024 to 2034) By Solution

Figure 29: North America Market Value Y-o-Y Growth Trend Analysis (2019 to 2023) By Solution

Figure 30: North America Market Attractiveness By Solution

Figure 31: North America Market Value Share Analysis (2024 to 2034) By Asset Type

Figure 32: North America Market Value Y-o-Y Growth Trend Analysis (2019 to 2023) By Asset Type

Figure 33: North America Market Attractiveness By Asset Type

Figure 34: North America Market Value Share Analysis (2024 to 2034) By Industry

Figure 35: North America Market Value Y-o-Y Growth Trend Analysis (2019 to 2023) By Industry

Figure 36: North America Market Attractiveness By Industry

Figure 37: North America Market Value Share Analysis (2024 to 2034) By Enterprise Size

Figure 38: North America Market Value Y-o-Y Growth Trend Analysis (2019 to 2023) By Enterprise Size

Figure 39: North America Market Attractiveness By Enterprise Size

Figure 40: North America Market Value Share Analysis (2024 to 2034) by Country

Figure 41: North America Market Value Y-o-Y Growth Trend Analysis (2019 to 2023) by Country

Figure 42: North America Market Attractiveness by Country

Figure 43: United States Market Absolute $ Opportunity (US$ million), 2019 to 2023

Figure 44: Canada Market Absolute $ Opportunity (US$ million), 2019 to 2023

Figure 45: Latin America Market Value (US$ million), 2019 to 2023

Figure 46: Latin America Market Value (US$ million), 2024 to 2034

Figure 47: Latin America Market Value Share Analysis (2024 to 2034) By Solution

Figure 48: Latin America Market Value Y-o-Y Growth Trend Analysis (2019 to 2023) By Solution

Figure 49: Latin America Market Attractiveness By Solution

Figure 50: Latin America Market Value Share Analysis (2024 to 2034) By Asset Type

Figure 51: Latin America Market Value Y-o-Y Growth Trend Analysis (2019 to 2023) By Asset Type

Figure 52: Latin America Market Attractiveness By Asset Type

Figure 53: Latin America Market Value Share Analysis (2024 to 2034) By Industry

Figure 54: Latin America Market Value Y-o-Y Growth Trend Analysis (2019 to 2023) By Industry

Figure 55: Latin America Market Attractiveness By Industry

Figure 56: Latin America Market Value Share Analysis (2024 to 2034) By Enterprise Size

Figure 57: Latin America Market Value Y-o-Y Growth Trend Analysis (2019 to 2023) By Enterprise Size

Figure 58: Latin America Market Attractiveness By Enterprise Size

Figure 59: Latin America Market Value Share Analysis (2024 to 2034) by Country

Figure 60: Latin America Market Value Y-o-Y Growth Trend Analysis (2019 to 2023) by Country

Figure 61: Latin America Market Attractiveness by Country

Figure 62: Brazil Market Absolute $ Opportunity (US$ million), 2019 to 2023

Figure 63: Mexico Market Absolute $ Opportunity (US$ million), 2019 to 2023

Figure 64: Latin America Market Absolute $ Opportunity (US$ million), 2019 to 2023

Figure 65: Europe Market Value (US$ million), 2019 to 2023

Figure 66: Europe Market Value (US$ million), 2024 to 2034

Figure 67: Europe Market Value Share Analysis (2024 to 2034) By Solution

Figure 68: Europe Market Value Y-o-Y Growth Trend Analysis (2019 to 2023) By Solution

Figure 69: Europe Market Attractiveness By Solution

Figure 70: Europe Market Value Share Analysis (2024 to 2034) By Asset Type

Figure 71: Europe Market Value Y-o-Y Growth Trend Analysis (2019 to 2023) By Asset Type

Figure 72: Europe Market Attractiveness By Asset Type

Figure 73: Europe Market Value Share Analysis (2024 to 2034) By Industry

Figure 74: Europe Market Value Y-o-Y Growth Trend Analysis (2019 to 2023) By Industry

Figure 75: Europe Market Attractiveness By Industry

Figure 76: Europe Market Value Share Analysis (2024 to 2034) By Enterprise Size

Figure 77: Europe Market Value Y-o-Y Growth Trend Analysis (2019 to 2023) By Enterprise Size

Figure 78: Europe Market Attractiveness By Enterprise Size

Figure 79: Europe Market Value Share Analysis (2024 to 2034) by Country

Figure 80: Europe Market Value Y-o-Y Growth Trend Analysis (2019 to 2023) by Country

Figure 81: Europe Market Attractiveness by Country

Figure 82: Germany Market Absolute $ Opportunity (US$ million), 2019 to 2023

Figure 83: Italy Market Absolute $ Opportunity (US$ million), 2019 to 2023

Figure 84: France Market Absolute $ Opportunity (US$ million), 2019 to 2023

Figure 85: United Kingdom Market Absolute $ Opportunity (US$ million), 2019 to 2023

Figure 86: Spain Market Absolute $ Opportunity (US$ million), 2019 to 2023

Figure 87: BENELUX Market Absolute $ Opportunity (US$ million), 2019 to 2023

Figure 88: Russia Market Absolute $ Opportunity (US$ million), 2019 to 2023

Figure 89: Europe Market Absolute $ Opportunity (US$ million), 2019 to 2023

Figure 90: South Asia & Pacific Market Value (US$ million), 2019 to 2023

Figure 91: South Asia & Pacific Market Value (US$ million), 2024 to 2034

Figure 92: South Asia & Pacific Market Value Share Analysis (2024 to 2034) By Solution

Figure 93: South Asia & Pacific Market Value Y-o-Y Growth Trend Analysis (2019 to 2023) By Solution

Figure 94: South Asia & Pacific Market Attractiveness By Solution

Figure 95: South Asia & Pacific Market Value Share Analysis (2024 to 2034) By Asset Type

Figure 96: South Asia & Pacific Market Value Y-o-Y Growth Trend Analysis (2019 to 2023) By Asset Type

Figure 97: South Asia & Pacific Market Attractiveness By Asset Type

Figure 98: South Asia & Pacific Market Value Share Analysis (2024 to 2034) By Industry

Figure 99: South Asia & Pacific Market Value Y-o-Y Growth Trend Analysis (2019 to 2023) By Industry

Figure 100: South Asia & Pacific Market Attractiveness By Industry

Figure 101: South Asia & Pacific Market Value Share Analysis (2024 to 2034) By Enterprise Size

Figure 102: South Asia & Pacific Market Value Y-o-Y Growth Trend Analysis (2019 to 2023) By Enterprise Size

Figure 103: South Asia & Pacific Market Attractiveness By Enterprise Size

Figure 104: South Asia & Pacific Market Value Share Analysis (2024 to 2034) by Country

Figure 105: South Asia & Pacific Market Value Y-o-Y Growth Trend Analysis (2019 to 2023) by Country

Figure 106: South Asia & Pacific Market Attractiveness by Country

Figure 107: India Market Absolute $ Opportunity (US$ million), 2019 to 2023

Figure 108: Indonesia Market Absolute $ Opportunity (US$ million), 2019 to 2023

Figure 109: Malaysia Market Absolute $ Opportunity (US$ million), 2019 to 2023

Figure 110: Singapore Market Absolute $ Opportunity (US$ million), 2019 to 2023

Figure 111: Australia& New Zealand Market Absolute $ Opportunity (US$ million), 2019 to 2023

Figure 112: South Asia & Pacific Market Absolute $ Opportunity (US$ million), 2019 to 2023

Figure 113: East Asia Market Value (US$ million), 2019 to 2023

Figure 114: East Asia Market Value (US$ million), 2024 to 2034

Figure 115: East Asia Market Value Share Analysis (2024 to 2034) By Solution

Figure 116: East Asia Market Value Y-o-Y Growth Trend Analysis (2019 to 2023) By Solution

Figure 117: East Asia Market Attractiveness By Solution

Figure 118: East Asia Market Value Share Analysis (2024 to 2034) By Asset Type

Figure 119: East Asia Market Value Y-o-Y Growth Trend Analysis (2019 to 2023) By Asset Type

Figure 120: East Asia Market Attractiveness By Asset Type

Figure 121: East Asia Market Value Share Analysis (2024 to 2034) By Industry

Figure 122: East Asia Market Value Y-o-Y Growth Trend Analysis (2019 to 2023) By Industry

Figure 123: East Asia Market Attractiveness By Industry

Figure 124: East Asia Market Value Share Analysis (2024 to 2034) By Enterprise Size

Figure 125: East Asia Market Value Y-o-Y Growth Trend Analysis (2019 to 2023) By Enterprise Size

Figure 126: East Asia Market Attractiveness By Enterprise Size

Figure 127: East Asia Market Value Share Analysis (2024 to 2034) by Country

Figure 128: East Asia Market Value Y-o-Y Growth Trend Analysis (2019 to 2023) by Country

Figure 129: East Asia Market Attractiveness by Country

Figure 130: China Market Absolute $ Opportunity (US$ million), 2019 to 2023

Figure 131: Japan Market Absolute $ Opportunity (US$ million), 2019 to 2023

Figure 132: South Korea Market Absolute $ Opportunity (US$ million), 2019 to 2023

Figure 133: Middle East and Africa Market Value (US$ million), 2019 to 2023

Figure 134: Middle East and Africa Market Value (US$ million), 2024 to 2034

Figure 135: Middle East and Africa Market Value Share Analysis (2024 to 2034) By Solution

Figure 136: Middle East and Africa Market Value Y-o-Y Growth Trend Analysis (2019 to 2023) By Solution

Figure 137: Middle East and Africa Market Attractiveness By Solution

Figure 138: Middle East and Africa Market Value Share Analysis (2024 to 2034) By Asset Type

Figure 139: Middle East and Africa Market Value Y-o-Y Growth Trend Analysis (2019 to 2023) By Asset Type

Figure 140: Middle East and Africa Market Attractiveness By Asset Type

Figure 141: Middle East and Africa Market Value Share Analysis (2024 to 2034) By Industry

Figure 142: Middle East and Africa Market Value Y-o-Y Growth Trend Analysis (2019 to 2023) By Industry

Figure 143: Middle East and Africa Market Attractiveness By Industry

Figure 144: Middle East and Africa Market Value Share Analysis (2024 to 2034) By Enterprise Size

Figure 145: Middle East and Africa Market Value Y-o-Y Growth Trend Analysis (2019 to 2023) By Enterprise Size

Figure 146: Middle East and Africa Market Attractiveness By Enterprise Size

Figure 147: Middle East and Africa Market Value Share Analysis (2024 to 2034) by Country

Figure 148: Middle East and Africa Market Value Y-o-Y Growth Trend Analysis (2019 to 2023) by Country

Figure 149: Middle East and Africa Market Attractiveness by Country

Figure 150: GCC Countries Market Absolute $ Opportunity (US$ million), 2019 to 2023

Figure 151: Turkey Market Absolute $ Opportunity (US$ million), 2019 to 2023

Figure 152: South Africa Market Absolute $ Opportunity (US$ million), 2019 to 2023

Figure 153: Middle East and Africa Market Absolute $ Opportunity (US$ million), 2019 to 2023

Recommendations

Technology

Gaming Hardware Market

Published : August 2023

Technology

Hardware Security Module Market

Published : June 2023

Technology

Software Distribution Market

Published : November 2022

Explore Technology Insights

View Reports

Hardware Asset Management Market