Hardware-Assisted Verification Market Size and Share Forecast Outlook 2025 to 2035

The Hardware-Assisted Verification Market is estimated to be valued at USD 760.4 million in 2025 and is projected to reach USD 3076.4 million by 2035, registering a compound annual growth rate (CAGR) of 15.0% over the forecast period.
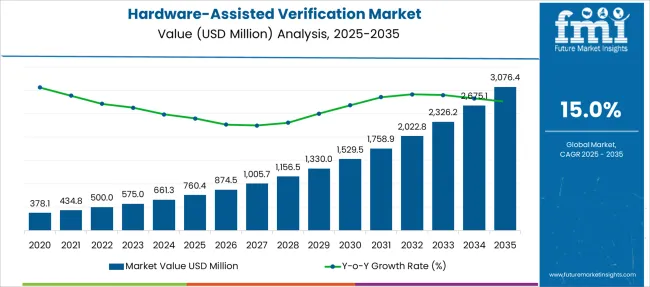
Quick Stats for Hardware-Assisted Verification Market

  • Hardware-Assisted Verification Market Value (2025): USD 760.4 million
  • Hardware-Assisted Verification Market Forecast Value (2035): USD 3076.4 million
  • Hardware-Assisted Verification Market Forecast CAGR: 15.0%
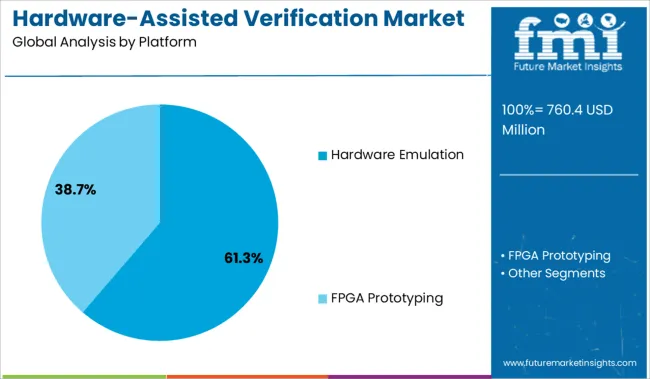
  • Leading Segment in Hardware-Assisted Verification Market in 2025: Hardware Emulation (61.3%)
  • Key Growth Regions in Hardware-Assisted Verification Market: North America, Asia-Pacific, Europe
  • Top Key Players in Hardware-Assisted Verification Market: Synopsys, Inc., Agnisys Inc, Blue Pearl Software Inc, Cadence Design Systems Inc, Aldec Inc, Ansys Inc, EMA Design Automation Inc, Fishtail Design Automation, Hardent, Innovative Logic, Real Intent Inc, Siemens AG, SynaptiCAD Sales Inc, Temento Systems SAS

Hardware Assisted Verification Market

Hardware-Assisted Verification Market Key Takeaways

Metric Value
Hardware-Assisted Verification Market Estimated Value in (2025 E) USD 760.4 million
Hardware-Assisted Verification Market Forecast Value in (2035 F) USD 3076.4 million
Forecast CAGR (2025 to 2035) 15.0%

Why is the Hardware-Assisted Verification Market Growing?

The hardware assisted verification market is witnessing substantial growth as the complexity of semiconductor designs and the demand for faster verification cycles continue to increase. The transition from purely software based verification methods to hardware assisted platforms has been propelled by the need for higher simulation speeds and more accurate system validation.

Industry stakeholders have increasingly adopted hardware emulation and acceleration techniques to reduce time to market and improve product reliability. Future growth is expected to be driven by advancements in semiconductor technology, the rise of AI and IoT applications requiring complex chip designs, and the growing emphasis on reducing verification bottlenecks in the development cycle.

Strategic investments in scalable and flexible hardware verification solutions are paving the way for wider adoption across multiple end use industries, facilitating enhanced verification coverage and improved fault detection.

Segmental Analysis

The market is segmented by Platform and Application, and region. By Platform, the market is divided into Hardware Emulation and FPGA Prototyping. In terms of Application, the market is classified into Consumer Electronics, Automotive, Industrial, Aerospace & Defense, Medical, Telecom, and Others. Regionally, the market is classified into North America, Latin America, Western Europe, Eastern Europe, Balkan & Baltic Countries, Russia & Belarus, Central Asia, East Asia, South Asia & Pacific, and the Middle East & Africa.
Insights into the Hardware Emulation Platform Segment

Hardware Assisted Verification Market Analysis By Platform

When segmented by platform, hardware emulation is projected to hold 61.3% of the total market revenue in 2025, making it the dominant platform segment. This leadership has been enabled by the platform’s ability to deliver significant acceleration in simulation speed compared to traditional software based methods.

Hardware emulation allows comprehensive testing of complex chip designs in real time, which supports early bug detection and validation of system level functionality. The high initial investment and operational complexity associated with hardware emulation have been offset by its capability to handle large scale designs and support extensive debug features.

These advantages have made hardware emulation the preferred choice for semiconductor companies aiming to shorten verification cycles and enhance product quality, consolidating its dominant market position.
Insights into the Consumer Electronics Application Segment

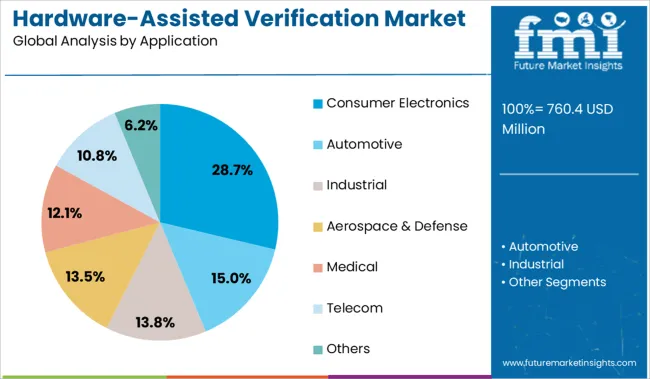
Hardware Assisted Verification Market Analysis By Application

Segmenting by application reveals that consumer electronics is expected to account for 28.7% of the market revenue in 2025, establishing it as the leading application segment. This prominence is due to the rapid evolution and high complexity of consumer electronic devices, including smartphones, wearables, and smart home products, which demand rigorous verification processes.

The pressure to deliver innovative features at faster speeds has pushed consumer electronics companies to invest heavily in hardware assisted verification solutions. The need to ensure functional correctness and reduce post production defects in highly integrated systems has further accelerated adoption.

The combination of high volume production and stringent quality expectations in this industry has driven sustained demand for efficient verification platforms, supporting the segment’s leadership in market share.

What are the Drivers, Restraints, and Key Trends of the Hardware-Assisted Verification Market?

The growing demand for higher verification speed, shorter time to market, and support for complex SoC designs is accelerating the adoption of hardware-assisted verification. Emerging opportunities include FPGA-based prototyping acceleration, machine learning integration, and cloud-enabled verification platforms.

Acceleration Gains from Complexity and Time‑to‑Market Pressure

Design complexity in modern systems‑on‑chip (SoCs), multicore processors, and mixed‑signal chips is driving demand for hardware‑assisted verification. Traditional simulation methods are often too slow to handle large-scale designs in the required release cycles. Hardware acceleration via emulators or FPGA‑based platforms enables teams to run real-world test cases faster and closer to silicon timing, offering earlier bug detection and robust validation. This responsiveness translates directly to shorter development cycles and lower verification costs.

High‑performance compute clusters and enterprise verification teams rely on these tools to meet aggressive schedules and achieve first‑pass silicon success. Standards and methodologies are converging toward hardware‑assisted flows to support complex architectures, which further reinforces adoption in both established and emerging semiconductor firms.

Emerging Use Cases and Flexible Verification Ecosystems Opening New Paths

Growth opportunities center on flexible verification ecosystems and advanced use cases such as hardware/software co‑validation, virtual prototypes, and machine‑learning‑enabled regression analysis. Integration with FPGA prototyping solutions supports real-time system validation, enabling firmware and OS integration earlier in the cycle.

Cloud‑based verification services offer scalable capacity for smaller teams or burst workloads without heavy on‑prem infrastructure. Partnerships between IP vendors, EDA suppliers, and hyperscale cloud providers can deliver on-demand verification platforms.

Also, vertical sectors such as automotive (with ISO 26262 needs), telecom (with 5G and multi‑mode devices), and aerospace require rigorous compliance driving tailored accelerator solutions. Accessible subscription pricing, remote debugging capabilities, and collaborative development portals all help extend adoption across design teams globally.
Analysis of Hardware-Assisted Verification Market By Key Countries

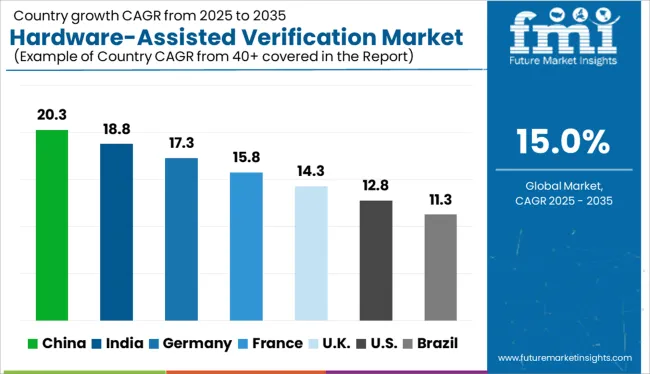
Hardware Assisted Verification Market Cagr Analysis By Country

Countries CAGR
China 20.3%
India 18.8%
Germany 17.3%
France 15.8%
UK 14.3%
USA 12.8%
Brazil 11.3%

The global hardware-assisted verification market is projected to grow at a CAGR of 15.0% from 2025 to 2035, driven by rising chip complexity, time-to-market pressures, and demand for faster design verification cycles. BRICS nations lead this evolution, with China at 20.3% CAGR, fueled by national semiconductor initiatives, local EDA tool development, and AI chip proliferation. India follows at 18.8%, driven by its expanding VLSI talent pool, global design centers, and startup-driven chip innovation.

Germany leads OECD markets at 17.3%, backed by growth in automotive SoCs and industrial automation chips. In contrast, the UK (14.3%) and US (12.8%) exhibit steady growth supported by mature fabless ecosystems, cloud-enabled simulation, and RISC-V based design testing. This report covers detailed analysis of 40+ countries, and the top five countries have been shared as a reference.

Sales Performance Outlook for Hardware-Assisted Verification in China

China leads the global market for hardware-assisted verification, expanding rapidly with a CAGR of 20.3% as semiconductor localization initiatives fuel infrastructure investments. Domestic chipmakers and fabless design houses are ramping up simulation acceleration to handle complex workloads in AI, 5G, and edge computing.

National policies supporting EDA tool innovation and IC design independence have increased demand for emulator platforms. Cloud-based verification-as-a-service is gaining adoption among startups seeking speed and scalability. Advanced SoC and mixed-signal projects require scalable verification that traditional software-based tools cannot handle.

  • Government incentives are directly funding verification infrastructure for homegrown IC projects.
  • AI and automotive semiconductor firms are expanding hybrid simulation capacity.
  • Cloud-based deployment models are appealing to fabless startups in major tech hubs.

Platform Adoption Outlook for Hardware-Assisted Verification in India

India registers an impressive CAGR of 18.8%, driven by growing VLSI design clusters and expanded domestic fabless activity. Universities and private R&D hubs are adopting hardware emulation platforms to support next-gen design verification. Demand is strongest in high-speed networking, automotive chips, and industrial automation segments.

Startups are increasingly using hybrid verification strategies combining FPGA-based prototyping with emulators. National investment in semiconductor infrastructure and IP development has created a stronger ecosystem for EDA adoption. Global EDA providers are localizing toolchains and offering verification-as-a-service to design houses in Bengaluru, Hyderabad, and Noida.
  • Fabless semiconductor startups are turning to hybrid verification for complex SoCs.
  • University-industry partnerships are improving toolchain access for advanced VLSI labs.
  • Cloud-hosted verification is enabling small teams to access high-end emulation tools.

Technology Modernization Forecast for Hardware-Assisted Verification in Germany

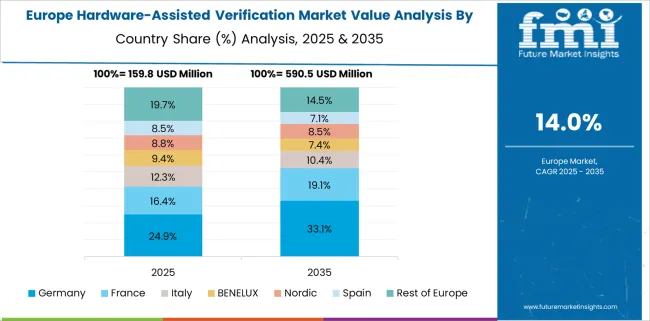
Hardware Assisted Verification Market Europe Country Market Share Analysis, 2025 & 2035

Germany shows a solid CAGR of 17.3%, anchored by strong demand from the automotive and industrial automation sectors. With rising design complexity in ADAS and electric vehicle systems, German firms are prioritizing early-stage hardware-assisted verification. Leading automotive OEMs are integrating in-house FPGA emulation labs to cut verification cycles.

Legacy EDA workflows are being upgraded with advanced acceleration tools, enabling real-time simulation and mixed-signal analysis. Edge computing and IIoT are also adding pressure to validate performance across multiple protocols. Regulatory standards for safety and traceability are increasing the need for transparent, verifiable flows.

  • Automotive OEMs are adopting hardware acceleration for early-stage ADAS validation.
  • Real-time simulation environments are replacing traditional model-based testing.
  • Industrial automation designs now require verification across converging protocols.

Growth and Expansion Outlook for Hardware-Assisted Verification in the United Kingdom

The United Kingdom is poised to expand at a CAGR of 14.3%, benefiting from collaborative R&D and growing interest in sovereign chip design. Universities and R&D consortiums are piloting next-generation EDA solutions with hardware acceleration for signal integrity and memory management in custom silicon.

Demand is led by aerospace, defense, and quantum computing sectors seeking robust early-stage verification frameworks. Verification of high-frequency and low-latency chipsets is a growing bottleneck that hardware-assisted tools are well-positioned to address. Hybrid verification setups combining prototyping boards with high-performance simulators are increasingly popular.
  • Aerospace and defense firms are investing in sovereign verification capacity.
  • Academic labs are testing multi-mode verification for advanced quantum architectures.
  • Startups are integrating modular FPGA platforms into design validation stacks.

Strategic Implementation Forecast for Hardware-Assisted Verification in the United States

Hardware Assisted Verification Market Country Value Analysis

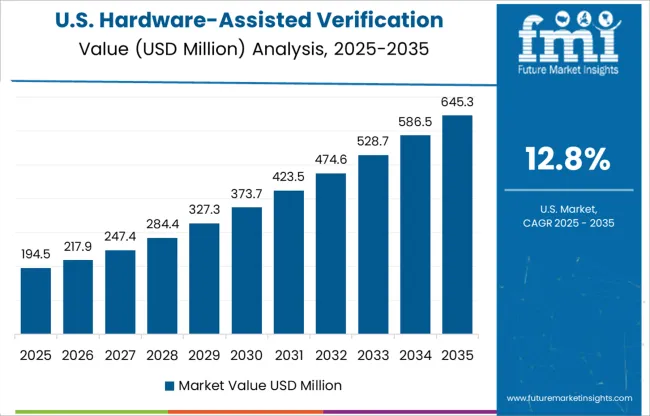
In the United States, the hardware-assisted verification market is set to grow at a CAGR of 12.8%, primarily driven by large design houses tackling SoC complexity in AI and high-performance computing. Companies are optimizing silicon bring-up cycles by deploying FPGA-based prototyping and emulator platforms in parallel with RTL simulation.

Integration with AI-assisted verification workflows and cloud-hosted testbenches has increased flexibility and resource utilization. Verification coverage is now tracked using analytics dashboards in real time to enhance speed and traceability. U.S.-based EDA firms are leading innovation, but mid-size companies are slower to adopt full hardware acceleration due to high capital costs.
  • SoC design complexity is pushing high-volume firms toward real-time hardware simulation.
  • AI-enabled verification analytics are reducing re-spin rates in large chip projects.
  • Cloud-based test environments are improving access for distributed engineering teams.

Competitive Landscape of Hardware-Assisted Verification Market

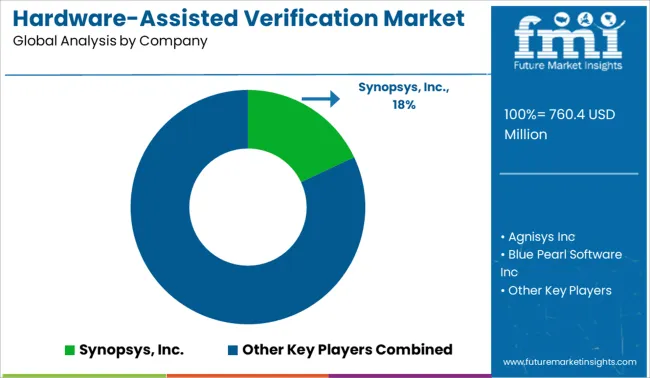
Hardware Assisted Verification Market Analysis By Company

The hardware-assisted verification market is moderately consolidated, led by a handful of EDA (Electronic Design Automation) giants offering high-performance emulation, prototyping, and formal verification solutions. Synopsys, Inc. holds a significant share, driven by its advanced verification platforms, integration with AI-driven design workflows, and strong relationships with semiconductor leaders. Tier 1 competitors like Cadence Design Systems and Siemens AG (Mentor Graphics) provide comprehensive verification suites supporting SoC complexity and time-to-market demands.

Tier 2 players such as Ansys, Aldec, and Real Intent focus on niche tools for clock domain crossing, RTL linting, and formal verification. Emerging vendors like Agnisys, Blue Pearl, and Fishtail target design productivity and automation gaps. Market growth is fueled by AI chips, automotive electronics, and the increasing demand for faster, scalable chip validation.

Key Developments in Hardware-Assisted Verification Market

  • On June 5, 2024, Siemens Digital Industries Software launched Catapult Formal Assert and Formal CoverCheck, adding formal property checking and reachability coverage to its Catapult HLS tool. This enables earlier, mathematically rigorous C++-level verification in SoC design.
  • On February 13, 2025, Synopsys announced via PR Newswire the launch of its HAPS-200 prototyping and ZeBu-200 emulation systems, offering up to 2× runtime performance, 4-8× debug improvements, and scalability beyond 60 billion gates.

Scope of the Report

Item Value
Quantitative Units USD 760.4 Million
Platform Hardware Emulation and FPGA Prototyping
Application Consumer Electronics, Automotive, Industrial, Aerospace & Defense, Medical, Telecom, and Others
Regions Covered North America, Europe, Asia-Pacific, Latin America, Middle East & Africa
Country Covered United States, Canada, Germany, France, United Kingdom, China, Japan, India, Brazil, South Africa
Key Companies Profiled Synopsys, Inc., Agnisys Inc, Blue Pearl Software Inc, Cadence Design Systems Inc, Aldec Inc, Ansys Inc, EMA Design Automation Inc, Fishtail Design Automation, Hardent, Innovative Logic, Real Intent Inc, Siemens AG, SynaptiCAD Sales Inc, and Temento Systems SAS
Additional Attributes Dollar sales by verification tool type, deployment model, and end-use sector; regional demand driven by semiconductor complexity, time-to-market pressure, and R&D investments; innovation in FPGA prototyping, emulation platforms, and co-simulation techniques; cost dynamics influenced by hardware scalability and licensing models; environmental impact of hardware usage and energy consumption; and emerging use cases in AI chip design, automotive electronics, and 5G infrastructure.

Hardware-Assisted Verification Market by Segments

By Platform:

  • Hardware Emulation
  • FPGA Prototyping

By Application:

  • Consumer Electronics
  • Automotive
  • Industrial
  • Aerospace & Defense
  • Medical
  • Telecom
  • Others

By Region:

  • North America
    • USA
    • Canada
    • Mexico
  • Latin America
    • Brazil
    • Chile
    • Rest of Latin America
  • Western Europe
    • Germany
    • UK
    • Italy
    • Spain
    • France
    • Nordic
    • BENELUX
    • Rest of Western Europe
  • Eastern Europe
    • Russia
    • Poland
    • Hungary
    • Balkan & Baltic
    • Rest of Eastern Europe
  • East Asia
    • China
    • Japan
    • South Korea
  • South Asia and Pacific
    • India
    • ASEAN
    • Australia & New Zealand
    • Rest of South Asia and Pacific
  • Middle East & Africa
    • Kingdom of Saudi Arabia
    • Other GCC Countries
    • Turkiye
    • South Africa
    • Other African Union
    • Rest of Middle East & Africa

Table of Content

  1. Executive Summary
    • Global Market Outlook
    • Demand-side Trends
    • Supply-side Trends
    • Technology Roadmap Analysis
    • Analysis and Recommendations
  2. Market Overview
    • Market Coverage / Taxonomy
    • Market Definition / Scope / Limitations
  3. Market Background
    • Market Dynamics
      • Drivers
      • Restraints
      • Opportunity
      • Trends
    • Scenario Forecast
      • Demand in Optimistic Scenario
      • Demand in Likely Scenario
      • Demand in Conservative Scenario
    • Opportunity Map Analysis
    • Product Life Cycle Analysis
    • Supply Chain Analysis
    • Investment Feasibility Matrix
    • Value Chain Analysis
    • PESTLE and Porter’s Analysis
    • Regulatory Landscape
    • Regional Parent Market Outlook
    • Production and Consumption Statistics
    • Import and Export Statistics
  4. Global Market Analysis 2020 to 2024 and Forecast, 2025 to 2035
    • Historical Market Size Value (USD Million) Analysis, 2020 to 2024
    • Current and Future Market Size Value (USD Million) Projections, 2025 to 2035
      • Y-o-Y Growth Trend Analysis
      • Absolute USD Opportunity Analysis
  5. Global Market Pricing Analysis 2020 to 2024 and Forecast 2025 to 2035
  6. Global Market Analysis 2020 to 2024 and Forecast 2025 to 2035, By Platform
    • Introduction / Key Findings
    • Historical Market Size Value (USD Million) Analysis By Platform , 2020 to 2024
    • Current and Future Market Size Value (USD Million) Analysis and Forecast By Platform , 2025 to 2035
      • Hardware Emulation
      • FPGA Prototyping
    • Y-o-Y Growth Trend Analysis By Platform , 2020 to 2024
    • Absolute USD Opportunity Analysis By Platform , 2025 to 2035
  7. Global Market Analysis 2020 to 2024 and Forecast 2025 to 2035, By Application
    • Introduction / Key Findings
    • Historical Market Size Value (USD Million) Analysis By Application, 2020 to 2024
    • Current and Future Market Size Value (USD Million) Analysis and Forecast By Application, 2025 to 2035
      • Consumer Electronics
      • Automotive
      • Industrial
      • Aerospace & Defense
      • Medical
      • Telecom
      • Others
    • Y-o-Y Growth Trend Analysis By Application, 2020 to 2024
    • Absolute USD Opportunity Analysis By Application, 2025 to 2035
  8. Global Market Analysis 2020 to 2024 and Forecast 2025 to 2035, By Region
    • Introduction
    • Historical Market Size Value (USD Million) Analysis By Region, 2020 to 2024
    • Current Market Size Value (USD Million) Analysis and Forecast By Region, 2025 to 2035
      • North America
      • Latin America
      • Western Europe
      • Eastern Europe
      • East Asia
      • South Asia and Pacific
      • Middle East & Africa
    • Market Attractiveness Analysis By Region
  9. North America Market Analysis 2020 to 2024 and Forecast 2025 to 2035, By Country
    • Historical Market Size Value (USD Million) Trend Analysis By Market Taxonomy, 2020 to 2024
    • Market Size Value (USD Million) Forecast By Market Taxonomy, 2025 to 2035
      • By Country
        • USA
        • Canada
        • Mexico
      • By Platform
      • By Application
    • Market Attractiveness Analysis
      • By Country
      • By Platform
      • By Application
    • Key Takeaways
  10. Latin America Market Analysis 2020 to 2024 and Forecast 2025 to 2035, By Country
    • Historical Market Size Value (USD Million) Trend Analysis By Market Taxonomy, 2020 to 2024
    • Market Size Value (USD Million) Forecast By Market Taxonomy, 2025 to 2035
      • By Country
        • Brazil
        • Chile
        • Rest of Latin America
      • By Platform
      • By Application
    • Market Attractiveness Analysis
      • By Country
      • By Platform
      • By Application
    • Key Takeaways
  11. Western Europe Market Analysis 2020 to 2024 and Forecast 2025 to 2035, By Country
    • Historical Market Size Value (USD Million) Trend Analysis By Market Taxonomy, 2020 to 2024
    • Market Size Value (USD Million) Forecast By Market Taxonomy, 2025 to 2035
      • By Country
        • Germany
        • UK
        • Italy
        • Spain
        • France
        • Nordic
        • BENELUX
        • Rest of Western Europe
      • By Platform
      • By Application
    • Market Attractiveness Analysis
      • By Country
      • By Platform
      • By Application
    • Key Takeaways
  12. Eastern Europe Market Analysis 2020 to 2024 and Forecast 2025 to 2035, By Country
    • Historical Market Size Value (USD Million) Trend Analysis By Market Taxonomy, 2020 to 2024
    • Market Size Value (USD Million) Forecast By Market Taxonomy, 2025 to 2035
      • By Country
        • Russia
        • Poland
        • Hungary
        • Balkan & Baltic
        • Rest of Eastern Europe
      • By Platform
      • By Application
    • Market Attractiveness Analysis
      • By Country
      • By Platform
      • By Application
    • Key Takeaways
  13. East Asia Market Analysis 2020 to 2024 and Forecast 2025 to 2035, By Country
    • Historical Market Size Value (USD Million) Trend Analysis By Market Taxonomy, 2020 to 2024
    • Market Size Value (USD Million) Forecast By Market Taxonomy, 2025 to 2035
      • By Country
        • China
        • Japan
        • South Korea
      • By Platform
      • By Application
    • Market Attractiveness Analysis
      • By Country
      • By Platform
      • By Application
    • Key Takeaways
  14. South Asia and Pacific Market Analysis 2020 to 2024 and Forecast 2025 to 2035, By Country
    • Historical Market Size Value (USD Million) Trend Analysis By Market Taxonomy, 2020 to 2024
    • Market Size Value (USD Million) Forecast By Market Taxonomy, 2025 to 2035
      • By Country
        • India
        • ASEAN
        • Australia & New Zealand
        • Rest of South Asia and Pacific
      • By Platform
      • By Application
    • Market Attractiveness Analysis
      • By Country
      • By Platform
      • By Application
    • Key Takeaways
  15. Middle East & Africa Market Analysis 2020 to 2024 and Forecast 2025 to 2035, By Country
    • Historical Market Size Value (USD Million) Trend Analysis By Market Taxonomy, 2020 to 2024
    • Market Size Value (USD Million) Forecast By Market Taxonomy, 2025 to 2035
      • By Country
        • Kingdom of Saudi Arabia
        • Other GCC Countries
        • Turkiye
        • South Africa
        • Other African Union
        • Rest of Middle East & Africa
      • By Platform
      • By Application
    • Market Attractiveness Analysis
      • By Country
      • By Platform
      • By Application
    • Key Takeaways
  16. Key Countries Market Analysis
    • USA
      • Pricing Analysis
      • Market Share Analysis, 2024
        • By Platform
        • By Application
    • Canada
      • Pricing Analysis
      • Market Share Analysis, 2024
        • By Platform
        • By Application
    • Mexico
      • Pricing Analysis
      • Market Share Analysis, 2024
        • By Platform
        • By Application
    • Brazil
      • Pricing Analysis
      • Market Share Analysis, 2024
        • By Platform
        • By Application
    • Chile
      • Pricing Analysis
      • Market Share Analysis, 2024
        • By Platform
        • By Application
    • Germany
      • Pricing Analysis
      • Market Share Analysis, 2024
        • By Platform
        • By Application
    • UK
      • Pricing Analysis
      • Market Share Analysis, 2024
        • By Platform
        • By Application
    • Italy
      • Pricing Analysis
      • Market Share Analysis, 2024
        • By Platform
        • By Application
    • Spain
      • Pricing Analysis
      • Market Share Analysis, 2024
        • By Platform
        • By Application
    • France
      • Pricing Analysis
      • Market Share Analysis, 2024
        • By Platform
        • By Application
    • India
      • Pricing Analysis
      • Market Share Analysis, 2024
        • By Platform
        • By Application
    • ASEAN
      • Pricing Analysis
      • Market Share Analysis, 2024
        • By Platform
        • By Application
    • Australia & New Zealand
      • Pricing Analysis
      • Market Share Analysis, 2024
        • By Platform
        • By Application
    • China
      • Pricing Analysis
      • Market Share Analysis, 2024
        • By Platform
        • By Application
    • Japan
      • Pricing Analysis
      • Market Share Analysis, 2024
        • By Platform
        • By Application
    • South Korea
      • Pricing Analysis
      • Market Share Analysis, 2024
        • By Platform
        • By Application
    • Russia
      • Pricing Analysis
      • Market Share Analysis, 2024
        • By Platform
        • By Application
    • Poland
      • Pricing Analysis
      • Market Share Analysis, 2024
        • By Platform
        • By Application
    • Hungary
      • Pricing Analysis
      • Market Share Analysis, 2024
        • By Platform
        • By Application
    • Kingdom of Saudi Arabia
      • Pricing Analysis
      • Market Share Analysis, 2024
        • By Platform
        • By Application
    • Turkiye
      • Pricing Analysis
      • Market Share Analysis, 2024
        • By Platform
        • By Application
    • South Africa
      • Pricing Analysis
      • Market Share Analysis, 2024
        • By Platform
        • By Application
  17. Market Structure Analysis
    • Competition Dashboard
    • Competition Benchmarking
    • Market Share Analysis of Top Players
      • By Regional
      • By Platform
      • By Application
  18. Competition Analysis
    • Competition Deep Dive
      • Synopsys, Inc.
        • Overview
        • Product Portfolio
        • Profitability by Market Segments (Product/Age /Sales Channel/Region)
        • Sales Footprint
        • Strategy Overview
          • Marketing Strategy
          • Product Strategy
          • Channel Strategy
      • Agnisys Inc
      • Blue Pearl Software Inc
      • Cadence Design Systems Inc
      • Aldec Inc
      • Ansys Inc
      • EMA Design Automation Inc
      • Fishtail Design Automation
      • Hardent
      • Innovative Logic
      • Real Intent Inc
      • Siemens AG
      • SynaptiCAD Sales Inc
      • Temento Systems SAS
  19. Assumptions & Acronyms Used
  20. Research Methodology

List of Tables

  • Table 1: Global Market Value (USD Million) Forecast by Region, 2020-2035
  • Table 2: North America Market Value (USD Million) Forecast by Country, 2020-2035
  • Table 3: Latin America Market Value (USD Million) Forecast by Country, 2020-2035
  • Table 4: Western Europe Market Value (USD Million) Forecast by Country, 2020-2035
  • Table 5: Eastern Europe Market Value (USD Million) Forecast by Country, 2020-2035
  • Table 6: East Asia Market Value (USD Million) Forecast by Country, 2020-2035
  • Table 7: South Asia and Pacific Market Value (USD Million) Forecast by Country, 2020-2035
  • Table 8: Middle East & Africa Market Value (USD Million) Forecast by Country, 2020-2035

List of Figures

  • Figure 1: Global Market Pricing Analysis
  • Figure 2: Global Market Value (USD Million) Forecast 2020-2035
  • Figure 3: Global Market Value (USD Million) Share and BPS Analysis by Region, 2025 and 2035
  • Figure 4: Global Market Y-o-Y Growth Comparison by Region, 2025-2035
  • Figure 5: Global Market Attractiveness Analysis by Region
  • Figure 6: North America Market Incremental USD Opportunity, 2025-2035
  • Figure 7: Latin America Market Incremental USD Opportunity, 2025-2035
  • Figure 8: Western Europe Market Incremental USD Opportunity, 2025-2035
  • Figure 9: Eastern Europe Market Incremental USD Opportunity, 2025-2035
  • Figure 10: East Asia Market Incremental USD Opportunity, 2025-2035
  • Figure 11: South Asia and Pacific Market Incremental USD Opportunity, 2025-2035
  • Figure 12: Middle East & Africa Market Incremental USD Opportunity, 2025-2035
  • Figure 13: North America Market Value Share and BPS Analysis by Country, 2025 and 2035
  • Figure 14: Latin America Market Value Share and BPS Analysis by Country, 2025 and 2035
  • Figure 15: Western Europe Market Value Share and BPS Analysis by Country, 2025 and 2035
  • Figure 16: Eastern Europe Market Value Share and BPS Analysis by Country, 2025 and 2035
  • Figure 17: East Asia Market Value Share and BPS Analysis by Country, 2025 and 2035
  • Figure 18: South Asia and Pacific Market Value Share and BPS Analysis by Country, 2025 and 2035
  • Figure 19: Middle East & Africa Market Value Share and BPS Analysis by Country, 2025 and 2035
  • Figure 20: Global Market - Tier Structure Analysis
  • Figure 21: Global Market - Company Share Analysis

Frequently Asked Questions

How big is the hardware-assisted verification market in 2025?

The global hardware-assisted verification market is estimated to be valued at USD 760.4 million in 2025.

What will be the size of hardware-assisted verification market in 2035?

The market size for the hardware-assisted verification market is projected to reach USD 3,076.4 million by 2035.

How much will be the hardware-assisted verification market growth between 2025 and 2035?

The hardware-assisted verification market is expected to grow at a 15.0% CAGR between 2025 and 2035.

What are the key product types in the hardware-assisted verification market?

The key product types in hardware-assisted verification market are hardware emulation and fpga prototyping.

Which application segment to contribute significant share in the hardware-assisted verification market in 2025?

In terms of application, consumer electronics segment to command 28.7% share in the hardware-assisted verification market in 2025.

Explore Similar Insights

Future Market Insights

Hardware-Assisted Verification Market