Asset Performance Management Market Size and Share Forecast Outlook 2025 to 2035

The Asset Performance Management Market is estimated to be valued at USD 3.0 billion in 2025 and is projected to reach USD 7.6 billion by 2035, registering a compound annual growth rate (CAGR) of 9.6% over the forecast period.
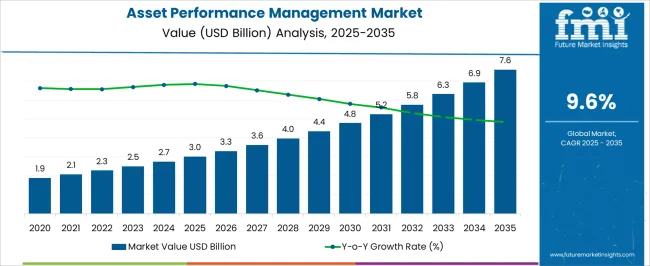
Quick Stats for Asset Performance Management Market

  • Asset Performance Management Market Industry Value (2025): USD 3.0 billion
  • Asset Performance Management Market Forecast Value (2035): USD 7.6 billion
  • Asset Performance Management Market Forecast CAGR: 9.6%
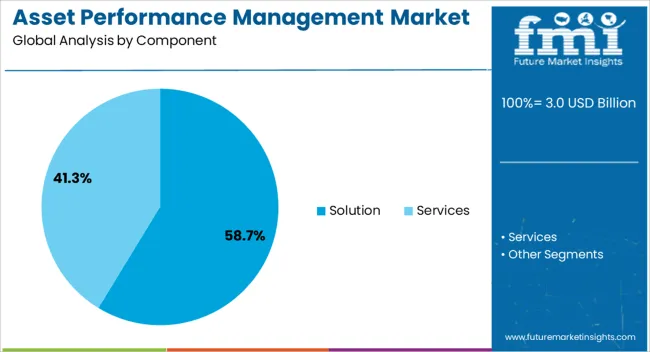
  • Leading Segment in Asset Performance Management Market in 2025: Solution (58.7%)
  • Key Growth Region in Asset Performance Management Market: North America, Asia-Pacific, Europe
  • Top Key Players in Asset Performance Management Market: AVEVA Group, IBM, Bentley Systems, SAP, Detechtion Technologies, Siemens Energy AB, Oracle, ABB, GE Digital, Rockwell Automation, Aspen Technology Inc, ARMS Reliability, Uptake, Fracttal, Urbint, OneTech

Asset Performance Management Market Market Value Analysis

Metric Value
Asset Performance Management Market Estimated Value in (2025 E) USD 3.0 billion
Asset Performance Management Market Forecast Value in (2035 F) USD 7.6 billion
Forecast CAGR (2025 to 2035) 9.6%

Rationale for Segmental Growth in the Asset Performance Management Market

The asset performance management (APM) market is growing steadily, supported by the increasing need for predictive maintenance, operational efficiency, and risk mitigation across industries. Corporate disclosures and industry journals have emphasized that enterprises are prioritizing APM to extend asset lifecycles, reduce unplanned downtime, and improve return on investment.

Advancements in artificial intelligence, machine learning, and IoT integration have transformed APM platforms into intelligent systems capable of real-time monitoring and predictive analytics. This shift has been further accelerated by global energy transition goals and sustainability initiatives, as industries adopt solutions that optimize energy use and reduce environmental impact.

Press releases from technology providers have highlighted new product launches and partnerships aimed at enhancing digital twin capabilities and integrating APM with broader enterprise resource planning systems. Looking forward, market growth will be influenced by cloud adoption, cross-industry digitalization, and the growing importance of data-driven insights to support complex decision-making across very large organizations.
Segmental Analysis

Insights into the Component Segment: Solution

Asset Performance Management Market Analysis By Component

The Solution segment is projected to contribute 58.7% of the asset performance management market revenue in 2025, retaining its dominant position due to the comprehensive value it delivers to enterprises. Growth of this segment has been driven by the ability of APM solutions to provide advanced analytics, predictive maintenance capabilities, and seamless integration with enterprise asset management systems.

Industry updates have underscored the preference for solutions over services, as organizations seek robust platforms that can be customized to meet diverse operational needs. The inclusion of features such as condition monitoring, failure mode analysis, and digital twin integration has further increased adoption rates.

Additionally, the emphasis on reducing equipment failures and optimizing operational costs has made solutions the core offering within the market. As enterprises continue to digitalize critical operations, the Solution segment is expected to maintain its leadership, supported by innovation in AI-powered diagnostics and cross-platform interoperability.
Insights into the Deployment Type Segment: Cloud-based

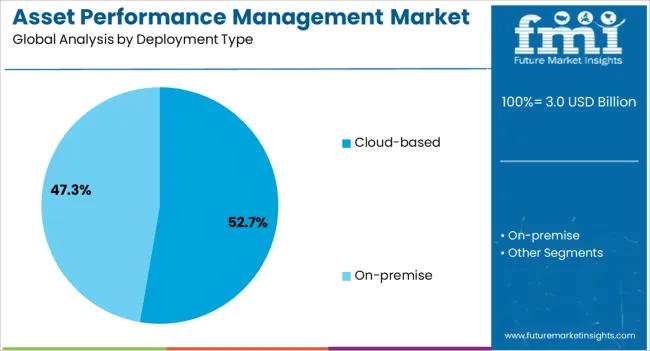
Asset Performance Management Market Analysis By Deployment Type

The Cloud-based segment is projected to hold 52.7% of the asset performance management market revenue in 2025, making it the leading deployment model. Growth of this segment has been fueled by the scalability, flexibility, and cost efficiency that cloud infrastructure offers.

Corporate announcements and analyst presentations have revealed that enterprises are increasingly migrating to cloud platforms to enable real-time data sharing across geographically distributed operations. Cloud-based APM solutions have been preferred for their ability to support remote monitoring, streamline updates, and facilitate collaboration across business units.

Furthermore, the pay-as-you-go model has reduced upfront capital investment, encouraging adoption among organizations of varying sizes. Enhanced data security measures and compliance certifications by cloud providers have also mitigated concerns regarding sensitive operational data. With increasing reliance on digital ecosystems and the rising importance of business continuity, the Cloud-based segment is expected to sustain its dominance in the deployment landscape.
Insights into the Organization Size Segment: Very Large Enterprise (1,000+ employees)

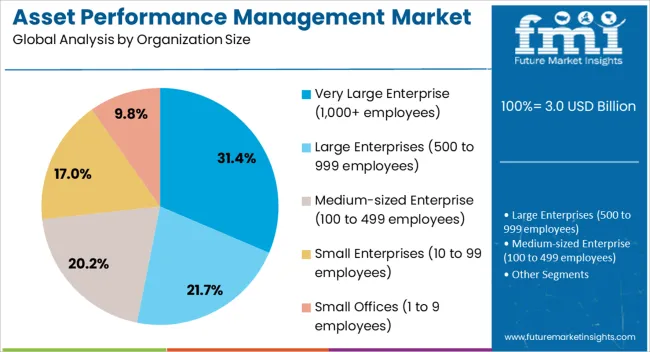
Asset Performance Management Market Analysis By Organization Size

The Very Large Enterprise segment is projected to account for 31.4% of the asset performance management market revenue in 2025, maintaining its leadership among organization size categories. Growth of this segment has been driven by the significant asset base and complex operational structures that large organizations manage.

Industry disclosures have highlighted that very large enterprises prioritize APM adoption to standardize asset monitoring across multiple sites and ensure regulatory compliance. The availability of dedicated budgets and IT infrastructure has facilitated rapid implementation of advanced APM systems in these organizations.

Furthermore, large-scale industrial operations such as energy, manufacturing, and transportation have been early adopters of predictive analytics and digital twin technologies, amplifying demand within this segment. Investor presentations from technology providers have underscored that partnerships with large enterprises are central to scaling APM innovations. As very large organizations continue to emphasize sustainability, efficiency, and safety, the segment is expected to remain the primary driver of APM adoption globally.

Overview of the Asset Performance Management Market

The global APM market is projected to grow rapidly during the next ten years. This is attributable to factors like increasing adoption of digital technologies, growing need for improving operational efficiency, and the focus on asset reliability and performance.

Industries such as manufacturing, energy, utilities, transportation, and healthcare are among the major adopters of APM solutions. Thus, the growth of these sectors is set to eventually create prospects for asset performance management companies.

Key players in the industry offer a range of APM solutions, including predictive maintenance, asset monitoring, risk management, and performance optimization tools. High adoption of these solutions across several industries is set to boost sales growth.

Key Factors Driving Growth in the Asset Performance Management Sector

Several major factors are anticipated to stimulate growth of the APM sector during the assessment period. These include the growing need to manage assets efficiently and optimize the total cost of ownership and increasing emphasis on predictive analytics and AI.

Increased asset complexity is set to create a need for advanced APM solutions through 2035. Similarly, shift towards cloud-based APM solutions and integration with Industrial IoT technologies are anticipated to benefit the industry.

Challenges Limiting Expansion of the Asset Performance Management Market

Despite a robust growth projection, there are certain factors that could potentially limit industry development. These include protecting sensitive asset data and ensuring cybersecurity resilience against evolving threats.

Integrating data from diverse sources and legacy systems poses a challenge in achieving a unified view of asset performance. Compatibility issues with existing legacy systems and infrastructure hamper the seamless integration of APM solutions.

Sustaining continuous monitoring, maintenance, and optimization of asset performance management systems and processes requires dedicated resources and efforts. This can be challenging for companies.

Adhering to complex regulatory requirements and standards across different industries adds complexity to APM implementation. These factors will have a negative effect on the industry's performance and prompt players to use various strategies to address them.

Emerging Opportunities in Asset Performance Management Solutions

Several opportunities are surfacing in the industry that companies must be familiar with. These include adoption of cloud-based APM solutions for scalability and accessibility, integration of APM with industrial IoT for real-time asset monitoring, and growing usage of APM in manufacturing and oil & gas.

Utilizing predictive analytics and AI for accurate asset failure predictions are new innovations happening in asset performance management market. Similarly, incorporation of APM with enterprise systems for seamless data exchange is set to impact asset performance management market size, share, demand, and scope through 2035.

Trends Shaping the Future of the Asset Performance Management Market

The target industry is also witnessing several trends that are impacting its growth trajectory. These include growing popularity of cloud-based APM solutions, integration of AI and machine learning for advanced predictive maintenance, and shift towards outcome-based pricing models for APM services.

Expansion of APM applications to include fleet management and asset tracking is another key growth-impacting trend. Similarly, rise of digital twins for real-time asset simulation and optimization is projected to bode well for the industry.

Emphasis on sustainability and green initiatives in asset management strategies is gaining traction. Several players are also focusing on cybersecurity and data privacy in APM systems.

Historical Performance Versus Future Forecasts for Asset Performance Management

From 2020 to 2025, worldwide demand for asset performance management solutions and services increased at a CAGR of 9.1%, with total revenue reaching USD 2,500 million in 2025. This growth was mostly propelled by increased adoption of APM solutions in diverse sectors.

Industries such as manufacturing, utilities, and healthcare increasingly adopted APM solutions to improve operational efficiency, reduce downtime, and ensure regulatory compliance. This, in turn, boosted APM market growth during the historical period.

Integration of advanced technologies such as IoT, artificial intelligence, and predictive analytics into asset performance management systems enabled organizations to monitor assets in real-time. This allowed them to predict maintenance needs and optimize efficiency.

Future Asset Performance Management Market Demand Outlook

Looking ahead, the global APM industry is anticipated to register a CAGR of 9.7% from 2025 to 2035. Ongoing digital transformation initiatives, increasing focus on asset reliability, and the adoption of innovative technologies are projected to spearhead this market growth of asset performance management solutions.

Factors such as the integration of AI, machine learning, and IoT into APM solutions are set to facilitate sales growth. Subsequently, the increasing popularity and adoption of cloud-based offerings are anticipated to fuel demand.
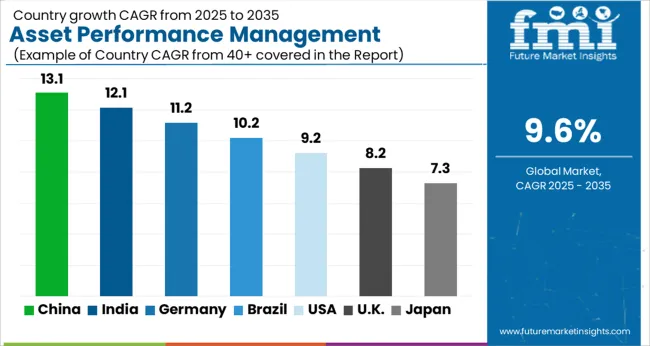
Country-wise Insights into Asset Performance Management Adoption

Asset Performance Management Market Cagr Analysis By Country

The section below provides a country-wise and regional analysis of APM sector. While the United States and other developed nations dominate the industry, emerging nations like China and India are becoming lucrative pockets for companies.

High adoption of digitalization and other novel technologies is set to improve asset management market size in North America. Growing industrial sector, penetration of industrial automation, and favorable government support are set to create opportunities for asset performance management service providers in APAC. Similarly, escalating focus on cost reduction & efficiency and surging demand for predictive maintenance are set to enhance the asset management market size in Europe.

Growth Outlook by Key Countries

Rapid Digitalization Creating Growth Prospects in the United States

The United States asset performance management industry is poised to exhibit a CAGR of 7.9% during the assessment period. It is set to account for a value share of 72.8% in the North American industry in 2025, fueled by increased digitalization and focus on optimizing operational efficiency.

High penetration of digitization across various industries is leading to an increased need for advanced solutions that monitor, analyze, and optimize asset performance in real-time. This is set to propel demand for asset performance management solutions in the United States.

The digital transformation is fueled by the integration of IoT devices, AI algorithms, and data analytics platforms into APM systems. This integration enables companies to gather auditable insights and make informed decisions about their assets.

The increasing focus on optimizing operational efficiency and reducing costs is another key factor propelling APM demand. APM provides tools and capabilities to proactively manage assets, implement preventive maintenance strategies, and extend asset life cycles, improving organizational efficiency and cost savings.

India Turning into the Land of Opportunities for APM Solution Providers

The asset performance management industry in India is set to record a robust CAGR of 12.8% during the forecast period. This can be attributed to increasing adoption of industrial automation and IoT Technologies.

In various industries, there is a growing demand for technology for effectively monitoring and managing assets, such as industrial automation. The use of Internet of Things (IoT) technologies enables real-time data collection, analysis, and predictive maintenance, improving the performance of resources.

Different initiatives related to digital transformation and Industry 4.0 are gaining popularity in India. Companies are realizing the importance of incorporating advanced technologies such as cloud computing, artificial intelligence, and machine learning into their resource management strategies to improve competitiveness, productivity, and sustainability.

Industrial Digitization and Favorable Government Support Boosting China

China’s APM sector is projected to thrive at a CAGR of 12.1% during the next decade. It is projected to hold a dominant share of 38.7% in the East Asia industry in 2025, propelled by high penetration of industrial digitalization and favorable government support.

The vast network of interconnected systems and resources has been created by China's growing industrial digitization, making efficient monitoring and control solutions urgently necessary. In order to increase operational efficiency and decrease downtime, APM provides real-time visibility into asset performance, predictive maintenance capabilities, and data-driven decision-making tools.

The combination of strong government backing and widespread digitization in the manufacturing sector is set to boost sales growth in the country. APM has gained prominence in China, and businesses across all sectors are beginning to recognize its value in maximizing asset performance and boosting profitability.

Category-wise Analysis of Asset Performance Management Technologies

The section below throws some light on key segments along with their estimated growth rates. This information can be essential for companies to assess different segments and their impact on the industry growth.

Based on components, the solutions segment dominates the industry, accounting for a revenue share of 58.7% in 2025. This can be attributed to high adoption of asset performance management solutions across several industries to optimize asset performance and maximize ROI.

The cloud segment is set to dominate the industry in terms of deployment type, registering a CAGR of 11.3%. This is due to multiple advantages offered by cloud-based APM, including cost-effectiveness and scalability.

APM Solutions Leading the Industry

Growth Outlook by Component

Component Value CAGR
Solution 9.1%
Services 10.9%

By component, solutions segment is estimated to account for a value share of 58.7% in 2025 and further advance at a CAGR of 9.1% through 2035. This is due to growing adoption of APM solutions, including asset strategy management and predictive asset management, across diverse industries.

Businesses are gradually understanding the importance of tailored asset performance management solutions that manage their precise asset control challenges and necessities. This is anticipated to continue to propel their demand.

Industry-particular APM solutions offer specialized capabilities, compliance management gear, and predictive insights. Thus, they cater to the unique needs of sectors, including manufacturing, power, utilities, transportation, and healthcare.

Integrated asset performance management solutions that incorporate numerous functionalities like asset monitoring and overall performance optimization are gaining recognition. They provide a holistic technique to asset management, allowing corporations to streamline operations, lessen downtime, and obtain valuable financial savings.

Cloud-based APM Witnessing High Popularity and Adoption

Growth Outlook by Deployment Type

Deployment Type Value CAGR
Cloud-based 11.3%
On-premise 9.6%

Demand for cloud-based APM is projected to grow rapidly, holding 52.7% of the asset performance management market share in 2025. For the next ten years, a robust CAGR of 11.3% has been estimated for the target segment.

Cloud-based APM is gaining high popularity due to its scalability, accessibility, and cost-effectiveness. Similarly, its ability to integrate advanced analytics and AI capabilities seamlessly is contributing to its high adoption across industries.

Cloud-based asset performance management systems are easily scalable. They can be scaled up or down for accommodating developing asset portfolios and evolving business necessities without giant infrastructure investments.

Cloud deployment users will get access to asset performance control functionalities from everywhere with a web connection. This allows for greater flexibility as employees can monitor and manage assets from any remote location.

Organizations are anticipated to benefit from reduced early charges, lower upkeep fees, and predictable subscription-primarily based pricing models supplied with the aid of cloud vendors. This cost-efficient technique permits companies to allocate sources more strategically and reap a quicker return on funding (ROI).
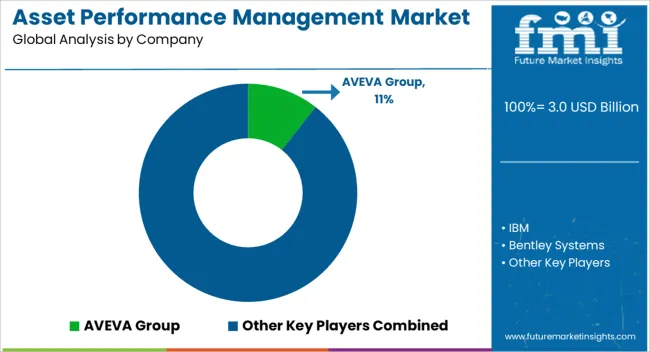
Competitive Landscape of the Asset Performance Management Market

Asset Performance Management Market Analysis By Company

Key players are focused on constantly innovating and developing advanced APM solutions that use technologies like IoT, AI, and predictive analytics to offer enhanced functionalities and performance monitoring capabilities. Also, offering scalable and flexible solutions that can accommodate varying asset portfolios, business sizes, and evolving operational needs will help companies stay ahead.

Recent Developments in the APM Industry

Date and Approach Description
April 2025, Partnership Total Resource Management (TRM), Inc., an Alexandria-based prominent provider of end-to-end reliability and maintenance solutions, partnered with Aspen Technology. This partnership will allow TRM to offer Aspen Mtell, an asset performance optimization solution that uses predictive analytics, artificial intelligence, and machine learning to help TRM's clients make actionable decisions to prevent maintenance failures.
January 2025, Partnership Netherlands-based Cenosco, a leading provider of asset integrity management software, partnered with MaxGrip, an internationally renowned consultancy firm specializing in APM. The partnership aims to enhance client capabilities in asset integrity management, enabling them to realize their full potential.
August 2025, Partnership Germany-based Software AG and SAP partnered to integrate SAP's Intelligent Asset Management Suite, including its APM solution, with Software AG's Cumulocity IoT platform. The partnership aims to provide a comprehensive, closed-loop APM solution that combines SAP's expertise in APM with Software AG's Cumulocity IoT platform.

Key Strategies Employed by Leading Asset Performance Management Providers

Technological Innovation

Top companies are focusing on technological innovation by investing in research and development to create advanced solutions. This includes utilizing technologies like IoT (Internet of Things), AI (Artificial Intelligence), machine learning, and predictive analytics to enhance performance monitoring, maintenance strategies, and decision-making processes.

Partnerships and Collaborations

Collaboration is a key strategy for players in the APM industry. They form strategic partnerships with technology providers, system integrators, and industry experts to complement their offerings, access new regions, and use expertise in specific domains. Partnerships also facilitate the integration of diverse technologies and solutions, allowing players to provide comprehensive APM solutions that address a wide range of customer requirements.

Customer-centric Approach

Players adopt a customer-centric approach by prioritizing customer needs and experiences. This includes providing personalized solutions, excellent customer support, training programs, and ongoing engagement to ensure customer satisfaction and loyalty. By understanding and addressing customer pain points, players can build strong relationships, gain customer trust, and maintain a competitive edge in the industry.

Data Security and Compliance

Ensuring data security and compliance is a critical strategy for players in the APM industry. They implement robust security measures, encryption protocols, access controls, and compliance with regulatory standards to protect sensitive asset data. By maintaining data integrity, confidentiality, and regulatory compliance, players build trust with customers and demonstrate their commitment to data security and privacy.

Key Players Profiled in the Asset Performance Management Market Analysis

  • AVEVA Group
  • IBM
  • Bentley Systems
  • SAP
  • Detechtion Technologies
  • Siemens Energy
  • Oracle
  • ABB
  • GE Digital
  • Uptake
  • ARMS Reliability
  • Upkeep
  • Atonix Digital
  • MentorAPM
  • Aspen Technology, Inc.

Segmentation of the Global Asset Performance Management Market

By Component:

Based on components, the industry is bifurcated into solutions and services. To get a broader picture of the industry, solutions are further classified into asset strategy management, asset reliability management, predictive asset management, and others. A detailed analysis of sub-segments of services has also been added to the report, based on managed services and professional services.

By Deployment Type:

In terms of deployment type, the industry is segmented into cloud-based and on-premises.

By Organization Size:

By organization size, the report is categorized into small offices (1 to 9 employees), small enterprises (10 to 99 employees), medium-sized enterprises (100 to 499 employees), large enterprises (500 to 999 employees), and very large enterprises (1,000+ employees).

By Industry:

Based on end-use industry, the market is segmented into finance (banking, insurance, investment/securities), manufacturing & resources (discrete manufacturing, process manufacturing, resource industries, agriculture), distribution services (retail, wholesale, transportation /logistics services, warehousing & storage, shipping), services (IT/professional services, consumer & personal services, media, entertainment & publishing, travel & hospitality, legal services), public sector (government (state/central), education, healthcare, aerospace & defense, non-profit), and infrastructure (telecommunication, energy & utilities, building & construction).

By Region:

Analysis of the target industry has been carried out in key countries of North America, Latin America, East Asia, South Asia & Pacific, Western Europe, Eastern Europe, and the Middle East & Africa.

Frequently Asked Questions

How big is the asset performance management market in 2025?

The global asset performance management market is estimated to be valued at USD 3.0 billion in 2025.

What will be the size of asset performance management market in 2035?

The market size for the asset performance management market is projected to reach USD 7.6 billion by 2035.

How much will be the asset performance management market growth between 2025 and 2035?

The asset performance management market is expected to grow at a 9.6% CAGR between 2025 and 2035.

What are the key product types in the asset performance management market?

The key product types in asset performance management market are solution, _asset strategy management, _asset reliability management, _predictive asset management, _others, services, _managed services and _professional services.

Which deployment type segment to contribute significant share in the asset performance management market in 2025?

In terms of deployment type, cloud-based segment to command 52.7% share in the asset performance management market in 2025.

Table of Content

  1. Executive Summary
    • Global Market Outlook
    • Demand-side Trends
    • Supply-side Trends
    • Technology Roadmap Analysis
    • Analysis and Recommendations
  2. Market Overview
    • Market Coverage / Taxonomy
    • Market Definition / Scope / Limitations
  3. Market Background
    • Market Dynamics
      • Drivers
      • Restraints
      • Opportunity
      • Trends
    • Scenario Forecast
      • Demand in Optimistic Scenario
      • Demand in Likely Scenario
      • Demand in Conservative Scenario
    • Opportunity Map Analysis
    • Product Life Cycle Analysis
    • Supply Chain Analysis
    • Investment Feasibility Matrix
    • Value Chain Analysis
    • PESTLE and Porter’s Analysis
    • Regulatory Landscape
    • Regional Parent Market Outlook
    • Production and Consumption Statistics
    • Import and Export Statistics
  4. Global Market Analysis 2020 to 2024 and Forecast, 2025 to 2035
    • Historical Market Size Value (USD Million) Analysis, 2020 to 2024
    • Current and Future Market Size Value (USD Million) Projections, 2025 to 2035
      • Y-o-Y Growth Trend Analysis
      • Absolute $ Opportunity Analysis
  5. Global Market Pricing Analysis 2020 to 2024 and Forecast 2025 to 2035
  6. Global Market Analysis 2020 to 2024 and Forecast 2025 to 2035, By Component
    • Introduction / Key Findings
    • Historical Market Size Value (USD Million) Analysis By Component , 2020 to 2024
    • Current and Future Market Size Value (USD Million) Analysis and Forecast By Component , 2025 to 2035
      • Solution
        • Asset Strategy Management
        • Asset Reliability Management
        • Predictive Asset Management
        • Others
      • Services
        • Managed Services
        • Professional Services
    • Y-o-Y Growth Trend Analysis By Component , 2020 to 2024
    • Absolute $ Opportunity Analysis By Component , 2025 to 2035
  7. Global Market Analysis 2020 to 2024 and Forecast 2025 to 2035, By Deployment Type
    • Introduction / Key Findings
    • Historical Market Size Value (USD Million) Analysis By Deployment Type, 2020 to 2024
    • Current and Future Market Size Value (USD Million) Analysis and Forecast By Deployment Type, 2025 to 2035
      • Cloud-based
      • On-premise
    • Y-o-Y Growth Trend Analysis By Deployment Type, 2020 to 2024
    • Absolute $ Opportunity Analysis By Deployment Type, 2025 to 2035
  8. Global Market Analysis 2020 to 2024 and Forecast 2025 to 2035, By Organization Size
    • Introduction / Key Findings
    • Historical Market Size Value (USD Million) Analysis By Organization Size, 2020 to 2024
    • Current and Future Market Size Value (USD Million) Analysis and Forecast By Organization Size, 2025 to 2035
      • Very Large Enterprise (1,000+ employees)
      • Large Enterprises (500 to 999 employees)
      • Medium-sized Enterprise (100 to 499 employees)
      • Small Enterprises (10 to 99 employees)
      • Small Offices (1 to 9 employees)
    • Y-o-Y Growth Trend Analysis By Organization Size, 2020 to 2024
    • Absolute $ Opportunity Analysis By Organization Size, 2025 to 2035
  9. Global Market Analysis 2020 to 2024 and Forecast 2025 to 2035, By Industry
    • Introduction / Key Findings
    • Historical Market Size Value (USD Million) Analysis By Industry, 2020 to 2024
    • Current and Future Market Size Value (USD Million) Analysis and Forecast By Industry, 2025 to 2035
      • Manufacturing & Resources
      • Finance
      • Distribution Services
      • Services
      • Public Sector
      • Infrastructure
    • Y-o-Y Growth Trend Analysis By Industry, 2020 to 2024
    • Absolute $ Opportunity Analysis By Industry, 2025 to 2035
  10. Global Market Analysis 2020 to 2024 and Forecast 2025 to 2035, By Region
    • Introduction
    • Historical Market Size Value (USD Million) Analysis By Region, 2020 to 2024
    • Current Market Size Value (USD Million) Analysis and Forecast By Region, 2025 to 2035
      • North America
      • Latin America
      • Western Europe
      • Eastern Europe
      • East Asia
      • South Asia and Pacific
      • Middle East & Africa
    • Market Attractiveness Analysis By Region
  11. North America Market Analysis 2020 to 2024 and Forecast 2025 to 2035, By Country
    • Historical Market Size Value (USD Million) Trend Analysis By Market Taxonomy, 2020 to 2024
    • Market Size Value (USD Million) Forecast By Market Taxonomy, 2025 to 2035
      • By Country
        • USA
        • Canada
        • Mexico
      • By Component
      • By Deployment Type
      • By Organization Size
      • By Industry
    • Market Attractiveness Analysis
      • By Country
      • By Component
      • By Deployment Type
      • By Organization Size
      • By Industry
    • Key Takeaways
  12. Latin America Market Analysis 2020 to 2024 and Forecast 2025 to 2035, By Country
    • Historical Market Size Value (USD Million) Trend Analysis By Market Taxonomy, 2020 to 2024
    • Market Size Value (USD Million) Forecast By Market Taxonomy, 2025 to 2035
      • By Country
        • Brazil
        • Chile
        • Rest of Latin America
      • By Component
      • By Deployment Type
      • By Organization Size
      • By Industry
    • Market Attractiveness Analysis
      • By Country
      • By Component
      • By Deployment Type
      • By Organization Size
      • By Industry
    • Key Takeaways
  13. Western Europe Market Analysis 2020 to 2024 and Forecast 2025 to 2035, By Country
    • Historical Market Size Value (USD Million) Trend Analysis By Market Taxonomy, 2020 to 2024
    • Market Size Value (USD Million) Forecast By Market Taxonomy, 2025 to 2035
      • By Country
        • Germany
        • UK
        • Italy
        • Spain
        • France
        • Nordic
        • BENELUX
        • Rest of Western Europe
      • By Component
      • By Deployment Type
      • By Organization Size
      • By Industry
    • Market Attractiveness Analysis
      • By Country
      • By Component
      • By Deployment Type
      • By Organization Size
      • By Industry
    • Key Takeaways
  14. Eastern Europe Market Analysis 2020 to 2024 and Forecast 2025 to 2035, By Country
    • Historical Market Size Value (USD Million) Trend Analysis By Market Taxonomy, 2020 to 2024
    • Market Size Value (USD Million) Forecast By Market Taxonomy, 2025 to 2035
      • By Country
        • Russia
        • Poland
        • Hungary
        • Balkan & Baltic
        • Rest of Eastern Europe
      • By Component
      • By Deployment Type
      • By Organization Size
      • By Industry
    • Market Attractiveness Analysis
      • By Country
      • By Component
      • By Deployment Type
      • By Organization Size
      • By Industry
    • Key Takeaways
  15. East Asia Market Analysis 2020 to 2024 and Forecast 2025 to 2035, By Country
    • Historical Market Size Value (USD Million) Trend Analysis By Market Taxonomy, 2020 to 2024
    • Market Size Value (USD Million) Forecast By Market Taxonomy, 2025 to 2035
      • By Country
        • China
        • Japan
        • South Korea
      • By Component
      • By Deployment Type
      • By Organization Size
      • By Industry
    • Market Attractiveness Analysis
      • By Country
      • By Component
      • By Deployment Type
      • By Organization Size
      • By Industry
    • Key Takeaways
  16. South Asia and Pacific Market Analysis 2020 to 2024 and Forecast 2025 to 2035, By Country
    • Historical Market Size Value (USD Million) Trend Analysis By Market Taxonomy, 2020 to 2024
    • Market Size Value (USD Million) Forecast By Market Taxonomy, 2025 to 2035
      • By Country
        • India
        • ASEAN
        • Australia & New Zealand
        • Rest of South Asia and Pacific
      • By Component
      • By Deployment Type
      • By Organization Size
      • By Industry
    • Market Attractiveness Analysis
      • By Country
      • By Component
      • By Deployment Type
      • By Organization Size
      • By Industry
    • Key Takeaways
  17. Middle East & Africa Market Analysis 2020 to 2024 and Forecast 2025 to 2035, By Country
    • Historical Market Size Value (USD Million) Trend Analysis By Market Taxonomy, 2020 to 2024
    • Market Size Value (USD Million) Forecast By Market Taxonomy, 2025 to 2035
      • By Country
        • Kingdom of Saudi Arabia
        • Other GCC Countries
        • Turkiye
        • South Africa
        • Other African Union
        • Rest of Middle East & Africa
      • By Component
      • By Deployment Type
      • By Organization Size
      • By Industry
    • Market Attractiveness Analysis
      • By Country
      • By Component
      • By Deployment Type
      • By Organization Size
      • By Industry
    • Key Takeaways
  18. Key Countries Market Analysis
    • USA
      • Pricing Analysis
      • Market Share Analysis, 2024
        • By Component
        • By Deployment Type
        • By Organization Size
        • By Industry
    • Canada
      • Pricing Analysis
      • Market Share Analysis, 2024
        • By Component
        • By Deployment Type
        • By Organization Size
        • By Industry
    • Mexico
      • Pricing Analysis
      • Market Share Analysis, 2024
        • By Component
        • By Deployment Type
        • By Organization Size
        • By Industry
    • Brazil
      • Pricing Analysis
      • Market Share Analysis, 2024
        • By Component
        • By Deployment Type
        • By Organization Size
        • By Industry
    • Chile
      • Pricing Analysis
      • Market Share Analysis, 2024
        • By Component
        • By Deployment Type
        • By Organization Size
        • By Industry
    • Germany
      • Pricing Analysis
      • Market Share Analysis, 2024
        • By Component
        • By Deployment Type
        • By Organization Size
        • By Industry
    • UK
      • Pricing Analysis
      • Market Share Analysis, 2024
        • By Component
        • By Deployment Type
        • By Organization Size
        • By Industry
    • Italy
      • Pricing Analysis
      • Market Share Analysis, 2024
        • By Component
        • By Deployment Type
        • By Organization Size
        • By Industry
    • Spain
      • Pricing Analysis
      • Market Share Analysis, 2024
        • By Component
        • By Deployment Type
        • By Organization Size
        • By Industry
    • France
      • Pricing Analysis
      • Market Share Analysis, 2024
        • By Component
        • By Deployment Type
        • By Organization Size
        • By Industry
    • India
      • Pricing Analysis
      • Market Share Analysis, 2024
        • By Component
        • By Deployment Type
        • By Organization Size
        • By Industry
    • ASEAN
      • Pricing Analysis
      • Market Share Analysis, 2024
        • By Component
        • By Deployment Type
        • By Organization Size
        • By Industry
    • Australia & New Zealand
      • Pricing Analysis
      • Market Share Analysis, 2024
        • By Component
        • By Deployment Type
        • By Organization Size
        • By Industry
    • China
      • Pricing Analysis
      • Market Share Analysis, 2024
        • By Component
        • By Deployment Type
        • By Organization Size
        • By Industry
    • Japan
      • Pricing Analysis
      • Market Share Analysis, 2024
        • By Component
        • By Deployment Type
        • By Organization Size
        • By Industry
    • South Korea
      • Pricing Analysis
      • Market Share Analysis, 2024
        • By Component
        • By Deployment Type
        • By Organization Size
        • By Industry
    • Russia
      • Pricing Analysis
      • Market Share Analysis, 2024
        • By Component
        • By Deployment Type
        • By Organization Size
        • By Industry
    • Poland
      • Pricing Analysis
      • Market Share Analysis, 2024
        • By Component
        • By Deployment Type
        • By Organization Size
        • By Industry
    • Hungary
      • Pricing Analysis
      • Market Share Analysis, 2024
        • By Component
        • By Deployment Type
        • By Organization Size
        • By Industry
    • Kingdom of Saudi Arabia
      • Pricing Analysis
      • Market Share Analysis, 2024
        • By Component
        • By Deployment Type
        • By Organization Size
        • By Industry
    • Turkiye
      • Pricing Analysis
      • Market Share Analysis, 2024
        • By Component
        • By Deployment Type
        • By Organization Size
        • By Industry
    • South Africa
      • Pricing Analysis
      • Market Share Analysis, 2024
        • By Component
        • By Deployment Type
        • By Organization Size
        • By Industry
  19. Market Structure Analysis
    • Competition Dashboard
    • Competition Benchmarking
    • Market Share Analysis of Top Players
      • By Regional
      • By Component
      • By Deployment Type
      • By Organization Size
      • By Industry
  20. Competition Analysis
    • Competition Deep Dive
      • AVEVA Group
        • Overview
        • Product Portfolio
        • Profitability by Market Segments (Product/Age /Sales Channel/Region)
        • Sales Footprint
        • Strategy Overview
          • Marketing Strategy
          • Product Strategy
          • Channel Strategy
      • IBM
      • Bentley Systems
      • SAP
      • Detechtion Technologies
      • Siemens Energy AB
      • Oracle
      • ABB
      • GE Digital
      • Rockwell Automation
      • Aspen Technology Inc
      • ARMS Reliability
      • Uptake
      • Fracttal
      • Urbint
      • OneTech
  21. Assumptions & Acronyms Used
  22. Research Methodology

List of Tables

  • Table 1: Global Market Value (USD Million) Forecast by Region, 2020 to 2035
  • Table 2: Global Market Value (USD Million) Forecast by Component , 2020 to 2035
  • Table 3: Global Market Value (USD Million) Forecast by Deployment Type, 2020 to 2035
  • Table 4: Global Market Value (USD Million) Forecast by Organization Size, 2020 to 2035
  • Table 5: Global Market Value (USD Million) Forecast by Industry, 2020 to 2035
  • Table 6: North America Market Value (USD Million) Forecast by Country, 2020 to 2035
  • Table 7: North America Market Value (USD Million) Forecast by Component , 2020 to 2035
  • Table 8: North America Market Value (USD Million) Forecast by Deployment Type, 2020 to 2035
  • Table 9: North America Market Value (USD Million) Forecast by Organization Size, 2020 to 2035
  • Table 10: North America Market Value (USD Million) Forecast by Industry, 2020 to 2035
  • Table 11: Latin America Market Value (USD Million) Forecast by Country, 2020 to 2035
  • Table 12: Latin America Market Value (USD Million) Forecast by Component , 2020 to 2035
  • Table 13: Latin America Market Value (USD Million) Forecast by Deployment Type, 2020 to 2035
  • Table 14: Latin America Market Value (USD Million) Forecast by Organization Size, 2020 to 2035
  • Table 15: Latin America Market Value (USD Million) Forecast by Industry, 2020 to 2035
  • Table 16: Western Europe Market Value (USD Million) Forecast by Country, 2020 to 2035
  • Table 17: Western Europe Market Value (USD Million) Forecast by Component , 2020 to 2035
  • Table 18: Western Europe Market Value (USD Million) Forecast by Deployment Type, 2020 to 2035
  • Table 19: Western Europe Market Value (USD Million) Forecast by Organization Size, 2020 to 2035
  • Table 20: Western Europe Market Value (USD Million) Forecast by Industry, 2020 to 2035
  • Table 21: Eastern Europe Market Value (USD Million) Forecast by Country, 2020 to 2035
  • Table 22: Eastern Europe Market Value (USD Million) Forecast by Component , 2020 to 2035
  • Table 23: Eastern Europe Market Value (USD Million) Forecast by Deployment Type, 2020 to 2035
  • Table 24: Eastern Europe Market Value (USD Million) Forecast by Organization Size, 2020 to 2035
  • Table 25: Eastern Europe Market Value (USD Million) Forecast by Industry, 2020 to 2035
  • Table 26: East Asia Market Value (USD Million) Forecast by Country, 2020 to 2035
  • Table 27: East Asia Market Value (USD Million) Forecast by Component , 2020 to 2035
  • Table 28: East Asia Market Value (USD Million) Forecast by Deployment Type, 2020 to 2035
  • Table 29: East Asia Market Value (USD Million) Forecast by Organization Size, 2020 to 2035
  • Table 30: East Asia Market Value (USD Million) Forecast by Industry, 2020 to 2035
  • Table 31: South Asia and Pacific Market Value (USD Million) Forecast by Country, 2020 to 2035
  • Table 32: South Asia and Pacific Market Value (USD Million) Forecast by Component , 2020 to 2035
  • Table 33: South Asia and Pacific Market Value (USD Million) Forecast by Deployment Type, 2020 to 2035
  • Table 34: South Asia and Pacific Market Value (USD Million) Forecast by Organization Size, 2020 to 2035
  • Table 35: South Asia and Pacific Market Value (USD Million) Forecast by Industry, 2020 to 2035
  • Table 36: Middle East & Africa Market Value (USD Million) Forecast by Country, 2020 to 2035
  • Table 37: Middle East & Africa Market Value (USD Million) Forecast by Component , 2020 to 2035
  • Table 38: Middle East & Africa Market Value (USD Million) Forecast by Deployment Type, 2020 to 2035
  • Table 39: Middle East & Africa Market Value (USD Million) Forecast by Organization Size, 2020 to 2035
  • Table 40: Middle East & Africa Market Value (USD Million) Forecast by Industry, 2020 to 2035

List of Figures

  • Figure 1: Global Market Pricing Analysis
  • Figure 2: Global Market Value (USD Million) Forecast 2020 to 2035
  • Figure 3: Global Market Value Share and BPS Analysis by Component , 2025 and 2035
  • Figure 4: Global Market Y-o-Y Growth Comparison by Component , 2025 to 2035
  • Figure 5: Global Market Attractiveness Analysis by Component
  • Figure 6: Global Market Value Share and BPS Analysis by Deployment Type, 2025 and 2035
  • Figure 7: Global Market Y-o-Y Growth Comparison by Deployment Type, 2025 to 2035
  • Figure 8: Global Market Attractiveness Analysis by Deployment Type
  • Figure 9: Global Market Value Share and BPS Analysis by Organization Size, 2025 and 2035
  • Figure 10: Global Market Y-o-Y Growth Comparison by Organization Size, 2025 to 2035
  • Figure 11: Global Market Attractiveness Analysis by Organization Size
  • Figure 12: Global Market Value Share and BPS Analysis by Industry, 2025 and 2035
  • Figure 13: Global Market Y-o-Y Growth Comparison by Industry, 2025 to 2035
  • Figure 14: Global Market Attractiveness Analysis by Industry
  • Figure 15: Global Market Value (USD Million) Share and BPS Analysis by Region, 2025 and 2035
  • Figure 16: Global Market Y-o-Y Growth Comparison by Region, 2025 to 2035
  • Figure 17: Global Market Attractiveness Analysis by Region
  • Figure 18: North America Market Incremental Dollar Opportunity, 2025 to 2035
  • Figure 19: Latin America Market Incremental Dollar Opportunity, 2025 to 2035
  • Figure 20: Western Europe Market Incremental Dollar Opportunity, 2025 to 2035
  • Figure 21: Eastern Europe Market Incremental Dollar Opportunity, 2025 to 2035
  • Figure 22: East Asia Market Incremental Dollar Opportunity, 2025 to 2035
  • Figure 23: South Asia and Pacific Market Incremental Dollar Opportunity, 2025 to 2035
  • Figure 24: Middle East & Africa Market Incremental Dollar Opportunity, 2025 to 2035
  • Figure 25: North America Market Value Share and BPS Analysis by Country, 2025 and 2035
  • Figure 26: North America Market Value Share and BPS Analysis by Component , 2025 and 2035
  • Figure 27: North America Market Y-o-Y Growth Comparison by Component , 2025 to 2035
  • Figure 28: North America Market Attractiveness Analysis by Component
  • Figure 29: North America Market Value Share and BPS Analysis by Deployment Type, 2025 and 2035
  • Figure 30: North America Market Y-o-Y Growth Comparison by Deployment Type, 2025 to 2035
  • Figure 31: North America Market Attractiveness Analysis by Deployment Type
  • Figure 32: North America Market Value Share and BPS Analysis by Organization Size, 2025 and 2035
  • Figure 33: North America Market Y-o-Y Growth Comparison by Organization Size, 2025 to 2035
  • Figure 34: North America Market Attractiveness Analysis by Organization Size
  • Figure 35: North America Market Value Share and BPS Analysis by Industry, 2025 and 2035
  • Figure 36: North America Market Y-o-Y Growth Comparison by Industry, 2025 to 2035
  • Figure 37: North America Market Attractiveness Analysis by Industry
  • Figure 38: Latin America Market Value Share and BPS Analysis by Country, 2025 and 2035
  • Figure 39: Latin America Market Value Share and BPS Analysis by Component , 2025 and 2035
  • Figure 40: Latin America Market Y-o-Y Growth Comparison by Component , 2025 to 2035
  • Figure 41: Latin America Market Attractiveness Analysis by Component
  • Figure 42: Latin America Market Value Share and BPS Analysis by Deployment Type, 2025 and 2035
  • Figure 43: Latin America Market Y-o-Y Growth Comparison by Deployment Type, 2025 to 2035
  • Figure 44: Latin America Market Attractiveness Analysis by Deployment Type
  • Figure 45: Latin America Market Value Share and BPS Analysis by Organization Size, 2025 and 2035
  • Figure 46: Latin America Market Y-o-Y Growth Comparison by Organization Size, 2025 to 2035
  • Figure 47: Latin America Market Attractiveness Analysis by Organization Size
  • Figure 48: Latin America Market Value Share and BPS Analysis by Industry, 2025 and 2035
  • Figure 49: Latin America Market Y-o-Y Growth Comparison by Industry, 2025 to 2035
  • Figure 50: Latin America Market Attractiveness Analysis by Industry
  • Figure 51: Western Europe Market Value Share and BPS Analysis by Country, 2025 and 2035
  • Figure 52: Western Europe Market Value Share and BPS Analysis by Component , 2025 and 2035
  • Figure 53: Western Europe Market Y-o-Y Growth Comparison by Component , 2025 to 2035
  • Figure 54: Western Europe Market Attractiveness Analysis by Component
  • Figure 55: Western Europe Market Value Share and BPS Analysis by Deployment Type, 2025 and 2035
  • Figure 56: Western Europe Market Y-o-Y Growth Comparison by Deployment Type, 2025 to 2035
  • Figure 57: Western Europe Market Attractiveness Analysis by Deployment Type
  • Figure 58: Western Europe Market Value Share and BPS Analysis by Organization Size, 2025 and 2035
  • Figure 59: Western Europe Market Y-o-Y Growth Comparison by Organization Size, 2025 to 2035
  • Figure 60: Western Europe Market Attractiveness Analysis by Organization Size
  • Figure 61: Western Europe Market Value Share and BPS Analysis by Industry, 2025 and 2035
  • Figure 62: Western Europe Market Y-o-Y Growth Comparison by Industry, 2025 to 2035
  • Figure 63: Western Europe Market Attractiveness Analysis by Industry
  • Figure 64: Eastern Europe Market Value Share and BPS Analysis by Country, 2025 and 2035
  • Figure 65: Eastern Europe Market Value Share and BPS Analysis by Component , 2025 and 2035
  • Figure 66: Eastern Europe Market Y-o-Y Growth Comparison by Component , 2025 to 2035
  • Figure 67: Eastern Europe Market Attractiveness Analysis by Component
  • Figure 68: Eastern Europe Market Value Share and BPS Analysis by Deployment Type, 2025 and 2035
  • Figure 69: Eastern Europe Market Y-o-Y Growth Comparison by Deployment Type, 2025 to 2035
  • Figure 70: Eastern Europe Market Attractiveness Analysis by Deployment Type
  • Figure 71: Eastern Europe Market Value Share and BPS Analysis by Organization Size, 2025 and 2035
  • Figure 72: Eastern Europe Market Y-o-Y Growth Comparison by Organization Size, 2025 to 2035
  • Figure 73: Eastern Europe Market Attractiveness Analysis by Organization Size
  • Figure 74: Eastern Europe Market Value Share and BPS Analysis by Industry, 2025 and 2035
  • Figure 75: Eastern Europe Market Y-o-Y Growth Comparison by Industry, 2025 to 2035
  • Figure 76: Eastern Europe Market Attractiveness Analysis by Industry
  • Figure 77: East Asia Market Value Share and BPS Analysis by Country, 2025 and 2035
  • Figure 78: East Asia Market Value Share and BPS Analysis by Component , 2025 and 2035
  • Figure 79: East Asia Market Y-o-Y Growth Comparison by Component , 2025 to 2035
  • Figure 80: East Asia Market Attractiveness Analysis by Component
  • Figure 81: East Asia Market Value Share and BPS Analysis by Deployment Type, 2025 and 2035
  • Figure 82: East Asia Market Y-o-Y Growth Comparison by Deployment Type, 2025 to 2035
  • Figure 83: East Asia Market Attractiveness Analysis by Deployment Type
  • Figure 84: East Asia Market Value Share and BPS Analysis by Organization Size, 2025 and 2035
  • Figure 85: East Asia Market Y-o-Y Growth Comparison by Organization Size, 2025 to 2035
  • Figure 86: East Asia Market Attractiveness Analysis by Organization Size
  • Figure 87: East Asia Market Value Share and BPS Analysis by Industry, 2025 and 2035
  • Figure 88: East Asia Market Y-o-Y Growth Comparison by Industry, 2025 to 2035
  • Figure 89: East Asia Market Attractiveness Analysis by Industry
  • Figure 90: South Asia and Pacific Market Value Share and BPS Analysis by Country, 2025 and 2035
  • Figure 91: South Asia and Pacific Market Value Share and BPS Analysis by Component , 2025 and 2035
  • Figure 92: South Asia and Pacific Market Y-o-Y Growth Comparison by Component , 2025 to 2035
  • Figure 93: South Asia and Pacific Market Attractiveness Analysis by Component
  • Figure 94: South Asia and Pacific Market Value Share and BPS Analysis by Deployment Type, 2025 and 2035
  • Figure 95: South Asia and Pacific Market Y-o-Y Growth Comparison by Deployment Type, 2025 to 2035
  • Figure 96: South Asia and Pacific Market Attractiveness Analysis by Deployment Type
  • Figure 97: South Asia and Pacific Market Value Share and BPS Analysis by Organization Size, 2025 and 2035
  • Figure 98: South Asia and Pacific Market Y-o-Y Growth Comparison by Organization Size, 2025 to 2035
  • Figure 99: South Asia and Pacific Market Attractiveness Analysis by Organization Size
  • Figure 100: South Asia and Pacific Market Value Share and BPS Analysis by Industry, 2025 and 2035
  • Figure 101: South Asia and Pacific Market Y-o-Y Growth Comparison by Industry, 2025 to 2035
  • Figure 102: South Asia and Pacific Market Attractiveness Analysis by Industry
  • Figure 103: Middle East & Africa Market Value Share and BPS Analysis by Country, 2025 and 2035
  • Figure 104: Middle East & Africa Market Value Share and BPS Analysis by Component , 2025 and 2035
  • Figure 105: Middle East & Africa Market Y-o-Y Growth Comparison by Component , 2025 to 2035
  • Figure 106: Middle East & Africa Market Attractiveness Analysis by Component
  • Figure 107: Middle East & Africa Market Value Share and BPS Analysis by Deployment Type, 2025 and 2035
  • Figure 108: Middle East & Africa Market Y-o-Y Growth Comparison by Deployment Type, 2025 to 2035
  • Figure 109: Middle East & Africa Market Attractiveness Analysis by Deployment Type
  • Figure 110: Middle East & Africa Market Value Share and BPS Analysis by Organization Size, 2025 and 2035
  • Figure 111: Middle East & Africa Market Y-o-Y Growth Comparison by Organization Size, 2025 to 2035
  • Figure 112: Middle East & Africa Market Attractiveness Analysis by Organization Size
  • Figure 113: Middle East & Africa Market Value Share and BPS Analysis by Industry, 2025 and 2035
  • Figure 114: Middle East & Africa Market Y-o-Y Growth Comparison by Industry, 2025 to 2035
  • Figure 115: Middle East & Africa Market Attractiveness Analysis by Industry
  • Figure 116: Global Market – Tier Structure Analysis
  • Figure 117: Global Market – Company Share Analysis
Dashboard
Dashboard
Dashboard
Dashboard
Dashboard
Dashboard

Full Research Suite comprises of:

Market outlook & trends analysis

Market outlook & trends analysis

Interviews & case studies

Interviews & case studies

Strategic recommendations

Strategic recommendations

Vendor profiles & capabilities analysis

Vendor profiles & capabilities analysis

5-year forecasts

5-year forecasts

8 regions and 60+ country-level data splits

8 regions and 60+ country-level data splits

Market segment data splits

Market segment data splits

12 months of continuous data updates

12 months of continuous data updates

DELIVERED AS:

PDF EXCEL ONLINE

Full Research Suite


$5000

$7500

$10000

Buy Report Now
Similar Industry Reports

Similar Industry Reports

Asset Tags Market
Asset Tags Market

Asset Tags Market Size and Share Forecast Outlook 2025 to 2035

Asset-Based Lending Market

Asset-Based Lending Market Size and Share Forecast Outlook 2025 to 2035

Asset Financing Platform Market

Asset Financing Platform Market Growth - Trends & Forecast 2025 to 2035

Asset Tags Market Share Analysis

Key Players & Market Share in the Asset Tags Sector

Asset Management System Market

Asset Management System Market

Asset Integrity Management Market

Asset Integrity Management Market Growth - Trends & Forecast 2025 to 2035

Asset And Liability Management Solutions Market

Asset And Liability Management Solutions Market

IT Asset Disposition Market

IT Asset Disposition Market Growth – Trends & Forecast 2024-2034

IT Asset Management Market

IT Asset Management Market Size and Share Forecast Outlook 2025 to 2035

AI Asset Management Tool Market

AI Asset Management Tool Market Analysis – Growth & Outlook 2024-2034

Plant Asset Management Market

Plant Asset Management Market Size and Share Forecast Outlook 2025 to 2035

Fixed Asset Management Software Market

Fixed Asset Management Software Market Size and Share Forecast Outlook 2025 to 2035

Media Asset Management Market 

Media Asset Management Market  Size and Share Forecast Outlook 2025 to 2035

Marine Asset Integrity Services Market

Marine Asset Integrity Services Market

Remote Asset Management Market

Remote Asset Management Market Size and Share Forecast Outlook 2025 to 2035

Crypto Asset Management Market

Crypto Asset Management Market

Utility Asset Management Market

Utility Asset Management Market Size and Share Forecast Outlook 2025 to 2035

Digital Asset Management Market

Digital Asset Management Market

Ceiling Cassettes Market

Ceiling Cassettes Market

Aviation Asset Management Market

Aviation Asset Management Market Size and Share Forecast Outlook 2025 to 2035

Future Market Insights

Asset Performance Management Market

Chat With MaRIA

Chat With

MaRIA

Hi There, I am MaRIA, Your Market Research Intelligence Assistant. How may I help you?