Reports

- Global Locations -

Headquarters

Future Market Insights, Inc.

Christiana Corporate, 200
Continental Drive, Suite 401,
Newark, Delaware - 19713,
United States

T: +1-347-918-3531

Americas

Future Market Insights, Inc.

616 Corporate Way, Suite 2-9018,
Valley Cottage, NY 10989, United States

MEA

Future Market Insights

1602-6 Jumeirah Bay X2 Tower, Plot No: JLT-PH2-X2A,
Jumeirah Lakes Towers, Dubai,
United Arab Emirates

Europe

Future Market Insights

3rd Floor, 207 Regent Street,
W1B 3HH London
United Kingdom

T: + 44 (0) 20 8123 9659

Asia Pacific

Future Market Insights

IndiaLand Global Tech Park, Unit UG-1, Behind Grand HighStreet, Phase 1, Hinjawadi, MH, Pune – 411057, India

Performance Elastomer Market Outlook from 2024 to 2034

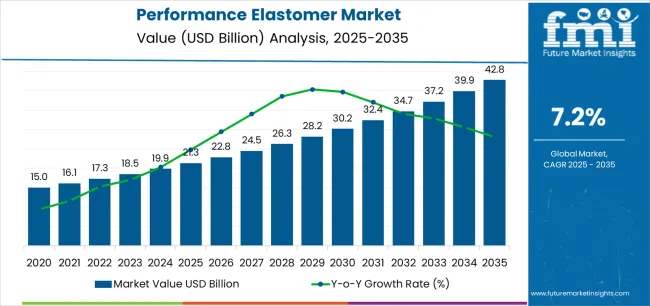
The performance elastomer market is estimated to be valued at US$ 19.8 billion in 2024. The performance elastomer is predicted to rise at a CAGR of 7.6% from 2024 to 2034. The global performance elastomer market is anticipated to reach US$ 41 billion by 2034.

The performance elastomer market is experiencing strong growth, fueled by rising demand from diverse industries for advanced materials capable of enduring extreme conditions.

Performance elastomers, such as fluoroelastomers (FKM), silicone elastomers, perfluoroelastomers (FFKM), and hydrogenated nitrile butadiene rubber (HNBR), offer exceptional properties like resistance to high temperatures, chemicals, and mechanical stress, making them vital for applications in automotive, aerospace, oil and gas, and healthcare sectors.

Attributes Key Insights
Estimated Market Size in 2024 US$ 19.8 billion
Projected Market Value in 2034 US$ 41 billion
Value-based CAGR from 2024 to 2034 7.6%

Don't pay for what you don't need

Customize your report by selecting specific countries or regions and save 30%!

2019 to 2023 Historical Analysis vs. 2024 to 2034 Market Forecast Projections

From 2019 to 2023, the performance elastomer market experienced a CAGR of 8.7%. The automotive industry is a significant contributor to the performance elastomer market due to the rising demand for fuel-efficient vehicles and stringent emission regulations. Performance elastomers are used in automotive seals, gaskets, hoses, and engine components to enhance durability and reliability, thereby driving market growth.

In the aerospace sector, performance elastomers play a crucial role in applications requiring resistance to extreme temperatures, pressure differentials, and aerospace fluids. They are used in aircraft engines, fuel systems, seals, and O-rings, contributing to improved safety and performance of aerospace systems.

Overall, the performance elastomer market is poised for steady growth driven by increasing industrial applications, technological advancements, and the pursuit of high-performance materials across various sectors. Projections indicate that the global performance elastomer market is expected to experience a CAGR of 7.6% from 2024 to 2034.

Historical CAGR from 2019 to 2023 8.7%
Forecast CAGR from 2024 to 2034 7.6%

Performance Elastomer Market Growth Drivers

  • Increasing demand for high-performance material in automotive, aerospace, oil and gas, healthcare, and electronics driving the performance elastomers market growth.
  • Performance elastomers that are recyclable, reusable, or made from renewable sources are gaining traction in the market.
  • Rapid industrialization and infrastructure development in emerging economies present new opportunities for the performance elastomer market.
  • Performance elastomers are increasingly utilized across various segments within the healthcare industry, spanning from medical devices and equipment to pharmaceutical packaging.
Nikhil Kaitwade
Nikhil Kaitwade

Principal Consultant

Talk to Analyst

Find your sweet spots for generating winning opportunities in this market.

Performance Elastomer Market Key Challenges

  • Developing high-performance elastomers often involves complex formulations and specialized manufacturing processes, leading to higher production costs, which may impact market demand.
  • Disruptions such as natural disasters, geopolitical tensions, or transportation issues can impact the availability and cost of materials, leading to supply chain disruptions.
  • Alternative materials, including advanced polymers, ceramics, and composites, pose a competitive threat to performance elastomers.
  • Economic fluctuations, trade tensions, and geopolitical risks can impact market demand and investment decisions across industries.
  • Educating customers about the benefits and applications of performance elastomers compared to conventional materials can be a challenge.

Comparative View of Adjacent Markets

Future Market Insights has compared three markets, namely the APAC Fluoroelastomer market and the butyl Elastomers market are below. As the semiconductor industry continues to expand in the APAC region, driven by increasing demand for electronic devices and advancements in technology, the demand for fluoroelastomers for semiconductor applications is expected to rise.

With a focus on improving fuel efficiency and reducing emissions, there's a growing preference for high-performance tires made with butyl elastomers, driving further market growth.

Performance Elastomer Market:

Attributes Performance Elastomer Market
CAGR from 2024 to 2034 7.6%
Key Trends
  • Growing preference for eco-friendly elastomer solutions.
Growth Factor
  • Increasing application in the automotive industry.

APAC Fluoroelastomer Market:

Attributes APAC Fluoroelastomer Market
CAGR from 2022 to 2032 5.2%
Key Trends
  • The growing adoption of fluoroelastomers in the semiconductor and electronics industries.
Growth Factor
  • Expansion of automotive manufacturing facilities, increasing vehicle production, and advancements in automotive technology.

Butyl Elastomers Market:

Attributes Butyl Elastomers Market
CAGR from 2022 to 2032 6%
Key Trends
  • A notable trend in the butyl elastomers market is the increasing emphasis on sustainability and compliance with environmental regulations.
Growth Factor
  • The increasing demand from the automotive industry.

Get the data you need at a Fraction of the cost

Personalize your report by choosing insights you need
and save 40%!

Country-wise Analysis

The provided table highlights the top five countries in terms of revenue, with the United Kingdom and South Korea leading the list. In the United Kingdom, one significant growth factor driving the performance elastomer market is the country's strong focus on sustainability and environmental regulations.

As the healthcare sector expands, driven by demographic shifts and advancements in medical technology, the demand for high-performance elastomers in South Korea is expected to continue growing steadily.

Countries Forecast CAGRs from 2024 to 2034
The United States 7.8%
The United Kingdom 8.9%
China 7.9%
Japan 8.2%
South Korea 8.6%

Growing Automotive Industry Demand in the United States to Drive Market Growth

The performance elastomer market in the United States is forecast to expand with a CAGR of 7.8% from 2024 to 2034. The United States is a major market for automotive manufacturing and consumption.

Performance elastomers are extensively used in various automotive components such as seals, gaskets, hoses, and engine mounts. The growing demand for fuel-efficient vehicles, stringent emission regulations, and the increasing adoption of electric vehicles contribute to the demand for high-performance elastomers in the automotive sector.

Performance elastomers find widespread applications in industrial sectors such as oil and gas, aerospace, machinery, and construction in the United States. These elastomers are used in seals, O-rings, gaskets, and other critical components where resistance to extreme temperatures, chemicals, and mechanical stress is required. The robust industrial activity in the country drives the demand for high-performance elastomers.

Focus on Sustainability to Boost Market in the United Kingdom

The performance elastomer market in the United Kingdom is expected to progress at a CAGR of 8.9% from 2024 to 2034. There is a growing focus on sustainability and environmental regulations in the United Kingdom.

Performance elastomer manufacturers are investing in the development of eco-friendly elastomers made from renewable sources or recycled materials to meet environmental standards and address customer preferences.

Ongoing advancements in material science and manufacturing technologies have led to the development of innovative performance elastomers with enhanced properties. These advancements cater to the evolving needs of industries in the United Kingdom, such as improved temperature resistance, chemical compatibility, and durability.

Industrial Development in China is leading to Performance Elastomers Market Growth

The performance elastomer market in China is expected to rise at a CAGR of 7.9% from 2024 to 2034. China is the world's largest automotive market, with a rapidly growing demand for vehicles.

Performance elastomers are extensively used in automotive applications. The expansion of the automotive industry in China, driven by increasing consumer demand, government policies promoting electric vehicles, and investments in automotive manufacturing, contributes to the demand for high-performance elastomers.

China's industrial sector is undergoing rapid growth and modernization, leading to increased demand for performance elastomers in industries such as oil and gas, aerospace, machinery, and construction. Performance elastomers are essential for critical components that require resistance to extreme temperatures, chemicals, and mechanical stress.
The Demand for Performance Elastomers in Industrial Applications Drives Market Growth in Japan

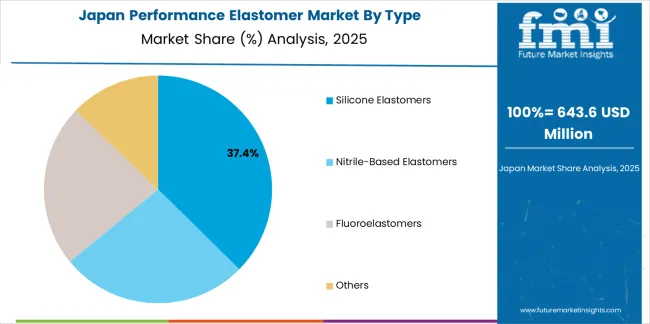
The performance elastomer market in Japan is expected to advance with a CAGR of 8.2% from 2024 to 2034. Performance elastomers find extensive use in various industrial sectors in Japan, including electronics, machinery, aerospace, and healthcare.

These elastomers are essential for critical components requiring resistance to extreme temperatures, chemicals, and mechanical stress. The growth of these industries contributes to the demand for high-performance elastomers.

Japan has a rapidly aging population, driving demand for healthcare services and medical devices. Performance elastomers are used in medical applications such as medical tubing, seals, and implants. The growth of the healthcare sector in Japan contributes to the demand for high-performance elastomers.
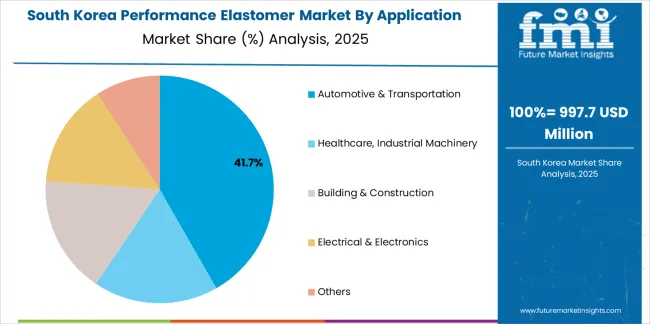
Expansion of the Healthcare Sector Contributes to the Demand for High-Performance Elastomers in South Korea

Performance elastomers find applications in electronic devices, including seals, gaskets, and insulating materials. The growth of the electronics industry in South Korea contributes to the demand for performance elastomers.

The demand for performance elastomers in industrial applications drives market growth in South Korea. The performance elastomer market in South Korea is expected to advance with a CAGR of 8.6% from 2024 to 2034

Performance elastomers are used in medical devices, pharmaceutical packaging, and healthcare equipment. The growth of the healthcare sector contributes to the demand for high-performance elastomers in South Korea.

Category-wise Insights

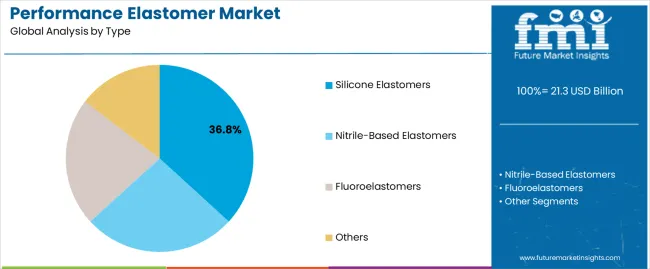
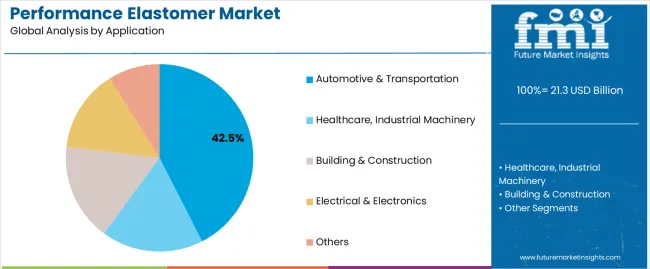
The below section shows the leading segment. The nitrile-based elastomers segment is to grow at a CAGR of 7.4% from 2024 to 2034. Based on application, the automotive & transportation segment is anticipated to hold a dominant share through 2034. It is set to exhibit a CAGR of 7.3% from 2024 to 2034.

Category CAGR from 2024 to 2034
Nitrile-Based Elastomers 7.4%
Automotive & Transportation 7.3%

Nitrile-Based Elastomers Segment to Remain Prominent Throughout the Forecast Period

Based on type, the nitrile-based elastomers segment is anticipated to grow at a CAGR of 7.4% from 2024 to 2034. Nitrile-based elastomers exhibit excellent resistance to oils, fuels, hydraulic fluids, and other chemicals. This property makes them ideal for use in seals, gaskets, hoses, and other components exposed to harsh chemical environments, particularly in automotive, oil and gas, and industrial applications.

Nitrile-based elastomers offer good mechanical properties, including high tensile strength, tear resistance, and abrasion resistance. These properties contribute to their durability and reliability in demanding applications, such as automotive seals and industrial machinery components.

Compared to some other high-performance elastomers like fluorocarbon elastomers (FKM), nitrile-based elastomers are generally more cost-effective. This affordability makes them an attractive option for applications where high performance is required but cost considerations are also important.

The Demand for Automotive and Transportation Segment Remains High

Based on application, the automotive and transportation segment is anticipated to advance at a CAGR of 7.3% from 2024 to 2034. Performance elastomers are essential for creating reliable seals in automotive systems such as engines, transmissions, brakes, and fuel systems. These elastomers offer excellent sealing properties, including resistance to high temperatures, fuels, oils, and chemicals, ensuring optimal performance and preventing leaks or failures.

Automotive manufacturers are continuously striving to improve fuel efficiency and reduce vehicle weight to meet regulatory requirements and consumer demands for more eco-friendly and cost-effective vehicles. Performance elastomers contribute to light-weighting efforts by replacing heavier materials in various automotive components without compromising performance or safety.

Performance elastomers are used in automotive suspension systems, engine mounts, and vibration isolation mounts to dampen vibrations, reduce noise, and improve ride comfort. These elastomers absorb and dissipate energy generated by engine vibrations and road shocks, enhancing vehicle comfort and handling.
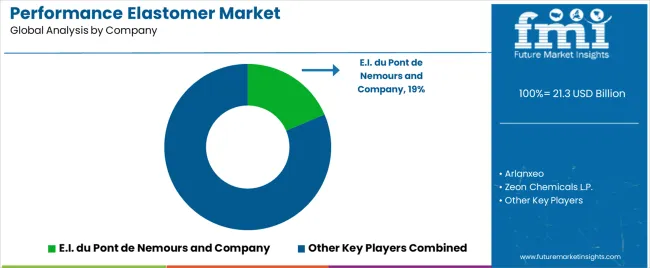
Competitive Landscape

Market players expanding their product portfolios to offer a comprehensive range of performance elastomers tailored to different industry requirements and applications. This strategy allows companies to cater to diverse customer needs and penetrate new market segments.

Companies invest in research and development to innovate and introduce new performance elastomer formulations with enhanced properties such as higher temperature resistance, improved chemical compatibility, better durability, and reduced environmental impact. Continuous innovation helps companies differentiate their products and stay ahead of competitors.

  • DuPont is a global leader in materials science, including the production of performance elastomers. They offer a wide range of elastomeric materials, including fluoroelastomers (e.g., Viton®), ethylene elastomers (e.g., Vamac®) and other specialty elastomers, catering to various industries such as automotive, aerospace, and chemical processing.
  • Arlanxeo is a leading supplier of synthetic rubber, including high-performance elastomers such as nitrile rubber (NBR), ethylene propylene diene monomer (EPDM), and butyl rubber. Their elastomers find applications in the automotive, construction, and industrial sectors.

Key Coverage in Performance Elastomer Market Report

  • Cumulative Growth Analysis of the Performance Elastomer Market
  • Adjacent Study on Cast Elastomer Market and Elastomers Market
  • Sales Forecast for Performance Elastomer in South Korea
  • Demand for Performance Elastomer in the United Kingdom
  • Strategies of Key Players of the Performance Elastomer Market

Report Scope

Attributes Details
Estimated Market Size in 2024 US$ 19.8 billion
Projected Market Valuation in 2034 US$ 41 billion
Value-based CAGR 2024 to 2034 7.6%
Forecast Period 2024 to 2034
Historical Data Available for 2019 to 2023
Market Analysis Value in US$ million
Key Regions Covered
  • North America
  • Latin America
  • Western Europe
  • Eastern Europe
  • South Asia and Pacific
  • East Asia
  • Middle East and Africa
Key Market Segments Covered
  • Type
  • Application
  • Region
Key Countries Profiled
  • The United States
  • Canada
  • Brazil
  • Mexico
  • Germany
  • The United Kingdom
  • France
  • Spain
  • Italy
  • Russia
  • Poland
  • Czech Republic
  • Romania
  • India
  • Bangladesh
  • Australia
  • New Zealand
  • China
  • Japan
  • South Korea
  • GCC countries
  • South Africa
  • Israel
Key Companies Profiled
  • E.I. du Pont de Nemours and Company
  • Arlanxeo
  • Zeon Chemicals L.P.
  • Solvay S.A.
  • Mitsui & Co. Ltd.
  • Dow Corning Corporation
  • Wacker Chemie AG
  • JSR Corporation
  • Momentive Performance Materials Inc.
  • Showa Denko K.K.

Performance Elastomer Market - Key Segments

By Type:

  • Nitrile-Based Elastomers
  • Fluoroelastomers
  • Silicone Elastomers
  • Others

By Application:

  • Automotive & Transportation
  • Healthcare, Industrial Machinery
  • Building & Construction
  • Electrical & Electronics
  • Others

By Region:

  • North America
  • Latin America
  • Western Europe
  • Eastern Europe
  • South Asia and Pacific
  • East Asia
  • The Middle East and Africa

Frequently Asked Questions

What is the expected worth of the performance elastomer market in 2024?

As of 2024, the market for performance elastomers is expected to be valued at US$ 19.8 billion.

What is the anticipated market value for the performance elastomer in 2034?

By 2034, the market value of performance elastomer is expected to reach US$ 41 billion.

What is the projected forecast CAGR for the performance elastomer market from 2024 to 2034?

From 2024 to 2034, the performance elastomer market is expected to flourish at a CAGR of 7.6%.

Based on type, which segment dominates the performance elastomer market?

The nitrile-based Elastomers segment is expected to grow at a CAGR of 7.4% through 2034.

Which country is likely to be at the pinnacle of the market?

The United Kingdom is likely the top-performing market, with a CAGR of 8.9%.

Table of Content

1. Executive Summary

    1.1. Global Market Outlook

    1.2. Demand-side Trends

    1.3. Supply-side Trends

    1.4. Technology Roadmap Analysis

    1.5. Analysis and Recommendations

2. Market Overview

    2.1. Market Coverage / Taxonomy

    2.2. Market Definition / Scope / Limitations

3. Market Background

    3.1. Market Dynamics

        3.1.1. Drivers

        3.1.2. Restraints

        3.1.3. Opportunity

        3.1.4. Trends

    3.2. Scenario Forecast

        3.2.1. Demand in Optimistic Scenario

        3.2.2. Demand in Likely Scenario

        3.2.3. Demand in Conservative Scenario

    3.3. Opportunity Map Analysis

    3.4. Product Life Cycle Analysis

    3.5. Supply Chain Analysis

        3.5.1. Supply Side Participants and their Roles

            3.5.1.1. Producers

            3.5.1.2. Mid-Level Participants (Traders/ Agents/ Brokers)

            3.5.1.3. Wholesalers and Distributors

        3.5.2. Value Added and Value Created at Node in the Supply Chain

        3.5.3. List of Raw Material Suppliers

        3.5.4. List of Existing and Potential Buyer’s

    3.6. Investment Feasibility Matrix

    3.7. Value Chain Analysis

        3.7.1. Profit Margin Analysis

        3.7.2. Wholesalers and Distributors

        3.7.3. Retailers

    3.8. PESTLE and Porter’s Analysis

    3.9. Regulatory Landscape

        3.9.1. By Key Regions

        3.9.2. By Key Countries

    3.10. Regional Parent Market Outlook

    3.11. Production and Consumption Statistics

    3.12. Import and Export Statistics

4. Global Market Analysis 2019 to 2023 and Forecast, 2024 to 2034

    4.1. Historical Market Size Value (US$ Million) & Volume (Tons) Analysis, 2019 to 2023

    4.2. Current and Future Market Size Value (US$ Million) & Volume (Tons) Projections, 2024 to 2034

        4.2.1. Y-o-Y Growth Trend Analysis

        4.2.2. Absolute $ Opportunity Analysis

5. Global Market Analysis 2019 to 2023 and Forecast 2024 to 2034, By Type

    5.1. Introduction / Key Findings

    5.2. Historical Market Size Value (US$ Million) & Volume (Tons) Analysis By Type, 2019 to 2023

    5.3. Current and Future Market Size Value (US$ Million) & Volume (Tons) Analysis and Forecast By Type, 2024 to 2034

        5.3.1. Nitrile-Based Elastomers

        5.3.2. Fluoroelastomers

        5.3.3. Silicone Elastomers

        5.3.4. Others

    5.4. Y-o-Y Growth Trend Analysis By Type, 2019 to 2023

    5.5. Absolute $ Opportunity Analysis By Type, 2024 to 2034

6. Global Market Analysis 2019 to 2023 and Forecast 2024 to 2034, By End-Use Industry

    6.1. Introduction / Key Findings

    6.2. Historical Market Size Value (US$ Million) & Volume (Tons) Analysis By End-Use Industry, 2019 to 2023

    6.3. Current and Future Market Size Value (US$ Million) & Volume (Tons) Analysis and Forecast By End-Use Industry, 2024 to 2034

        6.3.1. Automotive & Transportation

        6.3.2. Healthcare, Industrial Machinery

        6.3.3. Building & Construction

        6.3.4. Electrical & Electronics

        6.3.5. Others

    6.4. Y-o-Y Growth Trend Analysis By End-Use Industry, 2019 to 2023

    6.5. Absolute $ Opportunity Analysis By End-Use Industry, 2024 to 2034

7. Global Market Analysis 2019 to 2023 and Forecast 2024 to 2034, By Region

    7.1. Introduction

    7.2. Historical Market Size Value (US$ Million) & Volume (Tons) Analysis By Region, 2019 to 2023

    7.3. Current Market Size Value (US$ Million) & Volume (Tons) Analysis and Forecast By Region, 2024 to 2034

        7.3.1. North America

        7.3.2. Latin America

        7.3.3. Western Europe

        7.3.4. Eastern Europe

        7.3.5. South Asia and Pacific

        7.3.6. East Asia

        7.3.7. Middle East and Africa

    7.4. Market Attractiveness Analysis By Region

8. North America Market Analysis 2019 to 2023 and Forecast 2024 to 2034, By Country

    8.1. Historical Market Size Value (US$ Million) & Volume (Tons) Trend Analysis By Market Taxonomy, 2019 to 2023

    8.2. Market Size Value (US$ Million) & Volume (Tons) Forecast By Market Taxonomy, 2024 to 2034

        8.2.1. By Country

            8.2.1.1. USA

            8.2.1.2. Canada

        8.2.2. By Type

        8.2.3. By End-Use Industry

    8.3. Market Attractiveness Analysis

        8.3.1. By Country

        8.3.2. By Type

        8.3.3. By End-Use Industry

    8.4. Key Takeaways

9. Latin America Market Analysis 2019 to 2023 and Forecast 2024 to 2034, By Country

    9.1. Historical Market Size Value (US$ Million) & Volume (Tons) Trend Analysis By Market Taxonomy, 2019 to 2023

    9.2. Market Size Value (US$ Million) & Volume (Tons) Forecast By Market Taxonomy, 2024 to 2034

        9.2.1. By Country

            9.2.1.1. Brazil

            9.2.1.2. Mexico

            9.2.1.3. Rest of Latin America

        9.2.2. By Type

        9.2.3. By End-Use Industry

    9.3. Market Attractiveness Analysis

        9.3.1. By Country

        9.3.2. By Type

        9.3.3. By End-Use Industry

    9.4. Key Takeaways

10. Western Europe Market Analysis 2019 to 2023 and Forecast 2024 to 2034, By Country

    10.1. Historical Market Size Value (US$ Million) & Volume (Tons) Trend Analysis By Market Taxonomy, 2019 to 2023

    10.2. Market Size Value (US$ Million) & Volume (Tons) Forecast By Market Taxonomy, 2024 to 2034

        10.2.1. By Country

            10.2.1.1. Germany

            10.2.1.2. UK

            10.2.1.3. France

            10.2.1.4. Spain

            10.2.1.5. Italy

            10.2.1.6. Rest of Western Europe

        10.2.2. By Type

        10.2.3. By End-Use Industry

    10.3. Market Attractiveness Analysis

        10.3.1. By Country

        10.3.2. By Type

        10.3.3. By End-Use Industry

    10.4. Key Takeaways

11. Eastern Europe Market Analysis 2019 to 2023 and Forecast 2024 to 2034, By Country

    11.1. Historical Market Size Value (US$ Million) & Volume (Tons) Trend Analysis By Market Taxonomy, 2019 to 2023

    11.2. Market Size Value (US$ Million) & Volume (Tons) Forecast By Market Taxonomy, 2024 to 2034

        11.2.1. By Country

            11.2.1.1. Poland

            11.2.1.2. Russia

            11.2.1.3. Czech Republic

            11.2.1.4. Romania

            11.2.1.5. Rest of Eastern Europe

        11.2.2. By Type

        11.2.3. By End-Use Industry

    11.3. Market Attractiveness Analysis

        11.3.1. By Country

        11.3.2. By Type

        11.3.3. By End-Use Industry

    11.4. Key Takeaways

12. South Asia and Pacific Market Analysis 2019 to 2023 and Forecast 2024 to 2034, By Country

    12.1. Historical Market Size Value (US$ Million) & Volume (Tons) Trend Analysis By Market Taxonomy, 2019 to 2023

    12.2. Market Size Value (US$ Million) & Volume (Tons) Forecast By Market Taxonomy, 2024 to 2034

        12.2.1. By Country

            12.2.1.1. India

            12.2.1.2. Bangladesh

            12.2.1.3. Australia

            12.2.1.4. New Zealand

            12.2.1.5. Rest of South Asia and Pacific

        12.2.2. By Type

        12.2.3. By End-Use Industry

    12.3. Market Attractiveness Analysis

        12.3.1. By Country

        12.3.2. By Type

        12.3.3. By End-Use Industry

    12.4. Key Takeaways

13. East Asia Market Analysis 2019 to 2023 and Forecast 2024 to 2034, By Country

    13.1. Historical Market Size Value (US$ Million) & Volume (Tons) Trend Analysis By Market Taxonomy, 2019 to 2023

    13.2. Market Size Value (US$ Million) & Volume (Tons) Forecast By Market Taxonomy, 2024 to 2034

        13.2.1. By Country

            13.2.1.1. China

            13.2.1.2. Japan

            13.2.1.3. South Korea

        13.2.2. By Type

        13.2.3. By End-Use Industry

    13.3. Market Attractiveness Analysis

        13.3.1. By Country

        13.3.2. By Type

        13.3.3. By End-Use Industry

    13.4. Key Takeaways

14. Middle East and Africa Market Analysis 2019 to 2023 and Forecast 2024 to 2034, By Country

    14.1. Historical Market Size Value (US$ Million) & Volume (Tons) Trend Analysis By Market Taxonomy, 2019 to 2023

    14.2. Market Size Value (US$ Million) & Volume (Tons) Forecast By Market Taxonomy, 2024 to 2034

        14.2.1. By Country

            14.2.1.1. GCC Countries

            14.2.1.2. South Africa

            14.2.1.3. Israel

            14.2.1.4. Rest of MEA

        14.2.2. By Type

        14.2.3. By End-Use Industry

    14.3. Market Attractiveness Analysis

        14.3.1. By Country

        14.3.2. By Type

        14.3.3. By End-Use Industry

    14.4. Key Takeaways

15. Key Countries Market Analysis

    15.1. USA

        15.1.1. Pricing Analysis

        15.1.2. Market Share Analysis, 2023

            15.1.2.1. By Type

            15.1.2.2. By End-Use Industry

    15.2. Canada

        15.2.1. Pricing Analysis

        15.2.2. Market Share Analysis, 2023

            15.2.2.1. By Type

            15.2.2.2. By End-Use Industry

    15.3. Brazil

        15.3.1. Pricing Analysis

        15.3.2. Market Share Analysis, 2023

            15.3.2.1. By Type

            15.3.2.2. By End-Use Industry

    15.4. Mexico

        15.4.1. Pricing Analysis

        15.4.2. Market Share Analysis, 2023

            15.4.2.1. By Type

            15.4.2.2. By End-Use Industry

    15.5. Germany

        15.5.1. Pricing Analysis

        15.5.2. Market Share Analysis, 2023

            15.5.2.1. By Type

            15.5.2.2. By End-Use Industry

    15.6. UK

        15.6.1. Pricing Analysis

        15.6.2. Market Share Analysis, 2023

            15.6.2.1. By Type

            15.6.2.2. By End-Use Industry

    15.7. France

        15.7.1. Pricing Analysis

        15.7.2. Market Share Analysis, 2023

            15.7.2.1. By Type

            15.7.2.2. By End-Use Industry

    15.8. Spain

        15.8.1. Pricing Analysis

        15.8.2. Market Share Analysis, 2023

            15.8.2.1. By Type

            15.8.2.2. By End-Use Industry

    15.9. Italy

        15.9.1. Pricing Analysis

        15.9.2. Market Share Analysis, 2023

            15.9.2.1. By Type

            15.9.2.2. By End-Use Industry

    15.10. Poland

        15.10.1. Pricing Analysis

        15.10.2. Market Share Analysis, 2023

            15.10.2.1. By Type

            15.10.2.2. By End-Use Industry

    15.11. Russia

        15.11.1. Pricing Analysis

        15.11.2. Market Share Analysis, 2023

            15.11.2.1. By Type

            15.11.2.2. By End-Use Industry

    15.12. Czech Republic

        15.12.1. Pricing Analysis

        15.12.2. Market Share Analysis, 2023

            15.12.2.1. By Type

            15.12.2.2. By End-Use Industry

    15.13. Romania

        15.13.1. Pricing Analysis

        15.13.2. Market Share Analysis, 2023

            15.13.2.1. By Type

            15.13.2.2. By End-Use Industry

    15.14. India

        15.14.1. Pricing Analysis

        15.14.2. Market Share Analysis, 2023

            15.14.2.1. By Type

            15.14.2.2. By End-Use Industry

    15.15. Bangladesh

        15.15.1. Pricing Analysis

        15.15.2. Market Share Analysis, 2023

            15.15.2.1. By Type

            15.15.2.2. By End-Use Industry

    15.16. Australia

        15.16.1. Pricing Analysis

        15.16.2. Market Share Analysis, 2023

            15.16.2.1. By Type

            15.16.2.2. By End-Use Industry

    15.17. New Zealand

        15.17.1. Pricing Analysis

        15.17.2. Market Share Analysis, 2023

            15.17.2.1. By Type

            15.17.2.2. By End-Use Industry

    15.18. China

        15.18.1. Pricing Analysis

        15.18.2. Market Share Analysis, 2023

            15.18.2.1. By Type

            15.18.2.2. By End-Use Industry

    15.19. Japan

        15.19.1. Pricing Analysis

        15.19.2. Market Share Analysis, 2023

            15.19.2.1. By Type

            15.19.2.2. By End-Use Industry

    15.20. South Korea

        15.20.1. Pricing Analysis

        15.20.2. Market Share Analysis, 2023

            15.20.2.1. By Type

            15.20.2.2. By End-Use Industry

    15.21. GCC Countries

        15.21.1. Pricing Analysis

        15.21.2. Market Share Analysis, 2023

            15.21.2.1. By Type

            15.21.2.2. By End-Use Industry

    15.22. South Africa

        15.22.1. Pricing Analysis

        15.22.2. Market Share Analysis, 2023

            15.22.2.1. By Type

            15.22.2.2. By End-Use Industry

    15.23. Israel

        15.23.1. Pricing Analysis

        15.23.2. Market Share Analysis, 2023

            15.23.2.1. By Type

            15.23.2.2. By End-Use Industry

16. Market Structure Analysis

    16.1. Competition Dashboard

    16.2. Competition Benchmarking

    16.3. Market Share Analysis of Top Players

        16.3.1. By Regional

        16.3.2. By Type

        16.3.3. By End-Use Industry

17. Competition Analysis

    17.1. Competition Deep Dive

        17.1.1. E.I. du Pont de Nemours and Company

            17.1.1.1. Overview

            17.1.1.2. Product Portfolio

            17.1.1.3. Profitability by Market Segments

            17.1.1.4. Sales Footprint

            17.1.1.5. Strategy Overview

                17.1.1.5.1. Marketing Strategy

                17.1.1.5.2. Product Strategy

                17.1.1.5.3. Channel Strategy

        17.1.2. Arlanxeo

            17.1.2.1. Overview

            17.1.2.2. Product Portfolio

            17.1.2.3. Profitability by Market Segments

            17.1.2.4. Sales Footprint

            17.1.2.5. Strategy Overview

                17.1.2.5.1. Marketing Strategy

                17.1.2.5.2. Product Strategy

                17.1.2.5.3. Channel Strategy

        17.1.3. Zeon Chemicals L.P.

            17.1.3.1. Overview

            17.1.3.2. Product Portfolio

            17.1.3.3. Profitability by Market Segments

            17.1.3.4. Sales Footprint

            17.1.3.5. Strategy Overview

                17.1.3.5.1. Marketing Strategy

                17.1.3.5.2. Product Strategy

                17.1.3.5.3. Channel Strategy

        17.1.4. Solvay S.A.

            17.1.4.1. Overview

            17.1.4.2. Product Portfolio

            17.1.4.3. Profitability by Market Segments

            17.1.4.4. Sales Footprint

            17.1.4.5. Strategy Overview

                17.1.4.5.1. Marketing Strategy

                17.1.4.5.2. Product Strategy

                17.1.4.5.3. Channel Strategy

        17.1.5. Mitsui & Co. Ltd.

            17.1.5.1. Overview

            17.1.5.2. Product Portfolio

            17.1.5.3. Profitability by Market Segments

            17.1.5.4. Sales Footprint

            17.1.5.5. Strategy Overview

                17.1.5.5.1. Marketing Strategy

                17.1.5.5.2. Product Strategy

                17.1.5.5.3. Channel Strategy

        17.1.6. Dow Corning Corporation

            17.1.6.1. Overview

            17.1.6.2. Product Portfolio

            17.1.6.3. Profitability by Market Segments

            17.1.6.4. Sales Footprint

            17.1.6.5. Strategy Overview

                17.1.6.5.1. Marketing Strategy

                17.1.6.5.2. Product Strategy

                17.1.6.5.3. Channel Strategy

        17.1.7. Wacker Chemie AG

            17.1.7.1. Overview

            17.1.7.2. Product Portfolio

            17.1.7.3. Profitability by Market Segments

            17.1.7.4. Sales Footprint

            17.1.7.5. Strategy Overview

                17.1.7.5.1. Marketing Strategy

                17.1.7.5.2. Product Strategy

                17.1.7.5.3. Channel Strategy

        17.1.8. JSR Corporation

            17.1.8.1. Overview

            17.1.8.2. Product Portfolio

            17.1.8.3. Profitability by Market Segments

            17.1.8.4. Sales Footprint

            17.1.8.5. Strategy Overview

                17.1.8.5.1. Marketing Strategy

                17.1.8.5.2. Product Strategy

                17.1.8.5.3. Channel Strategy

        17.1.9. Momentive Performance Materials Inc.

            17.1.9.1. Overview

            17.1.9.2. Product Portfolio

            17.1.9.3. Profitability by Market Segments

            17.1.9.4. Sales Footprint

            17.1.9.5. Strategy Overview

                17.1.9.5.1. Marketing Strategy

                17.1.9.5.2. Product Strategy

                17.1.9.5.3. Channel Strategy

        17.1.10. Showa Denko K.K.

            17.1.10.1. Overview

            17.1.10.2. Product Portfolio

            17.1.10.3. Profitability by Market Segments

            17.1.10.4. Sales Footprint

            17.1.10.5. Strategy Overview

                17.1.10.5.1. Marketing Strategy

                17.1.10.5.2. Product Strategy

                17.1.10.5.3. Channel Strategy

18. Assumptions & Acronyms Used

19. Research Methodology

Recommendations

Chemicals & Materials

Elastomeric Membrane Market

Published : February 2024

Chemicals & Materials

Butyl Elastomers Market

Published : November 2022

Chemicals & Materials

APAC Fluoroelastomer Market

Published : November 2022

Chemicals & Materials

Chlorinated Polyethylene Resins and Elastomers (CPE) Market

Published : June 2022

Explore Chemicals & Materials Insights

View Reports

Performance Elastomer Market