High-Performance Computing Market Size and Share Forecast Outlook 2025 to 2035

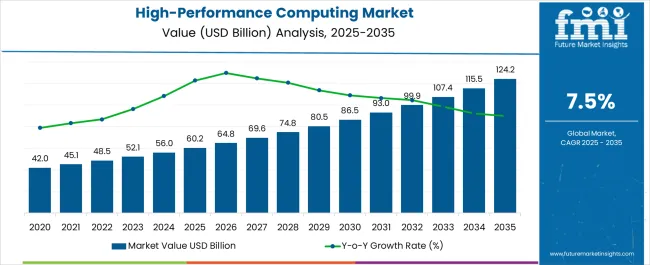
The High-Performance Computing Market is estimated to be valued at USD 60.2 billion in 2025 and is projected to reach USD 124.2 billion by 2035, registering a compound annual growth rate (CAGR) of 7.5% over the forecast period.
Quick Stats for High-Performance Computing Market

  • High-Performance Computing Market Industry Value (2025): USD 60.2 billion
  • High-Performance Computing Market Forecast Value (2035): USD 124.2 billion
  • High-Performance Computing Market Forecast CAGR: 7.5%
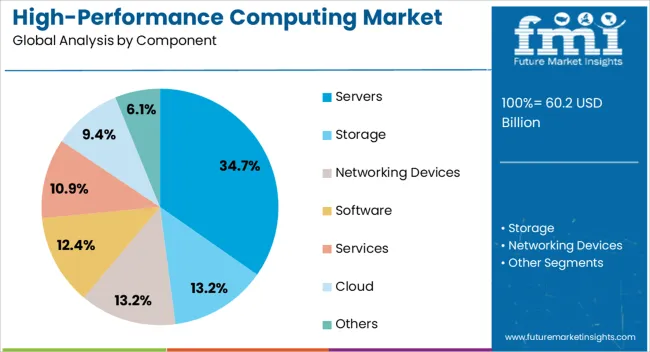
  • Leading Segment in High-Performance Computing Market in 2025: Servers (34.7%)
  • Key Growth Region in High-Performance Computing Market: North America, Asia-Pacific, Europe
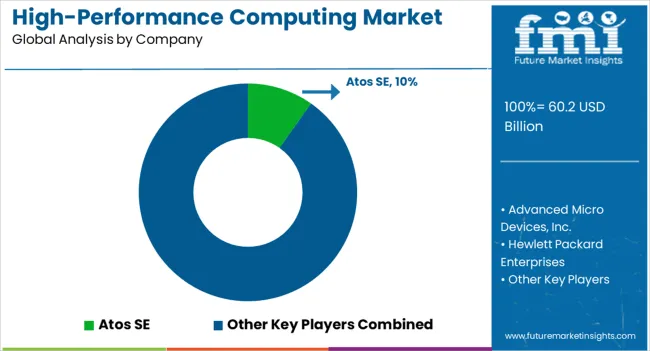
  • Top Key Players in High-Performance Computing Market: Atos SE, Advanced Micro Devices, Inc., Hewlett Packard Enterprises, Dell Inc., Cisco Systems, Inc., Fujitsu, Intel Corporation, IBM, Microsoft, Amazon Web Services, Inc.

High Performance Computing Market Market Value Analysis

Metric Value
High-Performance Computing Market Estimated Value in (2025 E) USD 60.2 billion
High-Performance Computing Market Forecast Value in (2035 F) USD 124.2 billion
Forecast CAGR (2025 to 2035) 7.5%

Rationale for Segmental Growth in the High Performance Computing Market

The high performance computing market is expanding rapidly as enterprises and institutions adopt advanced computing capabilities to handle increasingly complex workloads. Rising demand for faster data processing, real time analytics, and artificial intelligence applications has strengthened the relevance of high performance systems across multiple industries.

Government initiatives supporting technological infrastructure, coupled with investments in research and development, are propelling adoption. The combination of enhanced processor architectures, improved storage solutions, and energy efficient designs has also enabled broader deployment.

As industries prioritize digital transformation and competitive advantage through computational power, the outlook for high performance computing remains positive, with opportunities for growth across both commercial and scientific applications.
Segmental Analysis

Insights into the Servers Component Segment

High Performance Computing Market Analysis By Component

The servers segment is expected to hold 34.70% of total revenue by 2025 within the component category, making it the leading contributor. This growth is being driven by the central role of servers in delivering scalable processing capacity and efficient workload management.

Continuous advancements in processor design, memory integration, and high bandwidth interconnects have reinforced their adoption in both enterprise and research environments. Furthermore, the increasing application of high performance servers in machine learning, big data analytics, and advanced simulations has positioned this segment as the backbone of computing infrastructure.

The ability of servers to provide flexible, modular, and reliable solutions ensures their ongoing leadership within the component segment.
Insights into the On Premise Deployment Segment

High Performance Computing Market Analysis By Deployment

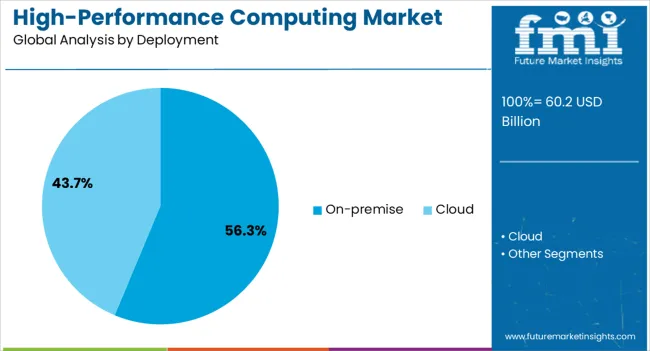
The on premise deployment segment is projected to contribute 56.30% of total market revenue by 2025, securing its dominance within the deployment category. Its leadership is attributed to the need for enhanced security, regulatory compliance, and full control over computing infrastructure.

Industries handling sensitive data, including finance, healthcare, and defense, continue to prioritize on premise installations to safeguard operations. High levels of customization and integration with existing IT frameworks further strengthen adoption.

Additionally, the ability to manage performance intensive workloads without dependency on third party cloud providers has sustained its dominance. This segment continues to lead as organizations balance scalability with stringent governance requirements.
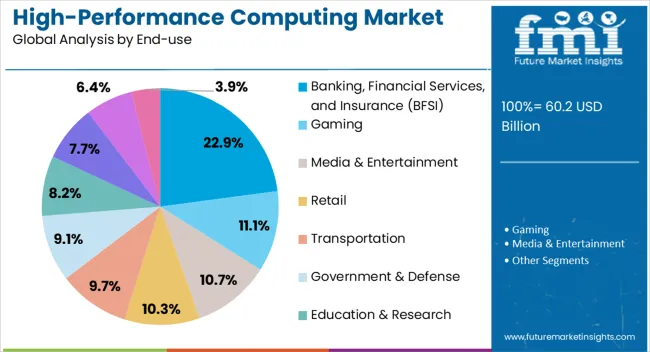
Insights into the Banking Financial Services and Insurance End Use Segment

High Performance Computing Market Analysis By End Use

The banking financial services and insurance segment is expected to hold 22.90% of total revenue by 2025 within the end use category, establishing it as the leading industry adopter. The increasing reliance on high performance computing for risk modeling, fraud detection, and real time transaction monitoring has strengthened its adoption.

Institutions within the BFSI sector are leveraging HPC capabilities to process vast volumes of data, improve predictive analytics, and comply with regulatory demands for transparency. Additionally, the growing use of algorithmic trading and advanced financial simulations has reinforced demand.

With its critical dependence on speed, accuracy, and data security, the BFSI sector has emerged as the most significant end use segment within the high performance computing market.

Market Forecast: Previous 2020 to 2025 vs. Present 2025 to 2035

With a CAGR of 12.28% from 2020 to 2025, the global high-performance computing market increased in value from USD 42 billion in 2020 to USD 60.2 billion in 2025. It is necessary to create powerful HPC systems, implement them across academic, commercial, and governmental institutions, and use them to tackle social issues, including public safety, weather forecasting, climate change, and environmental preservation.

Many advantages are offered by computing technology advancements, including quick processing speeds, improved performance effectiveness, smart operation, and management. These advantages may help the market grow during the anticipated period. Whereas, from 2025 to 2035, the high-performance computing market is to register at a 7.5% CAGR.

The factor propelling the HPC market expansion is the rise in high-performance computing demand in genomics research. The high-performance computing demand for improved scalability, dependable storage, IT expansion, rising computing, and virtualization advancement enhance the market growth.

As high-performance computing systems can process enormous volumes of data swiftly and are widely used in industries, there is an increase in high-performance computing adoption, which has an impact on the market.

Strategic Analysis for High-performance Computing Market

  • The Industrial Internet of Things (IIoT), Artificial Intelligence (AI), and engineering, which require Electronic Design Automation (EDA), are factors that are anticipated to boost the high-performance computing business.
  • The high-performance computing industry has been expanded with the hardware manufacturers' ongoing investments in the creation of solutions that enable these capabilities.
  • The importance of technology as a crucial engine for economic growth has been acknowledged by nations such as the United States, Germany, the United Kingdom, Japan, and China, among others.

Determinants of the High-performance Computing Market

Enhanced adoption of Big Data Analytics is a Critical Enabler Influencing the Adoption of the High-performance Computing Market

In light of the growing use of big data analytics, the demand for supercomputers has skyrocketed. The extraction of insights from large data is becoming popular. This necessitates the development of improved computing infrastructure. Supercomputers are perfect for processing massive volumes of data available on the market due to their ample storage and strong processing capabilities.

This is evident in the financial services business, where corporations like PayPal have purchased cluster supercomputers in the previous two to three years. The introduction of additional sophisticated analytics methods and tools is gaining traction among organizations to maximize the intelligence obtained from big data analytics. Over the projected period, all these factors may drive the high-performance computing (HPC) market expansion.

Investment Opportunities in the High-performance Computing Business

A Significant High-performance Computing Market Trend Fostering Market Expansion is Evolving Adoption of Cloud

Some customers require the elasticity and flexibility of the cloud to fulfill their computational and data needs.

  • The Azure cloud offering may be used to run HPC workloads, and customers can use CycleCloud for hybrid HPC management. Azure cloud offering components include Azure virtual machines, data lake storage, Microsoft AI platform, and Azure machine learning services.
  • By enabling clients that don't have their own systems and data centers to perform HPC, AI, and advanced analytics workloads in the public cloud, this agreement increases the market for Cray.
  • The automotive, financial services, and life sciences industries have all expressed an interest in employing cloud services for supercomputers. This surge in interest may fuel the expansion of the high-performance computing industry during the forecast period.
  • The expanding popularity of cloud computing, together with digitization measures being implemented by various governments, can have a substantial impact on propelling high-performance computing sales growth over the projection period.
  • The government of the United Arab Emirates (UAE), for example, has established digital transformation initiatives such as Smart Abu Dhabi and Smart Dubai. These projects encourage the use of cloud computing and increase the high-performance computing demand.

Challenges Confronting the High-performance Computing Industry

Factor Impeding the High-performance Computing Market Growth is Expensive Investments and Associated Costs

  • A supercomputer from IBM Watson costs roughly USD 3 million. The construction and operating expenditures of Fujitsu's K Computer for the Riken Advanced Institute of Computational Science in Kobe, Japan, are almost USD 1.2 billion.
  • Supercomputers and other HPC systems typically consume 6-7 megawatts of power, with peaks exceeding 9.50 megawatts. When the power used by this equipment is converted into an energy cost, the amount is between USD6 and USD 7 million.

The energy needs for these improved HPC systems may go up because of the regular updates made to increase processing power. Cost increases can impede the expansion of the HPC sector.

Lack of experience and the high cost of high-performance computing upkeep are impediments to the industry's expansion. The absence of developments in high-performance workstations is one of the industry's stumbling blocks.

Concerns related to cyber security are growing as the use of HPC systems expands. Data security is a serious concern because HPC systems are accessed by various entities. As a result, the high-performance computing industry's expansion is projected to be hindered by security concerns.

Segmentation Outlook

Which Component is estimated to Experience Great Demand?

Services Segment:

CAGR (2025 to 2035) Around 5.0%
Market Share - 2025 >9.0%
Market Size USD 7,000 million

Servers Segment:

Market Share - 2025 41%

The component segment has been further subdivided into servers, networking devices, storage, software, cloud, services, and others. The servers segment held the dominant share of the high-performance computing industry in 2025 and is scheduled to thrive at a substantial rate during the forecast period.

The growing amount of data centers can be linked to the proliferation of small and medium-sized businesses (SMEs). Several firms are investing in on-premises and colocation infrastructure to meet the increased high-performance computing demand.

The services sector made for more than 9.0% of the HPC market in 2025, and it is anticipated to register a CAGR of around 5.0% between 2025 and 2035. The HPC manufacturers offer a variety of services, such as maintenance, support, and management.

Assistance is especially important during the installation and first use of HPC systems. Maintenance services, on the other hand, include system upgrades and troubleshooting. In conclusion, it is predicted that the services segment's market can prosper to be large than USD 7,000 million over the forecast year.

Why are On-premise Sales Garnering Steam?

On-Premise Segment:

Market Share - 2025 80%
Market Size USD 32,592.7 million

Cloud Segment:

Market CAGR 8.5%

In 2025, the on-premise category held the dominant share of the high-performance computing industry and is to rise significantly throughout the forecast period. While governments are focused on securing sensitive data relating to national security and citizens' personal information, businesses are concerned about the security of their own organizational data. As a result, on-premise infrastructure continues to be chosen over cloud technology.

  • For example, in Mexico, the Data Protection Regulations, which went into effect in 2010, allow for the spread of data assets within the country. The government's approach to data security remains protectionist.

To ensure national security, the Mexican government, for example, claims that all citizen-related information and information used by government agencies should remain within the country's jurisdiction. Such elements are projected to promote the on-premise segment's growth.

Throughout the projection period, the cloud segment is to develop at a significant CAGR of 8.5% in the high-performance computing business. Since no additional in-house computing resources are required, cloud implementation allows enterprises to cut their operational costs. Additional benefits, such as enhanced efficiency and cost-effectiveness, are likely to accelerate the rise of the cloud segment.

How does the Government and Defence Segment Dictate in this Area?

Government and Defence Segment:

Market CAGR 9.0%

The manufacturing segment is to witness a significant HPC market share during the predicted period. Industrial operations are typically computationally intensive and time-consuming. Manufacturing companies frequently use simulation and CAD software in conjunction with HPC systems.

HPC systems can be very beneficial in the manufacturing industry for computational fluid dynamics, computational structural mechanics, and computational electromagnetics. These characteristics boost performance, increase computational speeds, and assure quick data access.

The government and defense segment is to increase at a CAGR of 9.0% in the high-performance computing business. While defense organizations may actively acquire cutting-edge IT solutions to boost computing efficiency, government agencies may likely need to employ HPC systems to support digitalization projects and contribute to economic development.
Regional Outlook

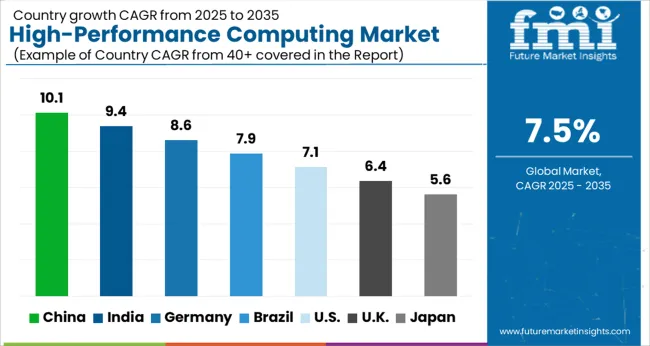
High Performance Computing Market Cagr Analysis By Country

Why Should High-performance Computing Manufacturers Concentrate on North America?

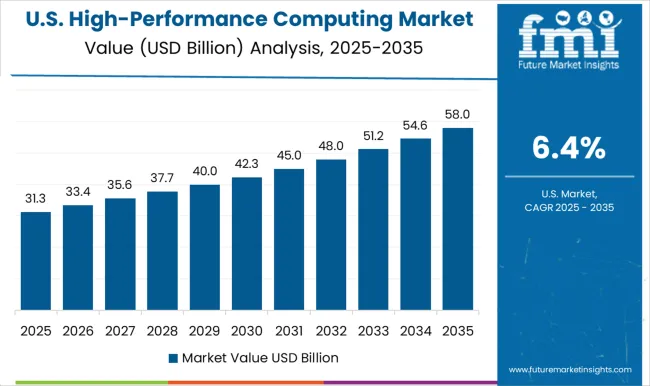
High Performance Computing Market Country Value Analysis

Attributes Details
Market Share 40%

In 2025, North America continued to hold 40.0% of the entire high-performance computing market share. North America is the most important market for technological solutions. Its goal is to be a global economic player, particularly in the development and application of innovative technologies. Since the need to process large amounts of raw data grows, so does the need to have strong security measures in place. This is pushing the need to apply cutting-edge technology, which is encouraging the use of HPC systems.

Several of the top businesses in the sector are based in North America that are quickly adopting HPC systems to help them get over technical limitations. As a result, the adoption of HPC systems is ramping up throughout North America.

Why is Asia Pacific a Stellar Market for High-performance Computing Manufacturers?

Attributes Details
Market CAGR 8.9%

Due to the increasing HPC systems adoption for scientific research and weather forecasting, the Asia Pacific region is expected to develop at a considerable CAGR of about 8.9% throughout the forecast period. At the same time, China is one of the top ten countries in the high-performance computing business.

Supercomputers such as Sunway TaihuLight and Tianhe-2 (Milkyway-2) can be found in China. Tianhe-2 (Milkyway-2) was developed by China's National University of Defence Technology and supported by the governments of Guangzhou and Guangdong provinces.

What Effect Does Competition Have on the High-performance Computing Market?

The global high-performance computing business is a highly concentrated and competitive market dominated by a few significant firms. Various governments encourage research and academic institutions to implement modern information technology systems and contribute to economic development.

Acquisition - January 2025

  • NVIDIA Corporation, a US-based software company that provided GPUs, SoCs, and APIs, paid an undisclosed sum in January 2025 to acquire Bright Computing, a US-based firm that provides HPC and ML automation and management software.
  • NVIDIA Corporation increases its accelerated computing capabilities with the acquisition by offering its Bright Cluster Manager solution and generating new business prospects.

Acquisition - July 2024

  • By acquiring Zerto, a pioneer in cloud data management and protection, Hewlett Packard Enterprise may enhance its HPE GreenLake Edge-to-Cloud Platform.

Partnership - November 2024

  • Intel partnered with HPE, an American multinational enterprise information technology business, and Argonne, a science and engineering research national laboratory administered by UChicago Argonne for the United States Department of Energy.

Collaboration - 2020

  • The Garvan Institute of Medicine collaborated with Dell Technologies, Inc. in August 2020 to leverage high-performance computing in genomics research.

Key Players

High Performance Computing Market Analysis By Company
  • Hewlett Packard Enterprise Development LP
  • Dell Inc.
  • Atos SE
  • Advanced Micro Devices, Inc
  • Microsoft
  • Amazon Web Services, Inc.
  • Cisco Systems, Inc.
  • Fujitsu
  • Intel Corporation
  • IBM

Key Segments

By Component:

  • Servers
  • Storage
  • Networking Devices
  • Software
  • Services
  • Cloud
  • Others

By Deployment:

  • On-premise
  • Cloud

By End-use:

  • Banking, Financial Services, and Insurance (BFSI)
  • Gaming
  • Media & Entertainment
  • Retail
  • Transportation
  • Government & Defense
  • Education & Research
  • Manufacturing
  • Healthcare & Bioscience
  • Others

By Region:

  • North America
  • Europe
  • Asia Pacific
  • Latin America
  • The Middle East & Africa

Table of Content

  1. Executive Summary
    • Global Market Outlook
    • Demand-side Trends
    • Supply-side Trends
    • Technology Roadmap Analysis
    • Analysis and Recommendations
  2. Market Overview
    • Market Coverage / Taxonomy
    • Market Definition / Scope / Limitations
  3. Market Background
    • Market Dynamics
      • Drivers
      • Restraints
      • Opportunity
      • Trends
    • Scenario Forecast
      • Demand in Optimistic Scenario
      • Demand in Likely Scenario
      • Demand in Conservative Scenario
    • Opportunity Map Analysis
    • Product Life Cycle Analysis
    • Supply Chain Analysis
    • Investment Feasibility Matrix
    • Value Chain Analysis
    • PESTLE and Porter's Analysis
    • Regulatory Landscape
    • Regional Parent Market Outlook
    • Production and Consumption Statistics
    • Import and Export Statistics
  4. Global Market Analysis 2020 to 2024 and Forecast, 2025 to 2035
    • Historical Market Size Value (USD Million) Analysis, 2020 to 2024
    • Current and Future Market Size Value (USD Million) Projections, 2025 to 2035
      • Y-o-Y Growth Trend Analysis
      • Absolute $ Opportunity Analysis
  5. Global Market Pricing Analysis 2020 to 2024 and Forecast 2025 to 2035
  6. Global Market Analysis 2020 to 2024 and Forecast 2025 to 2035, By Component
    • Introduction / Key Findings
    • Historical Market Size Value (USD Million) Analysis By Component , 2020 to 2024
    • Current and Future Market Size Value (USD Million) Analysis and Forecast By Component , 2025 to 2035
      • Servers
      • Storage
      • Networking Devices
      • Software
      • Services
      • Cloud
      • Others
    • Y-o-Y Growth Trend Analysis By Component , 2020 to 2024
    • Absolute $ Opportunity Analysis By Component , 2025 to 2035
  7. Global Market Analysis 2020 to 2024 and Forecast 2025 to 2035, By Deployment
    • Introduction / Key Findings
    • Historical Market Size Value (USD Million) Analysis By Deployment, 2020 to 2024
    • Current and Future Market Size Value (USD Million) Analysis and Forecast By Deployment, 2025 to 2035
      • On-premise
      • Cloud
    • Y-o-Y Growth Trend Analysis By Deployment, 2020 to 2024
    • Absolute $ Opportunity Analysis By Deployment, 2025 to 2035
  8. Global Market Analysis 2020 to 2024 and Forecast 2025 to 2035, By End-use
    • Introduction / Key Findings
    • Historical Market Size Value (USD Million) Analysis By End-use, 2020 to 2024
    • Current and Future Market Size Value (USD Million) Analysis and Forecast By End-use, 2025 to 2035
      • Banking, Financial Services, and Insurance (BFSI)
      • Gaming
      • Media & Entertainment
      • Retail
      • Transportation
      • Government & Defense
      • Education & Research
      • Manufacturing
      • Healthcare & Bioscience
      • Others
    • Y-o-Y Growth Trend Analysis By End-use, 2020 to 2024
    • Absolute $ Opportunity Analysis By End-use, 2025 to 2035
  9. Global Market Analysis 2020 to 2024 and Forecast 2025 to 2035, By Region
    • Introduction
    • Historical Market Size Value (USD Million) Analysis By Region, 2020 to 2024
    • Current Market Size Value (USD Million) Analysis and Forecast By Region, 2025 to 2035
      • North America
      • Latin America
      • Western Europe
      • Eastern Europe
      • East Asia
      • South Asia and Pacific
      • Middle East & Africa
    • Market Attractiveness Analysis By Region
  10. North America Market Analysis 2020 to 2024 and Forecast 2025 to 2035, By Country
    • Historical Market Size Value (USD Million) Trend Analysis By Market Taxonomy, 2020 to 2024
    • Market Size Value (USD Million) Forecast By Market Taxonomy, 2025 to 2035
      • By Country
        • USA
        • Canada
        • Mexico
      • By Component
      • By Deployment
      • By End-use
    • Market Attractiveness Analysis
      • By Country
      • By Component
      • By Deployment
      • By End-use
    • Key Takeaways
  11. Latin America Market Analysis 2020 to 2024 and Forecast 2025 to 2035, By Country
    • Historical Market Size Value (USD Million) Trend Analysis By Market Taxonomy, 2020 to 2024
    • Market Size Value (USD Million) Forecast By Market Taxonomy, 2025 to 2035
      • By Country
        • Brazil
        • Chile
        • Rest of Latin America
      • By Component
      • By Deployment
      • By End-use
    • Market Attractiveness Analysis
      • By Country
      • By Component
      • By Deployment
      • By End-use
    • Key Takeaways
  12. Western Europe Market Analysis 2020 to 2024 and Forecast 2025 to 2035, By Country
    • Historical Market Size Value (USD Million) Trend Analysis By Market Taxonomy, 2020 to 2024
    • Market Size Value (USD Million) Forecast By Market Taxonomy, 2025 to 2035
      • By Country
        • Germany
        • UK
        • Italy
        • Spain
        • France
        • Nordic
        • BENELUX
        • Rest of Western Europe
      • By Component
      • By Deployment
      • By End-use
    • Market Attractiveness Analysis
      • By Country
      • By Component
      • By Deployment
      • By End-use
    • Key Takeaways
  13. Eastern Europe Market Analysis 2020 to 2024 and Forecast 2025 to 2035, By Country
    • Historical Market Size Value (USD Million) Trend Analysis By Market Taxonomy, 2020 to 2024
    • Market Size Value (USD Million) Forecast By Market Taxonomy, 2025 to 2035
      • By Country
        • Russia
        • Poland
        • Hungary
        • Balkan & Baltic
        • Rest of Eastern Europe
      • By Component
      • By Deployment
      • By End-use
    • Market Attractiveness Analysis
      • By Country
      • By Component
      • By Deployment
      • By End-use
    • Key Takeaways
  14. East Asia Market Analysis 2020 to 2024 and Forecast 2025 to 2035, By Country
    • Historical Market Size Value (USD Million) Trend Analysis By Market Taxonomy, 2020 to 2024
    • Market Size Value (USD Million) Forecast By Market Taxonomy, 2025 to 2035
      • By Country
        • China
        • Japan
        • South Korea
      • By Component
      • By Deployment
      • By End-use
    • Market Attractiveness Analysis
      • By Country
      • By Component
      • By Deployment
      • By End-use
    • Key Takeaways
  15. South Asia and Pacific Market Analysis 2020 to 2024 and Forecast 2025 to 2035, By Country
    • Historical Market Size Value (USD Million) Trend Analysis By Market Taxonomy, 2020 to 2024
    • Market Size Value (USD Million) Forecast By Market Taxonomy, 2025 to 2035
      • By Country
        • India
        • ASEAN
        • Australia & New Zealand
        • Rest of South Asia and Pacific
      • By Component
      • By Deployment
      • By End-use
    • Market Attractiveness Analysis
      • By Country
      • By Component
      • By Deployment
      • By End-use
    • Key Takeaways
  16. Middle East & Africa Market Analysis 2020 to 2024 and Forecast 2025 to 2035, By Country
    • Historical Market Size Value (USD Million) Trend Analysis By Market Taxonomy, 2020 to 2024
    • Market Size Value (USD Million) Forecast By Market Taxonomy, 2025 to 2035
      • By Country
        • Kingdom of Saudi Arabia
        • Other GCC Countries
        • Turkiye
        • South Africa
        • Other African Union
        • Rest of Middle East & Africa
      • By Component
      • By Deployment
      • By End-use
    • Market Attractiveness Analysis
      • By Country
      • By Component
      • By Deployment
      • By End-use
    • Key Takeaways
  17. Key Countries Market Analysis
    • USA
      • Pricing Analysis
      • Market Share Analysis, 2024
        • By Component
        • By Deployment
        • By End-use
    • Canada
      • Pricing Analysis
      • Market Share Analysis, 2024
        • By Component
        • By Deployment
        • By End-use
    • Mexico
      • Pricing Analysis
      • Market Share Analysis, 2024
        • By Component
        • By Deployment
        • By End-use
    • Brazil
      • Pricing Analysis
      • Market Share Analysis, 2024
        • By Component
        • By Deployment
        • By End-use
    • Chile
      • Pricing Analysis
      • Market Share Analysis, 2024
        • By Component
        • By Deployment
        • By End-use
    • Germany
      • Pricing Analysis
      • Market Share Analysis, 2024
        • By Component
        • By Deployment
        • By End-use
    • UK
      • Pricing Analysis
      • Market Share Analysis, 2024
        • By Component
        • By Deployment
        • By End-use
    • Italy
      • Pricing Analysis
      • Market Share Analysis, 2024
        • By Component
        • By Deployment
        • By End-use
    • Spain
      • Pricing Analysis
      • Market Share Analysis, 2024
        • By Component
        • By Deployment
        • By End-use
    • France
      • Pricing Analysis
      • Market Share Analysis, 2024
        • By Component
        • By Deployment
        • By End-use
    • India
      • Pricing Analysis
      • Market Share Analysis, 2024
        • By Component
        • By Deployment
        • By End-use
    • ASEAN
      • Pricing Analysis
      • Market Share Analysis, 2024
        • By Component
        • By Deployment
        • By End-use
    • Australia & New Zealand
      • Pricing Analysis
      • Market Share Analysis, 2024
        • By Component
        • By Deployment
        • By End-use
    • China
      • Pricing Analysis
      • Market Share Analysis, 2024
        • By Component
        • By Deployment
        • By End-use
    • Japan
      • Pricing Analysis
      • Market Share Analysis, 2024
        • By Component
        • By Deployment
        • By End-use
    • South Korea
      • Pricing Analysis
      • Market Share Analysis, 2024
        • By Component
        • By Deployment
        • By End-use
    • Russia
      • Pricing Analysis
      • Market Share Analysis, 2024
        • By Component
        • By Deployment
        • By End-use
    • Poland
      • Pricing Analysis
      • Market Share Analysis, 2024
        • By Component
        • By Deployment
        • By End-use
    • Hungary
      • Pricing Analysis
      • Market Share Analysis, 2024
        • By Component
        • By Deployment
        • By End-use
    • Kingdom of Saudi Arabia
      • Pricing Analysis
      • Market Share Analysis, 2024
        • By Component
        • By Deployment
        • By End-use
    • Turkiye
      • Pricing Analysis
      • Market Share Analysis, 2024
        • By Component
        • By Deployment
        • By End-use
    • South Africa
      • Pricing Analysis
      • Market Share Analysis, 2024
        • By Component
        • By Deployment
        • By End-use
  18. Market Structure Analysis
    • Competition Dashboard
    • Competition Benchmarking
    • Market Share Analysis of Top Players
      • By Regional
      • By Component
      • By Deployment
      • By End-use
  19. Competition Analysis
    • Competition Deep Dive
      • Atos SE
        • Overview
        • Product Portfolio
        • Profitability by Market Segments (Product/Age /Sales Channel/Region)
        • Sales Footprint
        • Strategy Overview
          • Marketing Strategy
          • Product Strategy
          • Channel Strategy
      • Advanced Micro Devices, Inc.
      • Hewlett Packard Enterprises
      • Dell Inc.
      • Cisco Systems, Inc.
      • Fujitsu
      • Intel Corporation
      • IBM
      • Microsoft
      • Amazon Web Services, Inc.
  20. Assumptions & Acronyms Used
  21. Research Methodology

List of Tables

  • Table 1: Global Market Value (USD Million) Forecast by Region, 2020-2035
  • Table 2: Global Market Value (USD Million) Forecast by Component , 2020-2035
  • Table 3: Global Market Value (USD Million) Forecast by Deployment, 2020-2035
  • Table 4: Global Market Value (USD Million) Forecast by End-use, 2020-2035
  • Table 5: North America Market Value (USD Million) Forecast by Country, 2020-2035
  • Table 6: North America Market Value (USD Million) Forecast by Component , 2020-2035
  • Table 7: North America Market Value (USD Million) Forecast by Deployment, 2020-2035
  • Table 8: North America Market Value (USD Million) Forecast by End-use, 2020-2035
  • Table 9: Latin America Market Value (USD Million) Forecast by Country, 2020-2035
  • Table 10: Latin America Market Value (USD Million) Forecast by Component , 2020-2035
  • Table 11: Latin America Market Value (USD Million) Forecast by Deployment, 2020-2035
  • Table 12: Latin America Market Value (USD Million) Forecast by End-use, 2020-2035
  • Table 13: Western Europe Market Value (USD Million) Forecast by Country, 2020-2035
  • Table 14: Western Europe Market Value (USD Million) Forecast by Component , 2020-2035
  • Table 15: Western Europe Market Value (USD Million) Forecast by Deployment, 2020-2035
  • Table 16: Western Europe Market Value (USD Million) Forecast by End-use, 2020-2035
  • Table 17: Eastern Europe Market Value (USD Million) Forecast by Country, 2020-2035
  • Table 18: Eastern Europe Market Value (USD Million) Forecast by Component , 2020-2035
  • Table 19: Eastern Europe Market Value (USD Million) Forecast by Deployment, 2020-2035
  • Table 20: Eastern Europe Market Value (USD Million) Forecast by End-use, 2020-2035
  • Table 21: East Asia Market Value (USD Million) Forecast by Country, 2020-2035
  • Table 22: East Asia Market Value (USD Million) Forecast by Component , 2020-2035
  • Table 23: East Asia Market Value (USD Million) Forecast by Deployment, 2020-2035
  • Table 24: East Asia Market Value (USD Million) Forecast by End-use, 2020-2035
  • Table 25: South Asia and Pacific Market Value (USD Million) Forecast by Country, 2020-2035
  • Table 26: South Asia and Pacific Market Value (USD Million) Forecast by Component , 2020-2035
  • Table 27: South Asia and Pacific Market Value (USD Million) Forecast by Deployment, 2020-2035
  • Table 28: South Asia and Pacific Market Value (USD Million) Forecast by End-use, 2020-2035
  • Table 29: Middle East & Africa Market Value (USD Million) Forecast by Country, 2020-2035
  • Table 30: Middle East & Africa Market Value (USD Million) Forecast by Component , 2020-2035
  • Table 31: Middle East & Africa Market Value (USD Million) Forecast by Deployment, 2020-2035
  • Table 32: Middle East & Africa Market Value (USD Million) Forecast by End-use, 2020-2035

List of Figures

  • Figure 1: Global Market Pricing Analysis
  • Figure 2: Global Market Value (USD Million) Forecast 2020-2035
  • Figure 3: Global Market Value (USD Million) Share and BPS Analysis by Region, 2025 and 2035
  • Figure 4: Global Market Y-o-Y Growth Comparison by Region, 2025-2035
  • Figure 5: Global Market Attractiveness Analysis by Region
  • Figure 6: North America Market Incremental Dollar Opportunity, 2025-2035
  • Figure 7: Latin America Market Incremental Dollar Opportunity, 2025-2035
  • Figure 8: Western Europe Market Incremental Dollar Opportunity, 2025-2035
  • Figure 9: Eastern Europe Market Incremental Dollar Opportunity, 2025-2035
  • Figure 10: East Asia Market Incremental Dollar Opportunity, 2025-2035
  • Figure 11: South Asia and Pacific Market Incremental Dollar Opportunity, 2025-2035
  • Figure 12: Middle East & Africa Market Incremental Dollar Opportunity, 2025-2035
  • Figure 13: North America Market Value Share and BPS Analysis by Country, 2025 and 2035
  • Figure 14: Latin America Market Value Share and BPS Analysis by Country, 2025 and 2035
  • Figure 15: Western Europe Market Value Share and BPS Analysis by Country, 2025 and 2035
  • Figure 16: Eastern Europe Market Value Share and BPS Analysis by Country, 2025 and 2035
  • Figure 17: East Asia Market Value Share and BPS Analysis by Country, 2025 and 2035
  • Figure 18: South Asia and Pacific Market Value Share and BPS Analysis by Country, 2025 and 2035
  • Figure 19: Middle East & Africa Market Value Share and BPS Analysis by Country, 2025 and 2035
  • Figure 20: Global Market - Tier Structure Analysis
  • Figure 21: Global Market - Company Share Analysis

Frequently Asked Questions

How big is the high-performance computing market in 2025?

The global high-performance computing market is estimated to be valued at USD 60.2 billion in 2025.

What will be the size of high-performance computing market in 2035?

The market size for the high-performance computing market is projected to reach USD 124.2 billion by 2035.

How much will be the high-performance computing market growth between 2025 and 2035?

The high-performance computing market is expected to grow at a 7.5% CAGR between 2025 and 2035.

What are the key product types in the high-performance computing market?

The key product types in high-performance computing market are servers, storage, networking devices, software, services, cloud and others.

Which deployment segment to contribute significant share in the high-performance computing market in 2025?

In terms of deployment, on-premise segment to command 56.3% share in the high-performance computing market in 2025.

Explore Similar Insights

Future Market Insights

High-Performance Computing Market

Chat With

MaRIA

Hi There, I am MaRIA, Your Market Research Intelligence Assistant. How may I help you?