Reports

- Global Locations -

Headquarters

Future Market Insights, Inc.

Christiana Corporate, 200
Continental Drive, Suite 401,
Newark, Delaware - 19713,
United States

T: +1-845-579-5705

Americas

Future Market Insights, Inc.

616 Corporate Way, Suite 2-9018,
Valley Cottage, NY 10989, United States

T: +1-347-918-3531

MEA

Future Market Insights

1602-6 Jumeirah Bay X2 Tower, Plot No: JLT-PH2-X2A,
Jumeirah Lakes Towers, Dubai,
United Arab Emirates

Europe

Future Market Insights

3rd Floor, 207 Regent Street,
W1B 3HH London
United Kingdom

T: + 44 (0) 20 8123 9659
D: +44 (0) 20 3287 4268

Asia Pacific

Future Market Insights

IndiaLand Global Tech Park, Unit UG-1, Behind Grand HighStreet, Phase 1, Hinjawadi, MH, Pune – 411057, India

Swarm Computing Market Outlook (2023 to 2033)

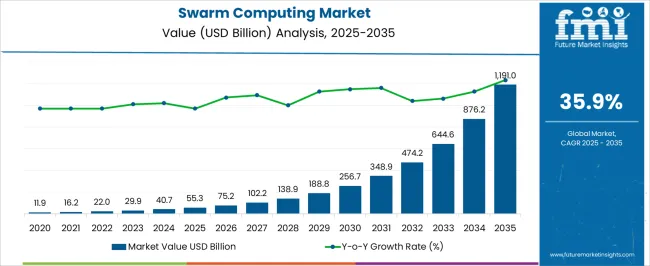
The global swarm computing market size is slated to gain astronomical growth from 2023 to 2033. According to the research report published by Future Market Insights, the global market is projected to surpass a valuation of US$ 29,211.9 million in 2023. It is predicted to hit a valuation of US$ 713,213.4 million by 2033. The market is foreseen to thrive at a monumental CAGR of 37.6% from 2023 to 2033.

A monumental increase in the market of Artificial Intelligence, Big Data analysis, and many other factors are expected to surge the application of swarm computing. This valuation is being made even though the market is still in its hatching stage, which shows the potential of this market going ahead.

Attributes Details
Swarm Computing Market Share (2022) US$ 21,500.1 million
Swarm Computing Market Share (2023) US$ 29,211.9 million
Swarm Computing Market Share (2033) US$ 713,213.4 million
Swarm Computing Market Share (CAGR) 37.6%

Swarm science is the collective behavior of decentralized, self-organized systems. This is evolutionary computing in a true sense because there are different types of swarm computing based on the application. Owing to its versatility, swarm economics is all set to scale new heights.

The computing is done through swarm art involves brainstorming from different samples and reaching a logical conclusion. This helps in maintaining an environment that is conducive for all, and not biased towards one or two samples.

Don't pay for what you don't need

Customize your report by selecting specific countries or regions and save 30%!

Key Drivers for the Swarm Computing Industry

Attributes Details
Automation Swarm computing provides automation for providing logical analysis of the most complex algorithms related to Artificial Intelligence and Machine Learning. This leads to the adoption of the Just In Time (JIT) approach, which is a crucial parameter for any kind of Operations Management.
Improved Decision Making Swarm computing considers different kinds of samples. After that, the analysis is carried out through an algorithm, which ensures all the processes are carried out based on the set standards. This is well expected to increase the swarm computing market share, as it makes use of the ‘Brain of Brains’.
Military Services The swarm computing is used in military drones. This is done to find the target and schedule the required object toward the target with precision.
Treatment of Tumors Another breakthrough application of swarm computing is that it is used for killing cancerous tumors. This is done by employing nanobots in the body which work on the swarm computing principle.
Data Mining Data mining involves analyzing and doing research based on the available data. Swarm computing performs effectively in data mining as well. This as well is expected to increase the demand for swarm computing.

Restraints for Swarm Computing Industry

Attributes Details
Still in Development Phase Despite several benefits offered by swarm computing, this application is still evolving. This might question the ambiguity of the process.
Lack of Knowledge Swarm computing makes use of some of the most advanced applications like Big data analysis, Machine Learning, etc. There are not much-skilled professionals throughout the world who may make the best of these applications.
Sudip Saha
Sudip Saha

Principal Consultant

Talk to Analyst

Find your sweet spots for generating winning opportunities in this market.

Future Opportunities for the Swarm Computing Industry

Swarm computing makes use of some of the most advanced applications like Big Data analysis, Machine Learning, etc. There are not much-skilled professionals throughout the world who may make the best of these applications.

Swarm Computing Market Historical Analysis (2018 to 2022) Vs. Forecast Outlook (2023 to 2033)

The global swarm computing industry size developed at a CAGR of 35.5% from 2018 to 2022. In 2018, the global market size stood at US$ 6,422.3 million. In the following years, the market witnessed remarkable growth, accounting for US$ 21,500.1 million in 2022.

The demand for swarm computing has increased dramatically with the expansion of IoT devices. As more devices are linked, swarm computing offers a method for quickly processing and analyzing the enormous volumes of data produced by IoT devices. By enabling advanced analytics and real-time decision-making at the network's edge, it minimizes the need for centralized processing. Swarm computing continues to find applications in a variety of fields, including healthcare, robotics, agriculture, logistics, and more. For instance, swarm algorithms assist with fleet management, traffic control, and route planning in logistics and transportation. Swarm robots in agriculture are capable of assisting with jobs like crop monitoring, precise farming, and autonomous harvesting. Swarm computing demand is anticipated to keep expanding due to its adaptability in solving complicated issues across a variety of sectors.

Historical CAGR (2018 to 2022) 35.5%
Forecasted CAGR (2023 to 2033) 37.6%

Get the data you need at a Fraction of the cost

Personalize your report by choosing insights you need
and save 40%!

Category-wise Insights

Which Algorithm Type is Witnessing Growth?

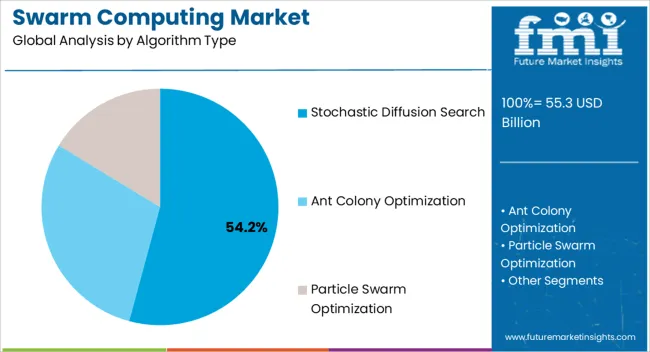
According to Future Market Insights, the Stochastic Diffusion Search (SDS) segment is predicted to advance at a colossal CAGR of 39.8% during the forecast period.

Application areas for SDS include but are not limited to, pattern detection in data mining, resource allocation in telecommunications, optimization of sensor networks, and logistic optimization issues. Its growth in the worldwide swarm computing industry is largely due to its adaptability and efficacy in a multitude of domains. SDS has advanced and improved largely due to ongoing research and development projects on swarm intelligence and optimization techniques. The algorithm's position in the swarm computing industry is further strengthened by researchers' ongoing exploration of innovative versions, enhancements, and applications.

Which End-use Industry is the Leading Employer of Swarm Computing?

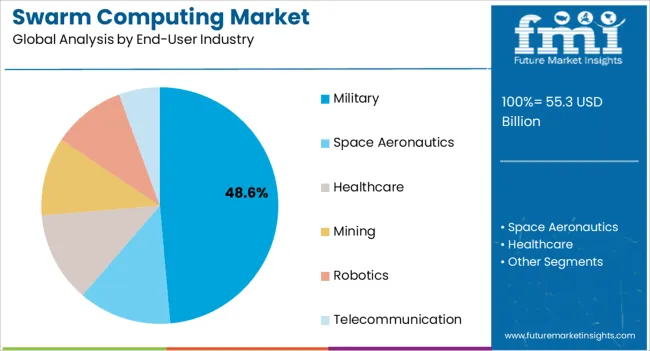
According to Future Market Insights, the robotics segment by end-user industry is projected to thrive at a striking CAGR of 20.5% from 2023 to 2033.

Swarm robots are capable of enhancing productivity and performance in a variety of environments. For instance, a swarm of robots in an automated warehouse may team up cooperatively to maximize order fulfillment, inventory control, and material handling. Swarm robots are capable of working together to complete tasks in agriculture including crop monitoring, pollination, and targeted spraying. Swarm robots' dispersed organization and collective intelligence lead to increased output and resource efficiency. The robotics end-user industry segment has grown by developments in robotics technology, such as miniaturization, sensor capabilities, communication systems, and power efficiency. These developments have made the deployment of swarms of robots more feasible and economical, enabling their incorporation across a variety of sectors and applications.

Comparative View of Adjacent Swarm Computing Market

Swarm Computing Market:

Attributes Swarm Computing Market
CAGR (2023 to 2033) 37.6%
Market Value (2023) US$ 29,211.9 million
Growth Factors
  • Increasing automation adoption across industries.
  • Growth of the Internet of Things.
  • Rising adoption across industries.
Future Opportunities Advances in Artificial Intelligence.
Market Trends Decreasing hardware costs.

Cloud Computing Market:

Attributes Cloud Computing Market
CAGR (2023 to 2033) 13.5%
Market Value (2023) US$ 2,062.26 million
Growth Factors
  • Increasing adoption of modern digital technologies such as Big Data analytics and AI.
  • Rising demand for storage, processing, and analysis capabilities.
  • Growing reliance Software-as-a-Service (SaaS) and Infrastructure-as-a-Service (IaaS) models.
Future Opportunities Growth of personal cloud computing services.
Market Trends Increasing adoption of work-from-home regime.

Spatial Computing Market:

Attributes Spatial Computing Market
CAGR (2023 to 2033) 18.4%
Market Value (2023) US$ 120.89 million
Growth Factors
  • Introduction of the metaverse.
  • Growing internet penetration.
  • Increasing proliferation of consumer electronics, such as laptops, smartphones, smart wearables, and others.
Future Opportunities Rise in industrial applications.
Market Trends Increasing gaming population.

Region-wise Insights

Region Detail
North America The North American swarm computing industry is anticipated to capture a 28.3% share during the forecast period, and it is expected to emerge as a dominant market for swarm computing. Increased investments in drones by the military, rapidly growing Robotics and Artificial Intelligence market in the region are expected to drive the market. Moreover, the availability of skilled professionals and rapid technological advancements in this region makes North America currently one of the leading markets for swarm computing.
Europe The European swarm computing industry is projected to occupy 23.1% shares during the forecast period. Increased usage for automation purposes and the ability of this application to kill cancerous tumors is expected to drive the demand for this market. Moreover, the healthcare sector is growing by leaps and bounds in this region, which further ensures an anticipated increase in the swarm computing market valuation. Additionally, several sectors are making use of data mining, which might further drive the market.
Asia Pacific Asia Pacific currently holds a huge market share, and if the analysts are to be believed, Asia-Pacific might very well become the leading market for swarm computing. Rapid urbanization, fast penetration of the internet, the surge in digitization, and rapid advances in technology are set to be the driving factors. In this region, India and China are the two nations responsible for this surge. With increasing usage of AI becoming common in this region, and robotics as well gaining momentum, the adoption of swarm computing is anticipated to surge in the region.

According to Future Market Insights, country-wise market estimates are listed below

Countries Forecasted CAGR (2023 to 2033)
United States 18.1%
United Kingdom 34.5%
China 40.2%
Japan 4.9%
India 32.2%

Start-up Ecosystem of Swarm Computing Industry

With various industries realizing the importance of swarm intelligence in decision-making, the start-up network of the swarm computing sector is looking for ways to integrate swarm computing with various other untapped applications.

Some of the start-ups are Swarm Engineering, Cubbit, Brainalysed, Agilox, and Reach Labs.

Name Swarm Engineering
Year of Establishment 2016
Service Offered Process Optimization
Description The machine learning algorithm developed by this startup is used for solving combinatorial problems, like demand, load, or production planning
Name Cubbit
Year of Establishment 2016
Service Offered Cloud Storage
Description The solution adopted by this start-up uses swarm computing for speed and accuracy, with each cell acting like a node in swarm. The peer-to-peer network of these cells enables secured, sustainable, and collaborative storage.
Name Brainalyzed
Year of Establishment 2017
Service Offered Financial Forecasting
Description This Start-up provides an AI platform for swarm intelligence. The solution enables scaling profits and predicting market movements. The startup’s platform combines artificial swarm intelligence with data analytics to improve decision-making.
Name AGRILOX
Year of Establishment 2017
Service Offered Long-range Wireless
Description The start-up makes use of swarm computing to develop Automated Guided Vehicles (AGV). The vehicles communicate with one another without any external control. The vehicles are also capable of retooling themselves.
Name Reach Labs
Year of Establishment 2014
Service Offered Intralogistics
Description The algorithm has been exclusively developed by this start-up. These offer swarm intelligence solutions for large, power-intensive instruments.

Competitive Landscape

The key market players are roping in swarm computing in the metaverse to make decision-making more accurate. Moreover, implementing swarm computing in the metaverse will ease forecasts, evaluations, assessments, and prioritizations for these companies.

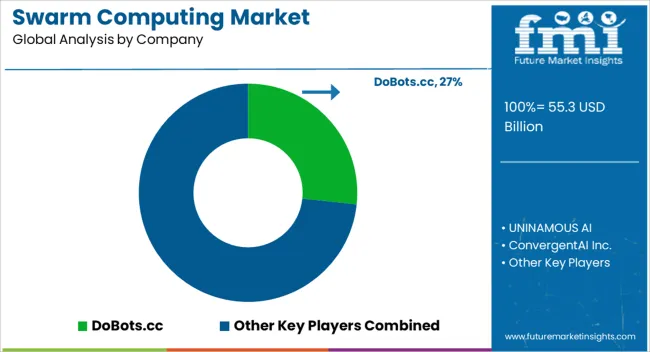
The key players are DoBot.cc, UNANIMOUS AI, ConvergentAI, Inc., SSI Schäfer Ltd., Valutico, Sentien Robotics, Unbox Robotics, Aquarela advanced, Axon AI, and Avidbots.

Company Name SSI Schäfer Ltd.
Year and Month July 2022
Recent Development SSI Schäfer Ltd and Fraunhofer IML established an enterprise lab. The lab mainly focuses on innovations for the future of logistics.
Company Name Axon AI
Year and Month June 2022
Recent Development Axon launched Simulator Training, which is the next piece of the company’s VR training platform. This enables the officers to sharpen their skills whenever and wherever on wireless VR headsets.
Company Name Avidbots
Year and Month July 2022
Recent Development Avidbots and Maplesoft announced their collaboration to bring more innovation to autonomous cleaning robots designed for commercial customers.

Key Players in the Global Market

  • DoBots.cc
  • UNINAMOUS AI
  • ConvergentAI Inc.
  • SSI Schäfer Ltd.
  • Valutico
  • Sentien Robotics
  • Unbox Robotics
  • Aquarela Advanced
  • Axon AI
  • Avidbots
  • Others

Scope of the Report

Attribute Details
Forecast Period 2023 to 2033
Historical Data Available for 2018 to 2022
Market Analysis US$ Million for Value
Key Regions Covered
  • North America
  • Latin America
  • Europe
  • Asia Pacific
  • Middle East & Africa (MEA)
Key Countries Covered
  • United States
  • Canada
  • Germany
  • United Kingdom
  • Nordic
  • Russia
  • BENELUX
  • Poland
  • France
  • Spain
  • Italy
  • Czech Republic
  • Hungary
  • Rest of EMEAI
  • Brazil
  • Peru
  • Argentina
  • Mexico
  • South Africa
  • Northern Africa
  • GCC Countries
  • China
  • Japan
  • South Korea
  • India
  • ASEAN
  • Thailand
  • Malaysia
  • Indonesia
  • Australia
  • New Zealand
  • Others
Key Segments Covered
  • Algorithm Type
  • End-user Industry
  • Region
Report Coverage Market Forecast, Company Share Analysis, Competition Intelligence, Trend Analysis, Market Dynamics and Challenges, and Strategic Growth Initiatives

Swarm Computing Market Segmentation

By Algorithm Type:

  • Stochastic Diffusion Search
  • Ant Colony Optimization
  • Particle Swarm Optimization

By End-user Industry:

  • Military
  • Space Aeronautics
  • Healthcare
  • Mining
  • Robotics
  • Telecommunication

By Region:

  • North America
  • Latin America
  • Europe
  • Asia Pacific
  • Middle East & Africa (MEA)

Frequently Asked Questions

What is the Growth Outlook of the Swarm Computing Market?

The global swarm computing market is estimated to record a CAGR of 37.6% during the forecast period.

What is the Projected Value of the Swarm Computing Market by 2033?

The global swarm computing market is predicted to be valued at US$ 713,213.4 million by 2033.

What was the Historical Size of the Swarm Computing Market?

The global market for swarm computing was valued at US$ 21,500.1 million in 2022.

Which Region Dominates the Global Swarm Computing Market?

North America accounts for the dominant revenue share of the global swarm computing industry.

Who are the Top Players in the Global Swarm Computing Market?

DoBots.cc, UNINAMOUS AI, ConvergentAI Inc., SSI Schäfer Ltd, Valutico, Sentien Robotics are a few top players in the global market for swarm computing.

Table of Content

1. Executive Summary

    1.1. Global Market Outlook

    1.2. Demand-side Trends

    1.3. Supply-side Trends

    1.4. Technology Roadmap Analysis

    1.5. Analysis and Recommendations

2. Market Overview

    2.1. Market Coverage / Taxonomy

    2.2. Market Definition / Scope / Limitations

3. Market Background

    3.1. Market Dynamics

        3.1.1. Drivers

        3.1.2. Restraints

        3.1.3. Opportunity

        3.1.4. Trends

    3.2. Scenario Forecast

        3.2.1. Demand in Optimistic Scenario

        3.2.2. Demand in Likely Scenario

        3.2.3. Demand in Conservative Scenario

    3.3. Opportunity Map Analysis

    3.4. Investment Feasibility Matrix

    3.5. PESTLE and Porter’s Analysis

    3.6. Regulatory Landscape

        3.6.1. By Key Regions

        3.6.2. By Key Countries

    3.7. Regional Parent Market Outlook

4. Global Market Analysis 2018 to 2022 and Forecast, 2023 to 2033

    4.1. Historical Market Size Value (US$ Million) Analysis, 2018 to 2022

    4.2. Current and Future Market Size Value (US$ Million) Projections, 2023 to 2033

        4.2.1. Y-o-Y Growth Trend Analysis

        4.2.2. Absolute $ Opportunity Analysis

5. Global Market Analysis 2018 to 2022 and Forecast 2023 to 2033, By Algorithm Type

    5.1. Introduction / Key Findings

    5.2. Historical Market Size Value (US$ Million) Analysis By Algorithm Type, 2018 to 2022

    5.3. Current and Future Market Size Value (US$ Million) Analysis and Forecast By Algorithm Type, 2023 to 2033

        5.3.1. Stochastic Diffusion Search

        5.3.2. Ant Colony Optimisation

        5.3.3. Particle Swarm Optimisation

    5.4. Y-o-Y Growth Trend Analysis By Algorithm Type, 2018 to 2022

    5.5. Absolute $ Opportunity Analysis By Algorithm Type, 2023 to 2033

6. Global Market Analysis 2018 to 2022 and Forecast 2023 to 2033, By End-User Industry

    6.1. Introduction / Key Findings

    6.2. Historical Market Size Value (US$ Million) Analysis By End-User Industry, 2018 to 2022

    6.3. Current and Future Market Size Value (US$ Million) Analysis and Forecast By End-User Industry, 2023 to 2033

        6.3.1. Military

        6.3.2. Space Aeronautics

        6.3.3. Healthcare

        6.3.4. Mining

        6.3.5. Robotics

        6.3.6. Telecommunication

    6.4. Y-o-Y Growth Trend Analysis By End-User Industry, 2018 to 2022

    6.5. Absolute $ Opportunity Analysis By End-User Industry, 2023 to 2033

7. Global Market Analysis 2018 to 2022 and Forecast 2023 to 2033, By Region

    7.1. Introduction

    7.2. Historical Market Size Value (US$ Million) Analysis By Region, 2018 to 2022

    7.3. Current Market Size Value (US$ Million) Analysis and Forecast By Region, 2023 to 2033

        7.3.1. North America

        7.3.2. Latin America

        7.3.3. Western Europe

        7.3.4. Eastern Europe

        7.3.5. South Asia and Pacific

        7.3.6. East Asia

        7.3.7. Middle East and Africa

    7.4. Market Attractiveness Analysis By Region

8. North America Market Analysis 2018 to 2022 and Forecast 2023 to 2033, By Country

    8.1. Historical Market Size Value (US$ Million) Trend Analysis By Market Taxonomy, 2018 to 2022

    8.2. Market Size Value (US$ Million) Forecast By Market Taxonomy, 2023 to 2033

        8.2.1. By Country

            8.2.1.1. U.S.

            8.2.1.2. Canada

        8.2.2. By Algorithm Type

        8.2.3. By End-User Industry

    8.3. Market Attractiveness Analysis

        8.3.1. By Country

        8.3.2. By Algorithm Type

        8.3.3. By End-User Industry

    8.4. Key Takeaways

9. Latin America Market Analysis 2018 to 2022 and Forecast 2023 to 2033, By Country

    9.1. Historical Market Size Value (US$ Million) Trend Analysis By Market Taxonomy, 2018 to 2022

    9.2. Market Size Value (US$ Million) Forecast By Market Taxonomy, 2023 to 2033

        9.2.1. By Country

            9.2.1.1. Brazil

            9.2.1.2. Mexico

            9.2.1.3. Rest of Latin America

        9.2.2. By Algorithm Type

        9.2.3. By End-User Industry

    9.3. Market Attractiveness Analysis

        9.3.1. By Country

        9.3.2. By Algorithm Type

        9.3.3. By End-User Industry

    9.4. Key Takeaways

10. Western Europe Market Analysis 2018 to 2022 and Forecast 2023 to 2033, By Country

    10.1. Historical Market Size Value (US$ Million) Trend Analysis By Market Taxonomy, 2018 to 2022

    10.2. Market Size Value (US$ Million) Forecast By Market Taxonomy, 2023 to 2033

        10.2.1. By Country

            10.2.1.1. Germany

            10.2.1.2. U.K.

            10.2.1.3. France

            10.2.1.4. Spain

            10.2.1.5. Italy

            10.2.1.6. Rest of Western Europe

        10.2.2. By Algorithm Type

        10.2.3. By End-User Industry

    10.3. Market Attractiveness Analysis

        10.3.1. By Country

        10.3.2. By Algorithm Type

        10.3.3. By End-User Industry

    10.4. Key Takeaways

11. Eastern Europe Market Analysis 2018 to 2022 and Forecast 2023 to 2033, By Country

    11.1. Historical Market Size Value (US$ Million) Trend Analysis By Market Taxonomy, 2018 to 2022

    11.2. Market Size Value (US$ Million) Forecast By Market Taxonomy, 2023 to 2033

        11.2.1. By Country

            11.2.1.1. Poland

            11.2.1.2. Russia

            11.2.1.3. Czech Republic

            11.2.1.4. Romania

            11.2.1.5. Rest of Eastern Europe

        11.2.2. By Algorithm Type

        11.2.3. By End-User Industry

    11.3. Market Attractiveness Analysis

        11.3.1. By Country

        11.3.2. By Algorithm Type

        11.3.3. By End-User Industry

    11.4. Key Takeaways

12. South Asia and Pacific Market Analysis 2018 to 2022 and Forecast 2023 to 2033, By Country

    12.1. Historical Market Size Value (US$ Million) Trend Analysis By Market Taxonomy, 2018 to 2022

    12.2. Market Size Value (US$ Million) Forecast By Market Taxonomy, 2023 to 2033

        12.2.1. By Country

            12.2.1.1. India

            12.2.1.2. Bangladesh

            12.2.1.3. Australia

            12.2.1.4. New Zealand

            12.2.1.5. Rest of South Asia and Pacific

        12.2.2. By Algorithm Type

        12.2.3. By End-User Industry

    12.3. Market Attractiveness Analysis

        12.3.1. By Country

        12.3.2. By Algorithm Type

        12.3.3. By End-User Industry

    12.4. Key Takeaways

13. East Asia Market Analysis 2018 to 2022 and Forecast 2023 to 2033, By Country

    13.1. Historical Market Size Value (US$ Million) Trend Analysis By Market Taxonomy, 2018 to 2022

    13.2. Market Size Value (US$ Million) Forecast By Market Taxonomy, 2023 to 2033

        13.2.1. By Country

            13.2.1.1. China

            13.2.1.2. Japan

            13.2.1.3. South Korea

        13.2.2. By Algorithm Type

        13.2.3. By End-User Industry

    13.3. Market Attractiveness Analysis

        13.3.1. By Country

        13.3.2. By Algorithm Type

        13.3.3. By End-User Industry

    13.4. Key Takeaways

14. Middle East and Africa Market Analysis 2018 to 2022 and Forecast 2023 to 2033, By Country

    14.1. Historical Market Size Value (US$ Million) Trend Analysis By Market Taxonomy, 2018 to 2022

    14.2. Market Size Value (US$ Million) Forecast By Market Taxonomy, 2023 to 2033

        14.2.1. By Country

            14.2.1.1. GCC Countries

            14.2.1.2. South Africa

            14.2.1.3. Israel

            14.2.1.4. Rest of MEA

        14.2.2. By Algorithm Type

        14.2.3. By End-User Industry

    14.3. Market Attractiveness Analysis

        14.3.1. By Country

        14.3.2. By Algorithm Type

        14.3.3. By End-User Industry

    14.4. Key Takeaways

15. Key Countries Market Analysis

    15.1. U.S.

        15.1.1. Pricing Analysis

        15.1.2. Market Share Analysis, 2022

            15.1.2.1. By Algorithm Type

            15.1.2.2. By End-User Industry

    15.2. Canada

        15.2.1. Pricing Analysis

        15.2.2. Market Share Analysis, 2022

            15.2.2.1. By Algorithm Type

            15.2.2.2. By End-User Industry

    15.3. Brazil

        15.3.1. Pricing Analysis

        15.3.2. Market Share Analysis, 2022

            15.3.2.1. By Algorithm Type

            15.3.2.2. By End-User Industry

    15.4. Mexico

        15.4.1. Pricing Analysis

        15.4.2. Market Share Analysis, 2022

            15.4.2.1. By Algorithm Type

            15.4.2.2. By End-User Industry

    15.5. Germany

        15.5.1. Pricing Analysis

        15.5.2. Market Share Analysis, 2022

            15.5.2.1. By Algorithm Type

            15.5.2.2. By End-User Industry

    15.6. U.K.

        15.6.1. Pricing Analysis

        15.6.2. Market Share Analysis, 2022

            15.6.2.1. By Algorithm Type

            15.6.2.2. By End-User Industry

    15.7. France

        15.7.1. Pricing Analysis

        15.7.2. Market Share Analysis, 2022

            15.7.2.1. By Algorithm Type

            15.7.2.2. By End-User Industry

    15.8. Spain

        15.8.1. Pricing Analysis

        15.8.2. Market Share Analysis, 2022

            15.8.2.1. By Algorithm Type

            15.8.2.2. By End-User Industry

    15.9. Italy

        15.9.1. Pricing Analysis

        15.9.2. Market Share Analysis, 2022

            15.9.2.1. By Algorithm Type

            15.9.2.2. By End-User Industry

    15.10. Poland

        15.10.1. Pricing Analysis

        15.10.2. Market Share Analysis, 2022

            15.10.2.1. By Algorithm Type

            15.10.2.2. By End-User Industry

    15.11. Russia

        15.11.1. Pricing Analysis

        15.11.2. Market Share Analysis, 2022

            15.11.2.1. By Algorithm Type

            15.11.2.2. By End-User Industry

    15.12. Czech Republic

        15.12.1. Pricing Analysis

        15.12.2. Market Share Analysis, 2022

            15.12.2.1. By Algorithm Type

            15.12.2.2. By End-User Industry

    15.13. Romania

        15.13.1. Pricing Analysis

        15.13.2. Market Share Analysis, 2022

            15.13.2.1. By Algorithm Type

            15.13.2.2. By End-User Industry

    15.14. India

        15.14.1. Pricing Analysis

        15.14.2. Market Share Analysis, 2022

            15.14.2.1. By Algorithm Type

            15.14.2.2. By End-User Industry

    15.15. Bangladesh

        15.15.1. Pricing Analysis

        15.15.2. Market Share Analysis, 2022

            15.15.2.1. By Algorithm Type

            15.15.2.2. By End-User Industry

    15.16. Australia

        15.16.1. Pricing Analysis

        15.16.2. Market Share Analysis, 2022

            15.16.2.1. By Algorithm Type

            15.16.2.2. By End-User Industry

    15.17. New Zealand

        15.17.1. Pricing Analysis

        15.17.2. Market Share Analysis, 2022

            15.17.2.1. By Algorithm Type

            15.17.2.2. By End-User Industry

    15.18. China

        15.18.1. Pricing Analysis

        15.18.2. Market Share Analysis, 2022

            15.18.2.1. By Algorithm Type

            15.18.2.2. By End-User Industry

    15.19. Japan

        15.19.1. Pricing Analysis

        15.19.2. Market Share Analysis, 2022

            15.19.2.1. By Algorithm Type

            15.19.2.2. By End-User Industry

    15.20. South Korea

        15.20.1. Pricing Analysis

        15.20.2. Market Share Analysis, 2022

            15.20.2.1. By Algorithm Type

            15.20.2.2. By End-User Industry

    15.21. GCC Countries

        15.21.1. Pricing Analysis

        15.21.2. Market Share Analysis, 2022

            15.21.2.1. By Algorithm Type

            15.21.2.2. By End-User Industry

    15.22. South Africa

        15.22.1. Pricing Analysis

        15.22.2. Market Share Analysis, 2022

            15.22.2.1. By Algorithm Type

            15.22.2.2. By End-User Industry

    15.23. Israel

        15.23.1. Pricing Analysis

        15.23.2. Market Share Analysis, 2022

            15.23.2.1. By Algorithm Type

            15.23.2.2. By End-User Industry

16. Market Structure Analysis

    16.1. Competition Dashboard

    16.2. Competition Benchmarking

    16.3. Market Share Analysis of Top Players

        16.3.1. By Regional

        16.3.2. By Algorithm Type

        16.3.3. By End-User Industry

17. Competition Analysis

    17.1. Competition Deep Dive

        17.1.1. DoBot.cc

            17.1.1.1. Overview

            17.1.1.2. Product Portfolio

            17.1.1.3. Profitability by Market Segments

            17.1.1.4. Sales Footprint

            17.1.1.5. Strategy Overview

                17.1.1.5.1. Marketing Strategy

        17.1.2. UNANIMOUS AI

            17.1.2.1. Overview

            17.1.2.2. Product Portfolio

            17.1.2.3. Profitability by Market Segments

            17.1.2.4. Sales Footprint

            17.1.2.5. Strategy Overview

                17.1.2.5.1. Marketing Strategy

        17.1.3. ConvergentAI, Inc.

            17.1.3.1. Overview

            17.1.3.2. Product Portfolio

            17.1.3.3. Profitability by Market Segments

            17.1.3.4. Sales Footprint

            17.1.3.5. Strategy Overview

                17.1.3.5.1. Marketing Strategy

        17.1.4. SSI Schäfer Ltd.

            17.1.4.1. Overview

            17.1.4.2. Product Portfolio

            17.1.4.3. Profitability by Market Segments

            17.1.4.4. Sales Footprint

            17.1.4.5. Strategy Overview

                17.1.4.5.1. Marketing Strategy

        17.1.5. Valutico

            17.1.5.1. Overview

            17.1.5.2. Product Portfolio

            17.1.5.3. Profitability by Market Segments

            17.1.5.4. Sales Footprint

            17.1.5.5. Strategy Overview

                17.1.5.5.1. Marketing Strategy

        17.1.6. Sentien Robotics

            17.1.6.1. Overview

            17.1.6.2. Product Portfolio

            17.1.6.3. Profitability by Market Segments

            17.1.6.4. Sales Footprint

            17.1.6.5. Strategy Overview

                17.1.6.5.1. Marketing Strategy

        17.1.7. Unbox Robotics

            17.1.7.1. Overview

            17.1.7.2. Product Portfolio

            17.1.7.3. Profitability by Market Segments

            17.1.7.4. Sales Footprint

            17.1.7.5. Strategy Overview

                17.1.7.5.1. Marketing Strategy

        17.1.8. Aquarela advanced

            17.1.8.1. Overview

            17.1.8.2. Product Portfolio

            17.1.8.3. Profitability by Market Segments

            17.1.8.4. Sales Footprint

            17.1.8.5. Strategy Overview

                17.1.8.5.1. Marketing Strategy

        17.1.9. Axon AI

            17.1.9.1. Overview

            17.1.9.2. Product Portfolio

            17.1.9.3. Profitability by Market Segments

            17.1.9.4. Sales Footprint

            17.1.9.5. Strategy Overview

                17.1.9.5.1. Marketing Strategy

        17.1.10. Avidbots

            17.1.10.1. Overview

            17.1.10.2. Product Portfolio

            17.1.10.3. Profitability by Market Segments

            17.1.10.4. Sales Footprint

            17.1.10.5. Strategy Overview

                17.1.10.5.1. Marketing Strategy

18. Assumptions & Acronyms Used

19. Research Methodology

Don't pay for what you don't need

Customize your report by selecting specific countries or regions and save 30%!

List of Tables

Table 2: Global Market Value (US$ Million) Forecast by Algorithm Type, 2018 to 2033

Table 3: Global Market Value (US$ Million) Forecast by End-User Industry, 2018 to 2033

Table 4: North America Market Value (US$ Million) Forecast by Country, 2018 to 2033

Table 5: North America Market Value (US$ Million) Forecast by Algorithm Type, 2018 to 2033

Table 6: North America Market Value (US$ Million) Forecast by End-User Industry, 2018 to 2033

Table 7: Latin America Market Value (US$ Million) Forecast by Country, 2018 to 2033

Table 8: Latin America Market Value (US$ Million) Forecast by Algorithm Type, 2018 to 2033

Table 9: Latin America Market Value (US$ Million) Forecast by End-User Industry, 2018 to 2033

Table 10: Western Europe Market Value (US$ Million) Forecast by Country, 2018 to 2033

Table 11: Western Europe Market Value (US$ Million) Forecast by Algorithm Type, 2018 to 2033

Table 12: Western Europe Market Value (US$ Million) Forecast by End-User Industry, 2018 to 2033

Table 13: Eastern Europe Market Value (US$ Million) Forecast by Country, 2018 to 2033

Table 14: Eastern Europe Market Value (US$ Million) Forecast by Algorithm Type, 2018 to 2033

Table 15: Eastern Europe Market Value (US$ Million) Forecast by End-User Industry, 2018 to 2033

Table 16: South Asia and Pacific Market Value (US$ Million) Forecast by Country, 2018 to 2033

Table 17: South Asia and Pacific Market Value (US$ Million) Forecast by Algorithm Type, 2018 to 2033

Table 18: South Asia and Pacific Market Value (US$ Million) Forecast by End-User Industry, 2018 to 2033

Table 19: East Asia Market Value (US$ Million) Forecast by Country, 2018 to 2033

Table 20: East Asia Market Value (US$ Million) Forecast by Algorithm Type, 2018 to 2033

Table 21: East Asia Market Value (US$ Million) Forecast by End-User Industry, 2018 to 2033

Table 22: Middle East and Africa Market Value (US$ Million) Forecast by Country, 2018 to 2033

Table 23: Middle East and Africa Market Value (US$ Million) Forecast by Algorithm Type, 2018 to 2033

Table 24: Middle East and Africa Market Value (US$ Million) Forecast by End-User Industry, 2018 to 2033
Sudip Saha
Sudip Saha

Principal Consultant

Talk to Analyst

Find your sweet spots for generating winning opportunities in this market.

List of Charts

Figure 1: Global Market Value (US$ Million) by Algorithm Type, 2023 to 2033

Figure 2: Global Market Value (US$ Million) by End-User Industry, 2023 to 2033

Figure 3: Global Market Value (US$ Million) by Region, 2023 to 2033

Figure 4: Global Market Value (US$ Million) Analysis by Region, 2018 to 2033

Figure 5: Global Market Value Share (%) and BPS Analysis by Region, 2023 to 2033

Figure 6: Global Market Y-o-Y Growth (%) Projections by Region, 2023 to 2033

Figure 7: Global Market Value (US$ Million) Analysis by Algorithm Type, 2018 to 2033

Figure 8: Global Market Value Share (%) and BPS Analysis by Algorithm Type, 2023 to 2033

Figure 9: Global Market Y-o-Y Growth (%) Projections by Algorithm Type, 2023 to 2033

Figure 10: Global Market Value (US$ Million) Analysis by End-User Industry, 2018 to 2033

Figure 11: Global Market Value Share (%) and BPS Analysis by End-User Industry, 2023 to 2033

Figure 12: Global Market Y-o-Y Growth (%) Projections by End-User Industry, 2023 to 2033

Figure 13: Global Market Attractiveness by Algorithm Type, 2023 to 2033

Figure 14: Global Market Attractiveness by End-User Industry, 2023 to 2033

Figure 15: Global Market Attractiveness by Region, 2023 to 2033

Figure 16: North America Market Value (US$ Million) by Algorithm Type, 2023 to 2033

Figure 17: North America Market Value (US$ Million) by End-User Industry, 2023 to 2033

Figure 18: North America Market Value (US$ Million) by Country, 2023 to 2033

Figure 19: North America Market Value (US$ Million) Analysis by Country, 2018 to 2033

Figure 20: North America Market Value Share (%) and BPS Analysis by Country, 2023 to 2033

Figure 21: North America Market Y-o-Y Growth (%) Projections by Country, 2023 to 2033

Figure 22: North America Market Value (US$ Million) Analysis by Algorithm Type, 2018 to 2033

Figure 23: North America Market Value Share (%) and BPS Analysis by Algorithm Type, 2023 to 2033

Figure 24: North America Market Y-o-Y Growth (%) Projections by Algorithm Type, 2023 to 2033

Figure 25: North America Market Value (US$ Million) Analysis by End-User Industry, 2018 to 2033

Figure 26: North America Market Value Share (%) and BPS Analysis by End-User Industry, 2023 to 2033

Figure 27: North America Market Y-o-Y Growth (%) Projections by End-User Industry, 2023 to 2033

Figure 28: North America Market Attractiveness by Algorithm Type, 2023 to 2033

Figure 29: North America Market Attractiveness by End-User Industry, 2023 to 2033

Figure 30: North America Market Attractiveness by Country, 2023 to 2033

Figure 31: Latin America Market Value (US$ Million) by Algorithm Type, 2023 to 2033

Figure 32: Latin America Market Value (US$ Million) by End-User Industry, 2023 to 2033

Figure 33: Latin America Market Value (US$ Million) by Country, 2023 to 2033

Figure 34: Latin America Market Value (US$ Million) Analysis by Country, 2018 to 2033

Figure 35: Latin America Market Value Share (%) and BPS Analysis by Country, 2023 to 2033

Figure 36: Latin America Market Y-o-Y Growth (%) Projections by Country, 2023 to 2033

Figure 37: Latin America Market Value (US$ Million) Analysis by Algorithm Type, 2018 to 2033

Figure 38: Latin America Market Value Share (%) and BPS Analysis by Algorithm Type, 2023 to 2033

Figure 39: Latin America Market Y-o-Y Growth (%) Projections by Algorithm Type, 2023 to 2033

Figure 40: Latin America Market Value (US$ Million) Analysis by End-User Industry, 2018 to 2033

Figure 41: Latin America Market Value Share (%) and BPS Analysis by End-User Industry, 2023 to 2033

Figure 42: Latin America Market Y-o-Y Growth (%) Projections by End-User Industry, 2023 to 2033

Figure 43: Latin America Market Attractiveness by Algorithm Type, 2023 to 2033

Figure 44: Latin America Market Attractiveness by End-User Industry, 2023 to 2033

Figure 45: Latin America Market Attractiveness by Country, 2023 to 2033

Figure 46: Western Europe Market Value (US$ Million) by Algorithm Type, 2023 to 2033

Figure 47: Western Europe Market Value (US$ Million) by End-User Industry, 2023 to 2033

Figure 48: Western Europe Market Value (US$ Million) by Country, 2023 to 2033

Figure 49: Western Europe Market Value (US$ Million) Analysis by Country, 2018 to 2033

Figure 50: Western Europe Market Value Share (%) and BPS Analysis by Country, 2023 to 2033

Figure 51: Western Europe Market Y-o-Y Growth (%) Projections by Country, 2023 to 2033

Figure 52: Western Europe Market Value (US$ Million) Analysis by Algorithm Type, 2018 to 2033

Figure 53: Western Europe Market Value Share (%) and BPS Analysis by Algorithm Type, 2023 to 2033

Figure 54: Western Europe Market Y-o-Y Growth (%) Projections by Algorithm Type, 2023 to 2033

Figure 55: Western Europe Market Value (US$ Million) Analysis by End-User Industry, 2018 to 2033

Figure 56: Western Europe Market Value Share (%) and BPS Analysis by End-User Industry, 2023 to 2033

Figure 57: Western Europe Market Y-o-Y Growth (%) Projections by End-User Industry, 2023 to 2033

Figure 58: Western Europe Market Attractiveness by Algorithm Type, 2023 to 2033

Figure 59: Western Europe Market Attractiveness by End-User Industry, 2023 to 2033

Figure 60: Western Europe Market Attractiveness by Country, 2023 to 2033

Figure 61: Eastern Europe Market Value (US$ Million) by Algorithm Type, 2023 to 2033

Figure 62: Eastern Europe Market Value (US$ Million) by End-User Industry, 2023 to 2033

Figure 63: Eastern Europe Market Value (US$ Million) by Country, 2023 to 2033

Figure 64: Eastern Europe Market Value (US$ Million) Analysis by Country, 2018 to 2033

Figure 65: Eastern Europe Market Value Share (%) and BPS Analysis by Country, 2023 to 2033

Figure 66: Eastern Europe Market Y-o-Y Growth (%) Projections by Country, 2023 to 2033

Figure 67: Eastern Europe Market Value (US$ Million) Analysis by Algorithm Type, 2018 to 2033

Figure 68: Eastern Europe Market Value Share (%) and BPS Analysis by Algorithm Type, 2023 to 2033

Figure 69: Eastern Europe Market Y-o-Y Growth (%) Projections by Algorithm Type, 2023 to 2033

Figure 70: Eastern Europe Market Value (US$ Million) Analysis by End-User Industry, 2018 to 2033

Figure 71: Eastern Europe Market Value Share (%) and BPS Analysis by End-User Industry, 2023 to 2033

Figure 72: Eastern Europe Market Y-o-Y Growth (%) Projections by End-User Industry, 2023 to 2033

Figure 73: Eastern Europe Market Attractiveness by Algorithm Type, 2023 to 2033

Figure 74: Eastern Europe Market Attractiveness by End-User Industry, 2023 to 2033

Figure 75: Eastern Europe Market Attractiveness by Country, 2023 to 2033

Figure 76: South Asia and Pacific Market Value (US$ Million) by Algorithm Type, 2023 to 2033

Figure 77: South Asia and Pacific Market Value (US$ Million) by End-User Industry, 2023 to 2033

Figure 78: South Asia and Pacific Market Value (US$ Million) by Country, 2023 to 2033

Figure 79: South Asia and Pacific Market Value (US$ Million) Analysis by Country, 2018 to 2033

Figure 80: South Asia and Pacific Market Value Share (%) and BPS Analysis by Country, 2023 to 2033

Figure 81: South Asia and Pacific Market Y-o-Y Growth (%) Projections by Country, 2023 to 2033

Figure 82: South Asia and Pacific Market Value (US$ Million) Analysis by Algorithm Type, 2018 to 2033

Figure 83: South Asia and Pacific Market Value Share (%) and BPS Analysis by Algorithm Type, 2023 to 2033

Figure 84: South Asia and Pacific Market Y-o-Y Growth (%) Projections by Algorithm Type, 2023 to 2033

Figure 85: South Asia and Pacific Market Value (US$ Million) Analysis by End-User Industry, 2018 to 2033

Figure 86: South Asia and Pacific Market Value Share (%) and BPS Analysis by End-User Industry, 2023 to 2033

Figure 87: South Asia and Pacific Market Y-o-Y Growth (%) Projections by End-User Industry, 2023 to 2033

Figure 88: South Asia and Pacific Market Attractiveness by Algorithm Type, 2023 to 2033

Figure 89: South Asia and Pacific Market Attractiveness by End-User Industry, 2023 to 2033

Figure 90: South Asia and Pacific Market Attractiveness by Country, 2023 to 2033

Figure 91: East Asia Market Value (US$ Million) by Algorithm Type, 2023 to 2033

Figure 92: East Asia Market Value (US$ Million) by End-User Industry, 2023 to 2033

Figure 93: East Asia Market Value (US$ Million) by Country, 2023 to 2033

Figure 94: East Asia Market Value (US$ Million) Analysis by Country, 2018 to 2033

Figure 95: East Asia Market Value Share (%) and BPS Analysis by Country, 2023 to 2033

Figure 96: East Asia Market Y-o-Y Growth (%) Projections by Country, 2023 to 2033

Figure 97: East Asia Market Value (US$ Million) Analysis by Algorithm Type, 2018 to 2033

Figure 98: East Asia Market Value Share (%) and BPS Analysis by Algorithm Type, 2023 to 2033

Figure 99: East Asia Market Y-o-Y Growth (%) Projections by Algorithm Type, 2023 to 2033

Figure 100: East Asia Market Value (US$ Million) Analysis by End-User Industry, 2018 to 2033

Figure 101: East Asia Market Value Share (%) and BPS Analysis by End-User Industry, 2023 to 2033

Figure 102: East Asia Market Y-o-Y Growth (%) Projections by End-User Industry, 2023 to 2033

Figure 103: East Asia Market Attractiveness by Algorithm Type, 2023 to 2033

Figure 104: East Asia Market Attractiveness by End-User Industry, 2023 to 2033

Figure 105: East Asia Market Attractiveness by Country, 2023 to 2033

Figure 106: Middle East and Africa Market Value (US$ Million) by Algorithm Type, 2023 to 2033

Figure 107: Middle East and Africa Market Value (US$ Million) by End-User Industry, 2023 to 2033

Figure 108: Middle East and Africa Market Value (US$ Million) by Country, 2023 to 2033

Figure 109: Middle East and Africa Market Value (US$ Million) Analysis by Country, 2018 to 2033

Figure 110: Middle East and Africa Market Value Share (%) and BPS Analysis by Country, 2023 to 2033

Figure 111: Middle East and Africa Market Y-o-Y Growth (%) Projections by Country, 2023 to 2033

Figure 112: Middle East and Africa Market Value (US$ Million) Analysis by Algorithm Type, 2018 to 2033

Figure 113: Middle East and Africa Market Value Share (%) and BPS Analysis by Algorithm Type, 2023 to 2033

Figure 114: Middle East and Africa Market Y-o-Y Growth (%) Projections by Algorithm Type, 2023 to 2033

Figure 115: Middle East and Africa Market Value (US$ Million) Analysis by End-User Industry, 2018 to 2033

Figure 116: Middle East and Africa Market Value Share (%) and BPS Analysis by End-User Industry, 2023 to 2033

Figure 117: Middle East and Africa Market Y-o-Y Growth (%) Projections by End-User Industry, 2023 to 2033

Figure 118: Middle East and Africa Market Attractiveness by Algorithm Type, 2023 to 2033

Figure 119: Middle East and Africa Market Attractiveness by End-User Industry, 2023 to 2033

Figure 120: Middle East and Africa Market Attractiveness by Country, 2023 to 2033

Table 1: Global Market Value (US$ Million) Forecast by Region, 2018 to 2033

Recommendations

Technology

High-Performance Computing Market

Published : March 2023

Technology

Heterogeneous Mobile Processing and Computing Market

Published : November 2022

Explore Technology Insights

View Reports