Multi-Access Edge Computing Market Size and Share Forecast Outlook 2025 to 2035

The Multi-Access Edge Computing Market is estimated to be valued at USD 5.3 billion in 2025 and is projected to reach USD 124.6 billion by 2035, registering a compound annual growth rate (CAGR) of 37.2% over the forecast period. The cumulative growth trend forms an exponential curve rather than a linear accumulation path. From 2025 to 2029, the total value increased from USD 5.3 billion to USD 25.6 billion, contributing only 20.5% of the decade’s overall gain. However, the following five years generated 79.5% of the value, indicating an accelerating phase of adoption. This asymmetric curve shape implies that value creation has been backloaded, driven by demand from telco infrastructure upgrades and latency-sensitive industrial applications. The steep incline beyond 2030 reveals a shift from pilot-phase deployments to scaled implementations across sectors such as autonomous logistics, smart grids, and real-time analytics. The total value added in just the final three years (USD 58.4 billion) surpasses the entire cumulative market size from 2025 to 2030. This reflects stronger commercial integration of edge computing into hybrid-cloud ecosystems and industry 4.0 frameworks. With computing shifting closer to endpoints, the market has transitioned from exploratory spending to enterprise-scale infrastructure rollout, solidifying a steep, momentum-driven accumulation trajectory.
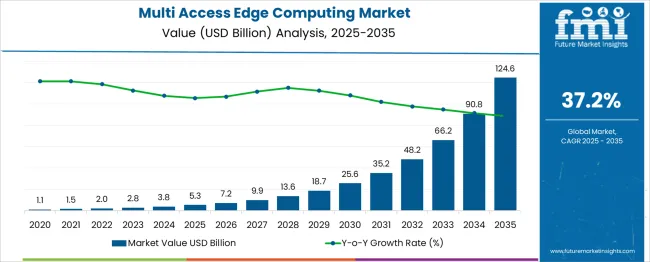
Quick Stats for Multi-Access Edge Computing Market

  • Multi-Access Edge Computing Market Value (2025): USD 5.3 billion
  • Multi-Access Edge Computing Market Forecast Value (2035): USD 124.6 billion
  • Multi-Access Edge Computing Market Forecast CAGR: 37.2%
  • Leading Segment in Multi-Access Edge Computing Market in 2025: Hardware (44.0%)
  • Key Growth Regions in Multi-Access Edge Computing Market: North America, Asia-Pacific, Europe
  • Top Key Players in Multi-Access Edge Computing Market: Amazon Web Services, Cisco, Dell, HPE, Huawei, Intel, Microsoft Azure, Nokia

Multi Access Edge Computing Market Market Value Analysis

Multi-Access Edge Computing Market Key Takeaways

Metric Value
Multi-Access Edge Computing Market Estimated Value in (2025 E) USD 5.3 billion
Multi-Access Edge Computing Market Forecast Value in (2035 F) USD 124.6 billion
Forecast CAGR (2025 to 2035) 37.2%

Why is the Multi-Access Edge Computing Market Growing?

The multi-access edge computing market is expanding rapidly as enterprises, telecom operators, and cloud providers seek to reduce latency, optimize bandwidth, and deliver real-time processing at the network edge. MEC enables localized data handling, facilitating critical applications in autonomous systems, AR/VR, and industrial automation.

The proliferation of IoT devices, combined with the demand for seamless user experiences in smart cities and Industry 4.0 environments, has strengthened the strategic need for edge computing. Investment in 5G infrastructure has further accelerated MEC deployments, supported by growing alliances between hyperscalers and telecom companies to jointly develop cloud-native edge solutions.

The market outlook remains strong as MEC transitions from proof-of-concept to production, with edge-native applications gaining commercial traction in retail, healthcare, and transportation. Future growth is expected to stem from API standardization, edge orchestration innovations, and AI-driven network optimization, enhancing scalability and cost-efficiency across distributed architectures.

Segmental Analysis

The multi-access edge computing market is segmented by component, deployment model, connectivity, application, end user, and geographic regions. The multi-access edge computing market is divided into Hardware and Software components. In terms of the deployment model, the multi-access edge computing market is classified into Cloud-based and On-premises. The multi-access edge computing market is segmented into 5G-enabled MEC and Wi-Fi-based MEC. The multi-access edge computing market is segmented into Real-time data processing, Network optimization, IoT and smart applications, Content delivery, and others. The end users of the multi-access edge computing market are segmented into Telecommunications, Retail, Manufacturing, Healthcare, Transportation & logistics, Government, and others. Regionally, the multi-access edge computing industry is classified into North America, Latin America, Western Europe, Eastern Europe, Balkan & Baltic Countries, Russia & Belarus, Central Asia, East Asia, South Asia & Pacific, and the Middle East & Africa.
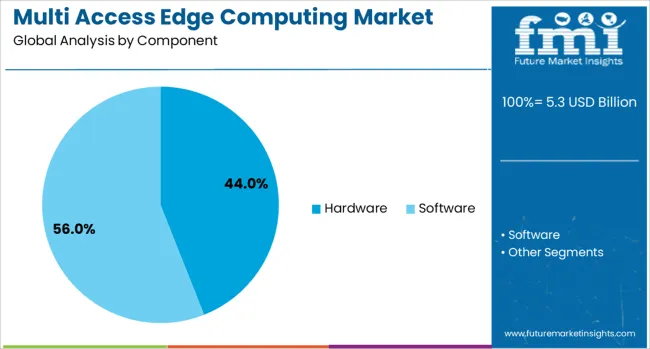
Insights into the Hardware Component Segment

Multi Access Edge Computing Market Analysis By Component

By component, hardware is expected to account for 44.00% of total market share in 2025, establishing it as the leading segment. This dominance is being shaped by the high capital expenditure required to deploy edge nodes, micro data centers, and on-premise edge servers.

Hardware forms the physical foundation for real-time data processing and is essential for supporting diverse MEC workloads with low latency and high availability. The rise in AI inference workloads and container-based applications at the edge is driving demand for purpose-built hardware with GPU and FPGA integration.

In sectors like manufacturing and energy, where environmental ruggedization and local compute capacity are critical, edge hardware adoption remains integral. As MEC continues to scale, hardware investments are being prioritized to meet growing demands for decentralized infrastructure performance, energy efficiency, and secure local processing.
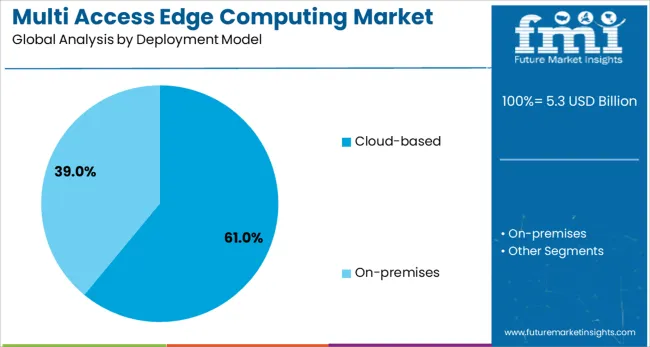
Insights into the Cloud-based Deployment Model Segment

Multi Access Edge Computing Market Analysis By Deployment Model

Cloud-based deployment models are projected to capture 61.00% of the market share in 2025, making this the most prominent segment. This lead is being driven by the increasing preference for elastic, software-defined edge solutions that can be managed centrally but executed locally.

Enterprises are leveraging cloud-native orchestration tools and containerized workloads to ensure operational agility and lower upfront costs. Cloud-based MEC allows for faster rollout, seamless updates, and integration with AI/ML services, offering scalability for dynamic edge applications.

Strategic collaborations between telecom operators and hyperscale cloud providers are enabling edge computing to be deployed closer to end-users through distributed cloud nodes. As use cases such as video analytics, telemedicine, and immersive media continue to scale, cloud-based models offer the flexibility and interoperability required to support evolving edge computing ecosystems.
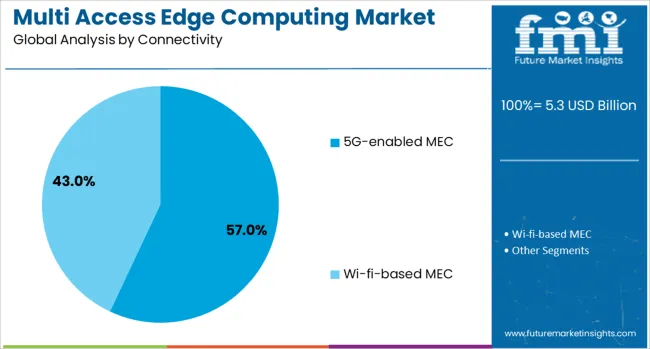
Insights into the 5G-enabled MEC Connectivity Segment

Multi Access Edge Computing Market Analysis By Connectivity

By connectivity, 5G-enabled MEC is anticipated to dominate the market with a 57.00% share in 2025. This dominance is being driven by 5G’s ultra-low latency and high-bandwidth capabilities, which are essential for unlocking the full potential of edge computing.

5G-enabled MEC supports real-time applications such as autonomous vehicles, remote surgery, and industrial robotics by facilitating data processing within milliseconds at the edge. The integration of MEC with 5G network slicing allows customized quality-of-service (QoS) for vertical-specific applications, creating new monetization opportunities for service providers.

Moreover, the ongoing global rollout of standalone 5G networks is accelerating MEC adoption, as operators deploy edge nodes in close proximity to base stations. The convergence of 5G and MEC is seen as a foundational pillar for next-gen digital infrastructure, enabling a future of connected intelligence across diverse sectors.

What are the Drivers, Restraints, and Key Trends of the Multi-Access Edge Computing Market?

Expansion in the multi-access edge computing market has been driven by demand for reduced latency across applications like factory automation, streaming, and smart infrastructure. Growing pressure on centralized cloud systems has shifted enterprise focus toward distributed computing at network edges. Telecom providers have deployed edge infrastructure alongside 5G rollout to enable localized data handling. Data privacy needs and time-sensitive applications continue to influence adoption. Enterprise workloads across transport, healthcare, and retail have been shifted to edge nodes to optimize responsiveness and performance.

Adoption Accelerated by Time-Critical Use Cases

Growth in demand for latency-sensitive applications has strengthened the case for MEC deployment across industries. Use cases such as automated guided vehicles, live video surveillance, and extended reality have depended on localized compute environments to reduce reliance on core networks. Telecom providers have enabled MEC integration within 5G networks to handle workload surges during peak usage. Enterprises processing real-time data streams from sensors, machines, or customer interfaces have benefited from decentralized compute. In logistics, smart warehousing and fleet coordination have been improved using edge-based data processing. Edge computing has delivered network resilience during outage-prone conditions in distributed operations.

Edge Deployment Supported by Telecom-Cloud Synergy

Deployment of MEC infrastructure has been supported through collaboration between telecom carriers and cloud solution providers. Edge servers have been integrated into base station sites to reduce data transfer times and enhance performance for real-time services. Virtualization and containerization of workloads have enabled efficient orchestration of resources at edge nodes. Retailers and financial institutions have tested micro-data centers for customer analytics and fraud detection. In industrial environments, edge platforms have supported predictive maintenance and machine coordination. Integration of MEC with SDN and NFV has allowed dynamic traffic handling, providing stable performance in bandwidth-variable environments.

Interoperability and Infrastructure Remain Constraints

Scalability of MEC deployments has been limited by the fragmented nature of existing telecom and IT infrastructure. Integration challenges have emerged as enterprises seek to combine edge capabilities with legacy systems. Hardware availability at suitable locations has created bottlenecks for continuous rollout. Lack of a unified standard for MEC architecture across vendors has made cross-platform compatibility difficult. Regulatory constraints related to localized data processing in healthcare and finance have slowed rollout in compliance-intensive sectors. Operational challenges have also emerged in managing multiple edge environments

Emerging Applications and Regional Deployment Momentum

Edge computing has been applied in urban mobility, immersive retail, and energy grid coordination. In North America, the market has evolved toward advanced retail analytics and autonomous transport applications. European deployments have centered around industrial IoT and automotive testbeds. Asia Pacific economies have adopted MEC to support real-time gaming, crowd management, and smart infrastructure services. Public sector investments in disaster response and surveillance have driven experimentation with edge deployments in emerging markets. MEC has been positioned to serve as a key component in future 6G and satellite-integrated networks, expanding its relevance in remote and mobile scenarios.
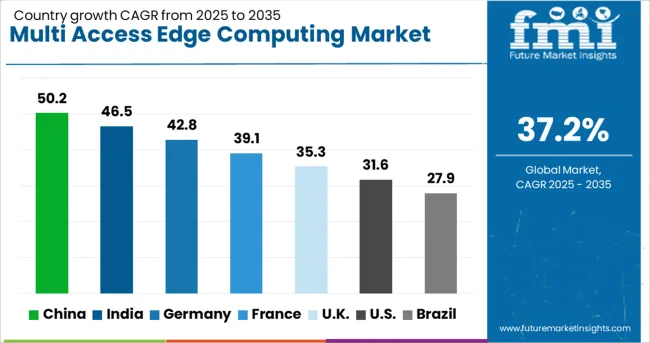
Analysis of Multi-Access Edge Computing Market By Key Countries

Multi Access Edge Computing Market Cagr Analysis By Country

Country CAGR
China 50.2%
India 46.5%
Germany 42.8%
France 39.1%
UK 35.3%
USA 31.6%
Brazil 27.9%

Global demand for Multi Access Edge Computing is projected to grow at a CAGR of 37.2% from 2025 to 2035. China leads at 50.2%, followed by India at 46.5% and Germany at 42.8%, reflecting premiums of +35%, +25%, and +15% above the global rate. The United Kingdom and United States remain below baseline at 35.3% and 31.6%, registering gaps of –5% and –15%. Rapid 5G infrastructure expansion, AI workload decentralisation, and real-time analytics in edge nodes are driving regional variances. ASEAN markets have focused on latency reduction for manufacturing and AR applications, while OECD nations have advanced private 5G for enterprise edge computing. Hardware virtualisation, containerised applications, and high-frequency data routing are being integrated into telecom and cloud service deployments across primary nodes.

Multi Access Edge Computing Expansion in China

China is projected to lead the global Multi Access Edge Computing market with a CAGR of 50.2%, surpassing the global rate by 35%. Government-backed 5G build-outs across Tier 1 and Tier 2 cities have accelerated distributed computing node installations. Real-time industrial automation in Shenzhen and Chengdu has shifted edge integration into factory floors. Telecom providers have partnered with hardware OEMs to scale GPU-enabled edge servers. Autonomous mobility tests have incorporated MEC-based V2X communication platforms for urban traffic control systems. Strategic investments in hybrid AI pipelines are advancing regional experimentation with edge-native inference tools.

  • 75% of major Chinese cities deployed GPU-based MEC nodes by Q2 2025
  • Edge-driven V2X was piloted across 11 autonomous mobility zones
  • Hybrid AI inference systems using edge servers expanded 58% YoY

5G-Backed MEC Infrastructure Growth in India

India is forecast to achieve a CAGR of 46.5% between 2025 and 2035 in the Multi Access Edge Computing space, placing it 25% above the global baseline. Key activity is concentrated in Bengaluru, Hyderabad, and Pune, where smart city initiatives have activated real-time sensor networks. Telecom firms have accelerated trials for standalone 5G integration with containerised MEC platforms. Enterprises in logistics and video surveillance are adopting decentralised analytics to reduce cloud backhaul costs. Edge-integrated CDN systems are now being tested across OTT service providers in southern states. Private-sector demand has shifted toward modular edge frameworks with onboard AI accelerators.
  • Standalone 5G MEC pilots increased 39% in industrial clusters by 2024
  • CDN edge deployments rose 46% among OTT platforms in Karnataka
  • AI-enabled edge frameworks reported 51% adoption in logistics hubs

Multi-Layered Edge Computing Implementation in Germany

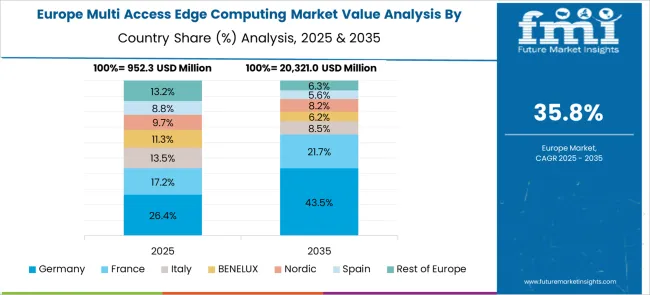
Multi Access Edge Computing Market Europe Country Market Share Analysis, 2025 & 2035

Germany is anticipated to record a CAGR of 42.8% for Multi Access Edge Computing through 2035, exceeding the global average by 15%. Industrial automation in Baden-Württemberg and Bavaria has supported integration of edge-enabled predictive maintenance in manufacturing. Telecom consortiums are deploying 5G MEC nodes with container orchestration layers tailored for low-latency use. Smart grid management and intelligent mobility pilots are incorporating digital twin frameworks running on edge hardware. Regulatory alignment with EU digital governance is enabling faster scale-up of edge security protocols across commercial networks.

  • Edge-based predictive analytics platforms grew 44% in factory environments
  • Digital twin deployments using MEC rose 36% in smart grid trials
  • 58% of new telecom edge nodes adopted multi-layer container systems

Private 5G and Edge Integration Outlook in United Kingdom

United Kingdom is projected to grow at a CAGR of 35.3% in the Multi Access Edge Computing sector, 5% below the global trend. Demand is anchored in logistics, public transit, and smart surveillance systems. Data centre expansions near London and Birmingham are enabling localised MEC hosting with reduced network hops. AI edge use cases are being trialled for crowd management, emergency response, and video stream optimisation. Telecom regulators have encouraged low-latency frameworks for private campus networks, supporting adaptive bandwidth control and real-time analytics. Regional edge partnerships are forming across telecom, AI startups, and academic institutions.
  • Campus-based MEC networks rose 31% across university-linked sites
  • Real-time video edge analytics pilots increased 29% in metro transit hubs
  • Edge hosting near London accounted for 62% of national data traffic load

MEC Adoption Curve Across Enterprise Networks in United States

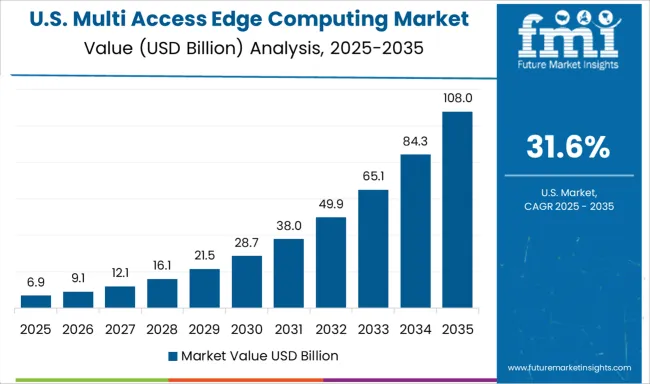
Multi Access Edge Computing Market Country Value Analysis

United States is expected to grow at a CAGR of 31.6% from 2025 to 2035 in the Multi Access Edge Computing market, trailing the global rate by 15%. Uptake is being driven by industrial IoT, autonomous vehicle testing, and defence-oriented applications. Adoption has been strongest in Texas and California, where edge platforms are embedded into supply chain and robotics environments. Network slicing and microservice deployment have been hindered by fragmented state-level infrastructure support. Edge computing pilots have expanded across retail and healthcare sectors, focusing on localised AI inference for real-time decision-making. Edge data orchestration remains uneven outside top-tier markets.
  • California and Texas represented 44% of MEC platform deployments in 2024
  • Healthcare-focused edge AI pilots rose 37% in regional hospital chains
  • Retail adoption of localised inference engines increased 32% YoY

Competitive Landscape of Multi-Access Edge Computing Market

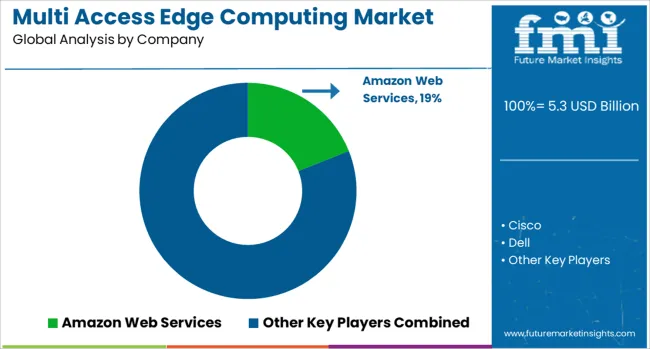
Multi Access Edge Computing Market Analysis By Company

The Multi-Access Edge Computing (MEC) market has seen intensified competition among global technology vendors focused on reducing latency and decentralizing data processing. Amazon Web Services and Microsoft Azure have led the shift toward edge-native cloud infrastructure, leveraging their extensive cloud ecosystems to integrate edge computing within existing enterprise workflows. Intel and HPE have concentrated on enabling hardware and microdata center platforms optimized for telecom edge deployments, supporting virtualized RAN (vRAN) and AI at the edge. Huawei and Nokia have maintained momentum in Asia and Europe by collaborating with telecom operators to deploy MEC nodes at 5G base stations, enhancing real-time applications in smart manufacturing and connected mobility.

Dell and Cisco have positioned themselves through modular edge infrastructure and software-defined networking that supports containerized edge workloads. Cross-industry use cases like augmented reality (AR), real-time analytics, and video surveillance have driven demand. Competition now centers around orchestration compatibility, edge AI capability, security compliance, and integration with Open RAN and 5G core infrastructure. Investment in zero-touch provisioning, AI workload acceleration, and network slicing for edge services is shaping vendor differentiation and long-term value creation within this market.

Key Developments in Multi-Access Edge Computing Market

Between 2023 and 2025, the Multi Access Edge Computing (MEC) market expanded with strong momentum across telecom, automotive, and industrial sectors. The rise of 5G networks enabled broader deployment of MEC nodes for real-time data processing in smart factories, autonomous vehicles, and immersive media. South Korea and Japan advanced commercial trials supporting low-latency enterprise systems, while Europe integrated MEC into digital manufacturing. In the US, mobile operators scaled up edge data centers to support AI workloads, content streaming, and mission-critical applications.

Scope of the Report

Item Value
Quantitative Units USD 5.3 Billion
Component Hardware and Software
Deployment Model Cloud-based and On-premises
Connectivity 5G-enabled MEC and Wi-fi-based MEC
Application Real-time data processing, Network optimization, IoT and smart applications, Content delivery, and Others
End User Telecommunications, Retail, Manufacturing, Healthcare, Transportation & logistics, Government, and Others
Regions Covered North America, Europe, Asia-Pacific, Latin America, Middle East & Africa
Country Covered United States, Canada, Germany, France, United Kingdom, China, Japan, India, Brazil, South Africa
Key Companies Profiled Amazon Web Services, Cisco, Dell, HPE, Huawei, Intel, Microsoft Azure, and Nokia
Additional Attributes Dollar sales by solution (hardware, software, services) and vertical (IT/telecom, automotive, healthcare), demand driven by 5G and IoT, North America leads with fast APAC growth, innovation in real time edge AI and orchestration platforms, environmental impact via reduced data center loads, and emerging use cases in autonomous vehicles, smart cities, and telemedicine applications.

Multi-Access Edge Computing Market by Segments

Component:

  • Hardware
  • Software

Deployment Model:

  • Cloud-based
  • On-premises

Connectivity:

  • 5G-enabled MEC
  • Wi-fi-based MEC

Application:

  • Real-time data processing
  • Network optimization
  • IoT and smart applications
  • Content delivery
  • Others

End User:

  • Telecommunications
  • Retail
  • Manufacturing
  • Healthcare
  • Transportation & logistics
  • Government
  • Others

Region:

  • North America
    • USA
    • Canada
    • Mexico
  • Latin America
    • Brazil
    • Chile
    • Rest of Latin America
  • Western Europe
    • Germany
    • UK
    • Italy
    • Spain
    • France
    • Nordic
    • BENELUX
    • Rest of Western Europe
  • Eastern Europe
    • Russia
    • Poland
    • Hungary
    • Balkan & Baltic
    • Rest of Eastern Europe
  • East Asia
    • China
    • Japan
    • South Korea
  • South Asia and Pacific
    • India
    • ASEAN
    • Australia & New Zealand
    • Rest of South Asia and Pacific
  • Middle East & Africa
    • Kingdom of Saudi Arabia
    • Other GCC Countries
    • Turkiye
    • South Africa
    • Other African Union
    • Rest of Middle East & Africa

Table of Content

  1. Executive Summary
    • Global Market Outlook
    • Demand-side Trends
    • Supply-side Trends
    • Technology Roadmap Analysis
    • Analysis and Recommendations
  2. Market Overview
    • Market Coverage / Taxonomy
    • Market Definition / Scope / Limitations
  3. Market Background
    • Market Dynamics
      • Drivers
      • Restraints
      • Opportunity
      • Trends
    • Scenario Forecast
      • Demand in Optimistic Scenario
      • Demand in Likely Scenario
      • Demand in Conservative Scenario
    • Opportunity Map Analysis
    • Product Life Cycle Analysis
    • Supply Chain Analysis
    • Investment Feasibility Matrix
    • Value Chain Analysis
    • PESTLE and Porter’s Analysis
    • Regulatory Landscape
    • Regional Parent Market Outlook
    • Production and Consumption Statistics
    • Import and Export Statistics
  4. Global Multi-Access Edge Computing Market Analysis 2020-2024 and Forecast, 2025-2035
    • Historical Market Size Value (USD Mn) Analysis, 2020-2024
    • Current and Future Market Size Value (USD Mn) Projections, 2025-2035
      • Y-o-Y Growth Trend Analysis
      • Absolute Dollar Opportunity Analysis
  5. Global Multi-Access Edge Computing Market Pricing Analysis 2020-2024 and Forecast 2025-2035
  6. Global Multi-Access Edge Computing Market Analysis 2020-2024 and Forecast 2025-2035, By Component
    • Introduction / Key Findings
    • Historical Market Size Value (USD Mn) Analysis By Component , 2020-2024
    • Current and Future Market Size Value (USD Mn) Analysis and Forecast By Component , 2025-2035
      • Hardware
        • Edge servers
        • Network equipment
        • IoT devices
      • Software
        • Edge orchestration software
        • Edge analytics software
        • Security software
        • Others
    • Y-o-Y Growth Trend Analysis By Component , 2020-2024
    • Absolute Dollar Opportunity Analysis By Component , 2025-2035
  7. Global Multi-Access Edge Computing Market Analysis 2020-2024 and Forecast 2025-2035, By Deployment Model
    • Introduction / Key Findings
    • Historical Market Size Value (USD Mn) Analysis By Deployment Model, 2020-2024
    • Current and Future Market Size Value (USD Mn) Analysis and Forecast By Deployment Model, 2025-2035
      • Cloud-based
      • On-premises
    • Y-o-Y Growth Trend Analysis By Deployment Model, 2020-2024
    • Absolute Dollar Opportunity Analysis By Deployment Model, 2025-2035
  8. Global Multi-Access Edge Computing Market Analysis 2020-2024 and Forecast 2025-2035, By Connectivity
    • Introduction / Key Findings
    • Historical Market Size Value (USD Mn) Analysis By Connectivity, 2020-2024
    • Current and Future Market Size Value (USD Mn) Analysis and Forecast By Connectivity, 2025-2035
      • 5G-enabled MEC
      • Wi-fi-based MEC
    • Y-o-Y Growth Trend Analysis By Connectivity, 2020-2024
    • Absolute Dollar Opportunity Analysis By Connectivity, 2025-2035
  9. Global Multi-Access Edge Computing Market Analysis 2020-2024 and Forecast 2025-2035, By Application
    • Introduction / Key Findings
    • Historical Market Size Value (USD Mn) Analysis By Application, 2020-2024
    • Current and Future Market Size Value (USD Mn) Analysis and Forecast By Application, 2025-2035
      • Real-time data processing
      • Network optimization
      • IoT and smart applications
      • Content delivery
      • Others
    • Y-o-Y Growth Trend Analysis By Application, 2020-2024
    • Absolute Dollar Opportunity Analysis By Application, 2025-2035
  10. Global Multi-Access Edge Computing Market Analysis 2020-2024 and Forecast 2025-2035, By End User
    • Introduction / Key Findings
    • Historical Market Size Value (USD Mn) Analysis By End User, 2020-2024
    • Current and Future Market Size Value (USD Mn) Analysis and Forecast By End User, 2025-2035
      • Telecommunications
      • Retail
      • Manufacturing
      • Healthcare
      • Transportation & logistics
      • Government
      • Others
    • Y-o-Y Growth Trend Analysis By End User, 2020-2024
    • Absolute Dollar Opportunity Analysis By End User, 2025-2035
  11. Global Multi-Access Edge Computing Market Analysis 2020-2024 and Forecast 2025-2035, By Region
    • Introduction
    • Historical Market Size Value (USD Mn) Analysis By Region, 2020-2024
    • Current Market Size Value (USD Mn) Analysis and Forecast By Region, 2025-2035
      • North America
      • Latin America
      • Western Europe
      • Eastern Europe
      • East Asia
      • South Asia and Pacific
      • Middle East & Africa
    • Market Attractiveness Analysis By Region
  12. North America Multi-Access Edge Computing Market Analysis 2020-2024 and Forecast 2025-2035, By Country
    • Historical Market Size Value (USD Mn) Trend Analysis By Market Taxonomy, 2020-2024
    • Market Size Value (USD Mn) Forecast By Market Taxonomy, 2025-2035
      • By Country
        • USA
        • Canada
        • Mexico
      • By Component
      • By Deployment Model
      • By Connectivity
      • By Application
      • By End User
    • Market Attractiveness Analysis
      • By Country
      • By Component
      • By Deployment Model
      • By Connectivity
      • By Application
      • By End User
    • Key Takeaways
  13. Latin America Multi-Access Edge Computing Market Analysis 2020-2024 and Forecast 2025-2035, By Country
    • Historical Market Size Value (USD Mn) Trend Analysis By Market Taxonomy, 2020-2024
    • Market Size Value (USD Mn) Forecast By Market Taxonomy, 2025-2035
      • By Country
        • Brazil
        • Chile
        • Rest of Latin America
      • By Component
      • By Deployment Model
      • By Connectivity
      • By Application
      • By End User
    • Market Attractiveness Analysis
      • By Country
      • By Component
      • By Deployment Model
      • By Connectivity
      • By Application
      • By End User
    • Key Takeaways
  14. Western Europe Multi-Access Edge Computing Market Analysis 2020-2024 and Forecast 2025-2035, By Country
    • Historical Market Size Value (USD Mn) Trend Analysis By Market Taxonomy, 2020-2024
    • Market Size Value (USD Mn) Forecast By Market Taxonomy, 2025-2035
      • By Country
        • Germany
        • UK
        • Italy
        • Spain
        • France
        • Nordic
        • BENELUX
        • Rest of Western Europe
      • By Component
      • By Deployment Model
      • By Connectivity
      • By Application
      • By End User
    • Market Attractiveness Analysis
      • By Country
      • By Component
      • By Deployment Model
      • By Connectivity
      • By Application
      • By End User
    • Key Takeaways
  15. Eastern Europe Multi-Access Edge Computing Market Analysis 2020-2024 and Forecast 2025-2035, By Country
    • Historical Market Size Value (USD Mn) Trend Analysis By Market Taxonomy, 2020-2024
    • Market Size Value (USD Mn) Forecast By Market Taxonomy, 2025-2035
      • By Country
        • Russia
        • Poland
        • Hungary
        • Balkan & Baltic
        • Rest of Eastern Europe
      • By Component
      • By Deployment Model
      • By Connectivity
      • By Application
      • By End User
    • Market Attractiveness Analysis
      • By Country
      • By Component
      • By Deployment Model
      • By Connectivity
      • By Application
      • By End User
    • Key Takeaways
  16. East Asia Multi-Access Edge Computing Market Analysis 2020-2024 and Forecast 2025-2035, By Country
    • Historical Market Size Value (USD Mn) Trend Analysis By Market Taxonomy, 2020-2024
    • Market Size Value (USD Mn) Forecast By Market Taxonomy, 2025-2035
      • By Country
        • China
        • Japan
        • South Korea
      • By Component
      • By Deployment Model
      • By Connectivity
      • By Application
      • By End User
    • Market Attractiveness Analysis
      • By Country
      • By Component
      • By Deployment Model
      • By Connectivity
      • By Application
      • By End User
    • Key Takeaways
  17. South Asia and Pacific Multi-Access Edge Computing Market Analysis 2020-2024 and Forecast 2025-2035, By Country
    • Historical Market Size Value (USD Mn) Trend Analysis By Market Taxonomy, 2020-2024
    • Market Size Value (USD Mn) Forecast By Market Taxonomy, 2025-2035
      • By Country
        • India
        • ASEAN
        • Australia & New Zealand
        • Rest of South Asia and Pacific
      • By Component
      • By Deployment Model
      • By Connectivity
      • By Application
      • By End User
    • Market Attractiveness Analysis
      • By Country
      • By Component
      • By Deployment Model
      • By Connectivity
      • By Application
      • By End User
    • Key Takeaways
  18. Middle East & Africa Multi-Access Edge Computing Market Analysis 2020-2024 and Forecast 2025-2035, By Country
    • Historical Market Size Value (USD Mn) Trend Analysis By Market Taxonomy, 2020-2024
    • Market Size Value (USD Mn) Forecast By Market Taxonomy, 2025-2035
      • By Country
        • Kingdom of Saudi Arabia
        • Other GCC Countries
        • Turkiye
        • South Africa
        • Other African Union
        • Rest of Middle East & Africa
      • By Component
      • By Deployment Model
      • By Connectivity
      • By Application
      • By End User
    • Market Attractiveness Analysis
      • By Country
      • By Component
      • By Deployment Model
      • By Connectivity
      • By Application
      • By End User
    • Key Takeaways
  19. Key Countries Multi-Access Edge Computing Market Analysis
    • USA
      • Pricing Analysis
      • Market Share Analysis, 2024
        • By Component
        • By Deployment Model
        • By Connectivity
        • By Application
        • By End User
    • Canada
      • Pricing Analysis
      • Market Share Analysis, 2024
        • By Component
        • By Deployment Model
        • By Connectivity
        • By Application
        • By End User
    • Mexico
      • Pricing Analysis
      • Market Share Analysis, 2024
        • By Component
        • By Deployment Model
        • By Connectivity
        • By Application
        • By End User
    • Brazil
      • Pricing Analysis
      • Market Share Analysis, 2024
        • By Component
        • By Deployment Model
        • By Connectivity
        • By Application
        • By End User
    • Chile
      • Pricing Analysis
      • Market Share Analysis, 2024
        • By Component
        • By Deployment Model
        • By Connectivity
        • By Application
        • By End User
    • Germany
      • Pricing Analysis
      • Market Share Analysis, 2024
        • By Component
        • By Deployment Model
        • By Connectivity
        • By Application
        • By End User
    • UK
      • Pricing Analysis
      • Market Share Analysis, 2024
        • By Component
        • By Deployment Model
        • By Connectivity
        • By Application
        • By End User
    • Italy
      • Pricing Analysis
      • Market Share Analysis, 2024
        • By Component
        • By Deployment Model
        • By Connectivity
        • By Application
        • By End User
    • Spain
      • Pricing Analysis
      • Market Share Analysis, 2024
        • By Component
        • By Deployment Model
        • By Connectivity
        • By Application
        • By End User
    • France
      • Pricing Analysis
      • Market Share Analysis, 2024
        • By Component
        • By Deployment Model
        • By Connectivity
        • By Application
        • By End User
    • India
      • Pricing Analysis
      • Market Share Analysis, 2024
        • By Component
        • By Deployment Model
        • By Connectivity
        • By Application
        • By End User
    • ASEAN
      • Pricing Analysis
      • Market Share Analysis, 2024
        • By Component
        • By Deployment Model
        • By Connectivity
        • By Application
        • By End User
    • Australia & New Zealand
      • Pricing Analysis
      • Market Share Analysis, 2024
        • By Component
        • By Deployment Model
        • By Connectivity
        • By Application
        • By End User
    • China
      • Pricing Analysis
      • Market Share Analysis, 2024
        • By Component
        • By Deployment Model
        • By Connectivity
        • By Application
        • By End User
    • Japan
      • Pricing Analysis
      • Market Share Analysis, 2024
        • By Component
        • By Deployment Model
        • By Connectivity
        • By Application
        • By End User
    • South Korea
      • Pricing Analysis
      • Market Share Analysis, 2024
        • By Component
        • By Deployment Model
        • By Connectivity
        • By Application
        • By End User
    • Russia
      • Pricing Analysis
      • Market Share Analysis, 2024
        • By Component
        • By Deployment Model
        • By Connectivity
        • By Application
        • By End User
    • Poland
      • Pricing Analysis
      • Market Share Analysis, 2024
        • By Component
        • By Deployment Model
        • By Connectivity
        • By Application
        • By End User
    • Hungary
      • Pricing Analysis
      • Market Share Analysis, 2024
        • By Component
        • By Deployment Model
        • By Connectivity
        • By Application
        • By End User
    • Kingdom of Saudi Arabia
      • Pricing Analysis
      • Market Share Analysis, 2024
        • By Component
        • By Deployment Model
        • By Connectivity
        • By Application
        • By End User
    • Turkiye
      • Pricing Analysis
      • Market Share Analysis, 2024
        • By Component
        • By Deployment Model
        • By Connectivity
        • By Application
        • By End User
    • South Africa
      • Pricing Analysis
      • Market Share Analysis, 2024
        • By Component
        • By Deployment Model
        • By Connectivity
        • By Application
        • By End User
  20. Market Structure Analysis
    • Competition Dashboard
    • Competition Benchmarking
    • Market Share Analysis of Top Players
      • By Regional
      • By Component
      • By Deployment Model
      • By Connectivity
      • By Application
      • By End User
  21. Competition Analysis
    • Competition Deep Dive
      • Amazon Web Services
        • Overview
        • Product Portfolio
        • Profitability by Market Segments (Product/Age /Sales Channel/Region)
        • Sales Footprint
        • Strategy Overview
          • Marketing Strategy
          • Product Strategy
          • Channel Strategy
      • Cisco
      • Dell
      • HPE
      • Huawei
      • Intel
      • Microsoft Azure
      • Nokia
  22. Assumptions & Acronyms Used
  23. Research Methodology

List of Tables

  • Table 1: Global Multi-Access Edge Computing Market Value (USD Mn) Forecast by Region, 2020-2035
  • Table 2: Global Multi-Access Edge Computing Market Value (USD Mn) Forecast by Component , 2020-2035
  • Table 3: Global Multi-Access Edge Computing Market Value (USD Mn) Forecast by Deployment Model, 2020-2035
  • Table 4: Global Multi-Access Edge Computing Market Value (USD Mn) Forecast by Connectivity, 2020-2035
  • Table 5: Global Multi-Access Edge Computing Market Value (USD Mn) Forecast by Application, 2020-2035
  • Table 6: Global Multi-Access Edge Computing Market Value (USD Mn) Forecast by End User, 2020-2035
  • Table 7: North America Multi-Access Edge Computing Market Value (USD Mn) Forecast by Country, 2020-2035
  • Table 8: North America Multi-Access Edge Computing Market Value (USD Mn) Forecast by Component , 2020-2035
  • Table 9: North America Multi-Access Edge Computing Market Value (USD Mn) Forecast by Deployment Model, 2020-2035
  • Table 10: North America Multi-Access Edge Computing Market Value (USD Mn) Forecast by Connectivity, 2020-2035
  • Table 11: North America Multi-Access Edge Computing Market Value (USD Mn) Forecast by Application, 2020-2035
  • Table 12: North America Multi-Access Edge Computing Market Value (USD Mn) Forecast by End User, 2020-2035
  • Table 13: Latin America Multi-Access Edge Computing Market Value (USD Mn) Forecast by Country, 2020-2035
  • Table 14: Latin America Multi-Access Edge Computing Market Value (USD Mn) Forecast by Component , 2020-2035
  • Table 15: Latin America Multi-Access Edge Computing Market Value (USD Mn) Forecast by Deployment Model, 2020-2035
  • Table 16: Latin America Multi-Access Edge Computing Market Value (USD Mn) Forecast by Connectivity, 2020-2035
  • Table 17: Latin America Multi-Access Edge Computing Market Value (USD Mn) Forecast by Application, 2020-2035
  • Table 18: Latin America Multi-Access Edge Computing Market Value (USD Mn) Forecast by End User, 2020-2035
  • Table 19: Western Europe Multi-Access Edge Computing Market Value (USD Mn) Forecast by Country, 2020-2035
  • Table 20: Western Europe Multi-Access Edge Computing Market Value (USD Mn) Forecast by Component , 2020-2035
  • Table 21: Western Europe Multi-Access Edge Computing Market Value (USD Mn) Forecast by Deployment Model, 2020-2035
  • Table 22: Western Europe Multi-Access Edge Computing Market Value (USD Mn) Forecast by Connectivity, 2020-2035
  • Table 23: Western Europe Multi-Access Edge Computing Market Value (USD Mn) Forecast by Application, 2020-2035
  • Table 24: Western Europe Multi-Access Edge Computing Market Value (USD Mn) Forecast by End User, 2020-2035
  • Table 25: Eastern Europe Multi-Access Edge Computing Market Value (USD Mn) Forecast by Country, 2020-2035
  • Table 26: Eastern Europe Multi-Access Edge Computing Market Value (USD Mn) Forecast by Component , 2020-2035
  • Table 27: Eastern Europe Multi-Access Edge Computing Market Value (USD Mn) Forecast by Deployment Model, 2020-2035
  • Table 28: Eastern Europe Multi-Access Edge Computing Market Value (USD Mn) Forecast by Connectivity, 2020-2035
  • Table 29: Eastern Europe Multi-Access Edge Computing Market Value (USD Mn) Forecast by Application, 2020-2035
  • Table 30: Eastern Europe Multi-Access Edge Computing Market Value (USD Mn) Forecast by End User, 2020-2035
  • Table 31: East Asia Multi-Access Edge Computing Market Value (USD Mn) Forecast by Country, 2020-2035
  • Table 32: East Asia Multi-Access Edge Computing Market Value (USD Mn) Forecast by Component , 2020-2035
  • Table 33: East Asia Multi-Access Edge Computing Market Value (USD Mn) Forecast by Deployment Model, 2020-2035
  • Table 34: East Asia Multi-Access Edge Computing Market Value (USD Mn) Forecast by Connectivity, 2020-2035
  • Table 35: East Asia Multi-Access Edge Computing Market Value (USD Mn) Forecast by Application, 2020-2035
  • Table 36: East Asia Multi-Access Edge Computing Market Value (USD Mn) Forecast by End User, 2020-2035
  • Table 37: South Asia and Pacific Multi-Access Edge Computing Market Value (USD Mn) Forecast by Country, 2020-2035
  • Table 38: South Asia and Pacific Multi-Access Edge Computing Market Value (USD Mn) Forecast by Component , 2020-2035
  • Table 39: South Asia and Pacific Multi-Access Edge Computing Market Value (USD Mn) Forecast by Deployment Model, 2020-2035
  • Table 40: South Asia and Pacific Multi-Access Edge Computing Market Value (USD Mn) Forecast by Connectivity, 2020-2035
  • Table 41: South Asia and Pacific Multi-Access Edge Computing Market Value (USD Mn) Forecast by Application, 2020-2035
  • Table 42: South Asia and Pacific Multi-Access Edge Computing Market Value (USD Mn) Forecast by End User, 2020-2035
  • Table 43: Middle East & Africa Multi-Access Edge Computing Market Value (USD Mn) Forecast by Country, 2020-2035
  • Table 44: Middle East & Africa Multi-Access Edge Computing Market Value (USD Mn) Forecast by Component , 2020-2035
  • Table 45: Middle East & Africa Multi-Access Edge Computing Market Value (USD Mn) Forecast by Deployment Model, 2020-2035
  • Table 46: Middle East & Africa Multi-Access Edge Computing Market Value (USD Mn) Forecast by Connectivity, 2020-2035
  • Table 47: Middle East & Africa Multi-Access Edge Computing Market Value (USD Mn) Forecast by Application, 2020-2035
  • Table 48: Middle East & Africa Multi-Access Edge Computing Market Value (USD Mn) Forecast by End User, 2020-2035

List of Figures

  • Figure 1: Global Multi-Access Edge Computing Market Pricing Analysis
  • Figure 2: Global Multi-Access Edge Computing Market Value (USD Mn) Forecast 2020–2035
  • Figure 3: Global Multi-Access Edge Computing Market Value (USD Mn) Share and BPS Analysis by Region, 2025 and 2035
  • Figure 4: Global Multi-Access Edge Computing Market Y-o-Y Growth Comparison by Region, 2025–2035
  • Figure 5: Global Multi-Access Edge Computing Market Attractiveness Analysis by Region
  • Figure 6: North America Multi-Access Edge Computing Market Incremental Dollar Opportunity, 2025–2035
  • Figure 7: Latin America Multi-Access Edge Computing Market Incremental Dollar Opportunity, 2025–2035
  • Figure 8: Western Europe Multi-Access Edge Computing Market Incremental Dollar Opportunity, 2025–2035
  • Figure 9: Eastern Europe Multi-Access Edge Computing Market Incremental Dollar Opportunity, 2025–2035
  • Figure 10: East Asia Multi-Access Edge Computing Market Incremental Dollar Opportunity, 2025–2035
  • Figure 11: South Asia and Pacific Multi-Access Edge Computing Market Incremental Dollar Opportunity, 2025–2035
  • Figure 12: Middle East & Africa Multi-Access Edge Computing Market Incremental Dollar Opportunity, 2025–2035
  • Figure 13: North America Multi-Access Edge Computing Market Value Share and BPS Analysis by Country, 2025 and 2035
  • Figure 14: Latin America Multi-Access Edge Computing Market Value Share and BPS Analysis by Country, 2025 and 2035
  • Figure 15: Western Europe Multi-Access Edge Computing Market Value Share and BPS Analysis by Country, 2025 and 2035
  • Figure 16: Eastern Europe Multi-Access Edge Computing Market Value Share and BPS Analysis by Country, 2025 and 2035
  • Figure 17: East Asia Multi-Access Edge Computing Market Value Share and BPS Analysis by Country, 2025 and 2035
  • Figure 18: South Asia and Pacific Multi-Access Edge Computing Market Value Share and BPS Analysis by Country, 2025 and 2035
  • Figure 19: Middle East & Africa Multi-Access Edge Computing Market Value Share and BPS Analysis by Country, 2025 and 2035
  • Figure 20: Global Multi-Access Edge Computing Market – Tier Structure Analysis
  • Figure 21: Global Multi-Access Edge Computing Market – Company Share Analysis

Frequently Asked Questions

How big is the multi-access edge computing market in 2025?

The global multi-access edge computing market is estimated to be valued at USD 5.3 billion in 2025.

What will be the size of multi-access edge computing market in 2035?

The market size for the multi-access edge computing market is projected to reach USD 124.6 billion by 2035.

How much will be the multi-access edge computing market growth between 2025 and 2035?

The multi-access edge computing market is expected to grow at a 37.2% CAGR between 2025 and 2035.

What are the key product types in the multi-access edge computing market?

The key product types in multi-access edge computing market are hardware, _edge servers, _network equipment, _iot devices, software, _edge orchestration software, _edge analytics software, _security software and _others.

Which deployment model segment to contribute significant share in the multi-access edge computing market in 2025?

In terms of deployment model, cloud-based segment to command 61.0% share in the multi-access edge computing market in 2025.

Explore Similar Insights

Future Market Insights

Multi-Access Edge Computing Market