Fixed Asset Management Software Market
Market Insights on Fixed Asset Management Software covering sales outlook, demand forecast & up-to-date key trends
Fixed Asset Management Software Market By Component, Deployment Type, Organization Size, Verticals & Region - Forecast 2022 - 2032
Fixed Asset Management Software Market Outlook (2022-2032)
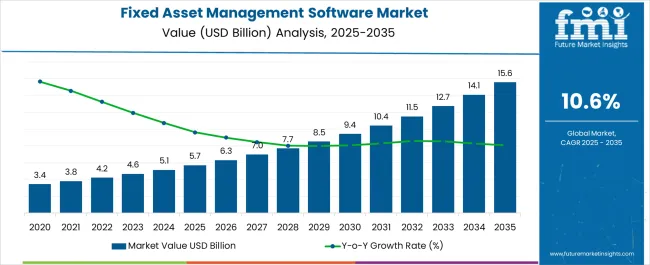
[300 Pages Report] According to estimates, the worldwide fixed asset management software market will be worth US$ 3.8 Billion in 2021 and US$ 4.2 Billion in 2022. Fixed asset management software sales are expected to reach US$ 11.4 Billion in 2032, with a 10.6% CAGR from 2022 to 2032, supported by:
- With the advent of Industry 4.0 in the manufacturing sector, various factories have used digital technologies to improve, enhance, and smoothen the manufacturing process while optimising fixed asset management. The programme predicts production expenses, assisting producers in developing a cost-effective budget.
- Cloud computing, artificial intelligence, machine learning, and other technical advancements are expected to enhance the use of fixed asset management software since these technologies provide scalability, agility, and efficiency to businesses. As a result, solution providers are proposing technologically sophisticated solutions to maximise profits.
- The introduction of big data and analytics will increase the usage of fixed asset management software and generate chances for expansion throughout the projection period. Furthermore, increased initiatives by companies are expected to expand market prospects.
The coronavirus pandemic has had a substantial impact on businesses. The key driver driving the market is the growing demand to improve organisational efficiency by using innovative technology to fulfil corporate objectives.
To assist employees in keeping their data secure during the COVID-19 pandemic, data storage suppliers have provided free data storage solutions such as basic data protection software. Few of these free data-storage software applications are intended for short-term usage, while others are meant to have a long-term influence on businesses.
Data Points |
Key Statistics |
Expected Market Value in 2022 |
US$ 4.2 Billion |
Projected Market Value in 2032 |
US$ 11.4 Billion |
Growth Rate (2022-2032) |
10.6% CAGR |
Let us know your requirement to get
100% FREE customization
Development Of Fixed Asset Management Software Market In The North America
According to the report, North America is expected to lead the market over the forecast period. The region's growth may be ascribed to the region's strong presence in the industrial and transportation sectors, as well as the region's rising embrace of technology innovations.
Among all, the United States is expected to have the largest market share throughout the projection period. During the projection period, the country is predicted to earn US$ 4 billion while growing at a 10.4% CAGR. Government actions and regulations in a variety of end-user sectors are expected to significantly enhance the market.
For example, the Federal Highway Administration (FHWA), the American Association of State Highway and Transportation Officials (AASHTO), and state and local transportation departments (DOTs) have all made efforts to encourage the use of asset management software in the transportation and logistics sectors.
Furthermore, the country has a strong position in terms of technology adoption in every end-use industry, including automotive, manufacturing, IT & telecom, and others. This is likely to provide different chances for the United States to expand its worldwide market reach.
Opportunities abound in the Manufacturing Segment
Fixed asset management software enables firms in the manufacturing industry to optimise maintenance operations, prolong asset longevity, and boost production. The industrial industry is in desperate need of centralised software to handle its vast array of assets. The data acquired by asset performance software aids in predicting the exact breakdown point of a vital asset, enhancing uptime.
Fixed asset management software also aids industrial enterprises in the administration of maintenance, spare parts, and inventories. It helps manufacturers to maximise asset control, performance, and warranty return by properly managing inspections and audits. Furthermore, fixed asset management software assists industrial companies in improving their plant and machinery maintenance operations.
“Increasing adoption of IoT-based services across several industries like Oil & Gas, Manufacturing, Energy, Power, and Construction is projected to play a salient role in driving the market in the assessment period.”
Find your sweet spots for generating winning opportunities in this market.
Talk to AnalystWhat Are The Most Significant Contributors To The Fixed Asset Management Software Market?
Emergence of Industry 4.0 in the Manufacturing Sector to Fuel the Market in the Forecast Period
With the emergence of industry 4.0 in the manufacturing sector, several plants have adopted digital technologies to improve, enhance, and smoothen the manufacturing process while optimizing the management of fixed assets. The software allows the manufacturers to predict the manufacturing costs, thereby, aiding them to prepare a cost-efficient budget.
Besides, technologies like Industrial IoT offers various benefits such as real-time alters and asset tracking solutions, which assist in managing their fixed assets efficiently.
In addition, technological development across various sectors such as cloud computing, artificial intelligence, machine learning, and others are projected to boost the adoption of fixed asset management software since these technologies offer scalability, agility, and efficiency to the business. Therefore, solution providers are introducing technologically developed solutions to procure maximum gains.
For instance, in September 2019, Adapt IT announced a partnership with i-Chain, a South Africa-based fixed asset management services, and solutions company to offer a Web-based system providing easy access to a cloud-based environment, particularly designed for educational institutions to assist them to manage their assets.
What Are The Limits To The Fixed Asset Management Software Market?
Lack of awareness of fixed asset management software is expected to hinder the market in the forecast period. Also, the reluctance of SMEs to adopt fixed asset management software is due to financial restrictions.
SMEs generally have lower capital expenditure, which does not allow them to procure expensive software. Moreover, the growing cost associated with the maintenance of the on-premises infrastructure is another factor impeding the market during the forecast period.

A unified Market Research Subscription Platform, built for today's disparate research needs.
What Are The Emerging Opportunities In The Fixed Asset Management Software Market?
The advent of big data and analytics will grow the adoption of fixed asset management software and is expected to create opportunities for expansion in the forecast period. Also, rising initiatives by players are projected to augment the opportunities in the market.
For instance, Comparesoft, an AI-Driven Software Recommender, announced the renewal of its partnership with FMIS, which offers asset management solutions in a broad range of industries, comprising health, manufacturing, public sector, education, and non-profile sectors. This is expected to offer various opportunities for expansion by helping them engage with businesses.
Comparative View Of Adjacent Fixed Asset Management Software Market
Fixed Asset Management Software Market:
Attributes |
Fixed Asset Management Software Market |
CAGR (2022-2032) |
10.6% |
Market Value (2032) |
USD 11.4 Bn |
Growth Factor |
Increasing adoption of advanced asset management practices to strengthen the organization to manage their assets efficiently. |
Opportunity |
The emergence of big data and analytics will enhance the demand for fixed asset management software and offer significant opportunities of growth. |
Software Asset Management Market:
Attributes |
Software Asset Management Market |
CAGR (2022-2032) |
18.8% |
Market Value (2032) |
USD 13.2 Bn |
Growth Factor |
Growing need to manage and optimize the purchase, maintenance and disposal of software applications within the business is expected to boost the market. |
Opportunity |
Rising inclination of organizations toward cloud-based deployment to overcome on-premises challenges present remunerative opportunities for expansion in the forecast period. |
IT Asset Management Market:
Attributes |
IT Asset Management Market |
CAGR (2022-2032) |
11% |
Market Value (2032) |
USD 3.83 Bn |
Growth Factor |
Rising implementation of technologically advanced and interconnected infrastructure has encouraged organizations across several sectors to adopt asset management systems, propelling the market in the forecast period. |
Opportunity |
Emergence of IoT and M2M is anticipated to offer various opportunities for market growth in the assessment period. |
Automation along with increased adoption of IoT-based assets across sectors such as oil & gas, manufacturing, healthcare, transportation & logistics, and construction, and others are projected to make a notable contribution to driving the industry.
Besides, the surging implementation of analytics to manage fixed assets, increasing mobility solutions and rising integration of asset management solutions are other salient factors boosting the market growth in the forecast period. Also, the rising partnerships among players are likely to result in the expansion of the industry.
For instance, in November 2019, SIG in partnership with GE Digital disclosed its first Asset Performance Management and Field Service Management solution for the food and beverage sector. The Plant 360 Asset Management is likely to give on-demand digital services, which will provide efficiency to manufacturers, and connectivity in their operations.
What Is The Segmentation Analysis For The Global Fixed Asset Management Software Market?
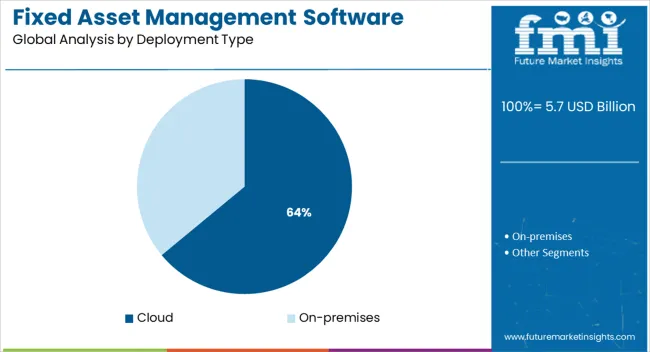
Based on deployment type, the global fixed asset management software market can be segmented into cloud and on-premises. According to the analysis, the on-premises segment is anticipated to secure a larger market share while exhibiting a 10.2% CAGR in the forecast period.
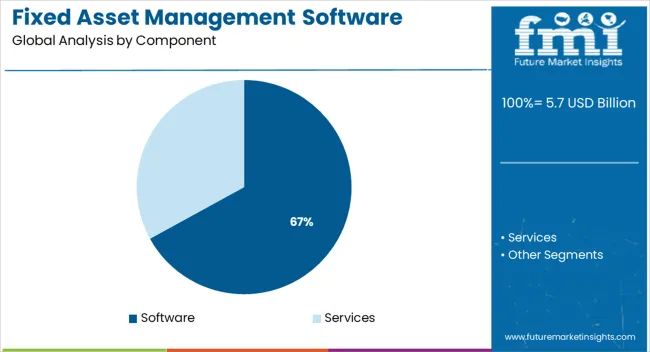
Based on components, the global fixed asset management software market can be segmented into services and software.
Based on organization size, the global fixed asset management software market can be segmented into SMEs and large enterprises.
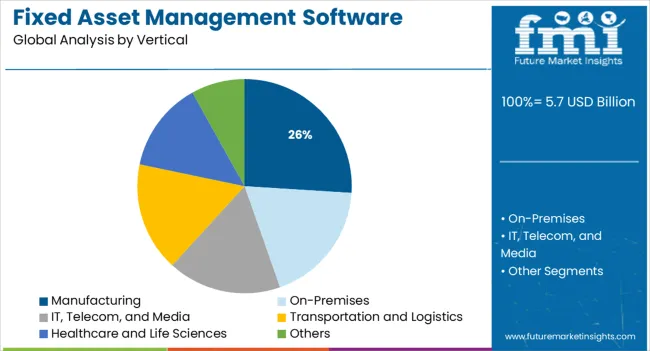
Based on vertical, the global fixed asset management software market can be segmented into IT, telecom and media, energy and utilities, manufacturing, transportation & logistics, healthcare and life sciences, and others. According to the analysis, the manufacturing segment is anticipated to garner maximum traction during the forecast period. The segment is likely to expand at a CAGR of 10.4%.
What Is The Contribution Of Segments In Boosting The Market?
The on-premises segment is anticipated to dominate the market with a growth rate of 10.2% during the forecast period. An on-premises deployment type is a conventional approach to implementing solutions at the premises of an organization.
Currently, the approach is being followed in organizations where security is the vital pillar of business operations since it is considered a safer option against the cloud-deployment type. Aerospace & defense, healthcare, and the BFSI sector are projected to be significant consumers of on-premises fixed asset management software deployment since they deal with sensitive data such as finance, national security, and healthcare.
On the other hand, the manufacturing segment is anticipated to garner maximum traction in the forecast period. The manufacturing sector is projected to be a lucrative segment and has a massive demand for centralized software to manage its assets. The fixed asset management software aids manufacturing organizations to improve their plant and machinery maintenance processes.
What Is The Regional Analysis Of The Global Fixed Asset Management Software Market?
As per the analysis, North America is anticipated to lead the market in the forecast period. The development of the region can be attributed to the robust presence of manufacturing and transportation sectors and the increasing adoption of technological advancements in the region.
Among all, the U.S is anticipated to secure the maximum market share during the forecast period. The country is expected to garner USD 4 Bn while exhibiting a 10.4% CAGR in the forecast period.
Government initiatives and regulations in several end-user sectors are projected to provide a significant boost to the market. For instance, the Federal Highway Association (FHWA), the American Association of State Highway and Transportation Officials (AASHTO), State and local departments of transportation (DOTs) have taken various efforts to motivate the usage of asset management software in the transportation and logistics sector.
In addition, the country also possesses a dominant position with respect to technology adoption in every end-use sector such as automotive, manufacturing, IT & telecom, and others. This is expected to offer various opportunities to the U.S to augment its reach in the global market competition.
Europe is projected to be another lucrative market in the assessment period. The U.K is expected to garner USD 478 Mn, witnessing a 9.6% CAGR in the forecast period. Increasing demand to lessen operational costs and the penetration of IoT technology are some of the vital factors augmenting the industry in the forecast period.
As per the analysis, APAC is the fastest-growing market during the forecast period. Among all, China, Japan, and South Korea are projected to be the most lucrative market in the region. China is anticipated to garner USD 794.4 Mn, recording a CAGR of 9.9% during the forecast period.
The contribution of China can be attributed to the high number of SMEs which are expected to boost the demand for cloud-based fixed asset management software since they are cost-effective. Also, organizations in the country are leveraging fixed asset management software to manage their assets efficiently.
In addition, Japan and South Korea are estimated at USD 940 Mn and 397 Mn respectively. The growth rate of Japan and South Korea is estimated at 8.9% and 8.1% sequentially.
Country |
Estimated CAGR |
U.S |
10.4% |
U.K |
9.6% |
China |
9.9% |
Japan |
8.9% |
South Korea |
8.1% |
What Is The Competition Status In The Global Fixed Asset Management Software Market?
Key players in the global fixed asset management software market include IBM, Infor, SAP, Microsoft, and Oracle, among others.
Recent key developments among players are:
- In April 2019, Infor inked an agreement with First Bus. Infor complied to increase asset management for First Bus. First Bus is a transport operator in North America and the U.K.
- In March 2021, Sage, a cloud-business solutions provider acquired Task Sheriff. Task Sheriff is an artificial-based SaaS. The acquisition is aimed at developing its AI technology and Task Sheriff founders would join Sage AI Labs, which is a global team of engineers, data scientists, and product managers, located in Melbourne, Barcelona, San Francisco, and Tel Aviv.
Key Segments Covered In The Fixed Asset Management Software Report
By Component:
- Fixed Asset Management Software
- Fixed Asset Management Services
By Deployment Type:
- Cloud Fixed Asset Management
- On-Premises Fixed Asset Management
By Organization Size:
- Fixed Asset Management for Large Enterprises
- Fixed Asset Management for SMEs
By Vertical:
- Fixed Asset Management for Energy and Utilities
- Fixed Asset Management for Manufacturing
- Fixed Asset Management for IT, Telecom, and Media
- Fixed Asset Management for Transportation and Logistics
- Fixed Asset Management for Healthcare and Life Sciences
- Fixed Asset Management for Other Verticals
By Region:
- North America
- Europe
- Asia Pacific
- Middle East & Africa
- Latin America
Frequently Asked Questions
What is the market size of the global fixed asset management software market in 2021?
The global fixed asset management software market is estimated at USD 3.8 Bn.
What is the expected value of the global fixed asset management software market during the forecast period?
The global fixed asset management software market is projected to secure USD 11.4 Mn while recording a CAGR of 10.6% during the forecast period.
What is the emerging trend in the global fixed asset management software market?
The emergence of big data and analytics will offer significant opportunities for market expansion in the forecast period.
Which factor is anticipated to drive the global fixed asset management software market?
Emergence of industry 4.0 in the manufacturing sector to propel the market significantly in the forecast period.
What is the expected market value in the U.S?
The U.S market is projected at USD 4 bn, exhibiting a CAGR of 10.4% during the forecast period.
What is the contribution of China to developing the market?
China is projected at 794 Mn, recording a 9.9% growth rate during the forecast period.
Table of Content
1. Executive Summary 1.1. Global Market Outlook 1.2. Summary of Statistics 1.3. Key Market Characteristics & Attributes 1.4. Fact.MR Analysis and Recommendations 2. Market Overview 2.1. Market Coverage 2.2. Market Definition 3. Market Risks and Trends Assessment 3.1. Risk Assessment 3.1.1. COVID-19 Crisis and Impact on Fixed Asset Management Software 3.1.2. COVID-19 Impact Benchmark with Previous Crisis 3.1.3. Impact on Market Value (US$ Mn) 3.1.4. Assessment by Key Countries 3.1.5. Assessment by Key Market Segments 3.1.6. Action Points and Recommendation for Suppliers 3.2. Key Trends Impacting the Market 3.3. Formulation and Product Development Trends 4. Market Background 4.1. Fixed Asset Management Software Market, by Key Countries 4.2. Fixed Asset Management Software Market Opportunity Assessment (US$ Mn) 4.2.1. Total Available Market 4.2.2. Serviceable Addressable Market 4.2.3. Serviceable Obtainable Market 4.3. Market Scenario Forecast 4.3.1. Demand in optimistic Scenario 4.3.2. Demand in Likely Scenario 4.3.3. Demand in Conservative Scenario 4.4. Investment Feasibility Analysis 4.4.1. Investment in Established Markets 4.4.1.1. In Short Term 4.4.1.2. In Long Term 4.4.2. Investment in Emerging Markets 4.4.2.1. In Short Term 4.4.2.2. In Long Term 4.5. Forecast Factors - Relevance & Impact 4.5.1. Top Companies Historical Growth 4.5.2. Growth in Automation, By Country 4.5.3. Fixed Asset Management Software Adoption Rate, By Country 4.6. Market Dynamics 4.6.1. Market Driving Factors and Impact Assessment 4.6.2. Prominent Market Challenges and Impact Assessment 4.6.3. Fixed Asset Management Software Market Opportunities 4.6.4. Prominent Trends in the Global Market & Their Impact Assessment 5. Key Success Factors 5.1. Manufacturers’ Focus on Low Penetration High Growth Markets 5.2. Banking on with Segments High Incremental Opportunity 5.3. Peer Benchmarking 6. Global Fixed Asset Management Software Market Demand Analysis 2015-2021 and Forecast, 2022-2032 6.1. Historical Market Analysis, 2015-2021 6.2. Current and Future Market Projections, 2022-2032 6.3. Y-o-Y Growth Trend Analysis 7. Global Fixed Asset Management Software Market Value Analysis 2015-2021 and Forecast, 2022-2032 7.1. Historical Market Value (US$ Mn) Analysis, 2015-2021 7.2. Current and Future Market Value (US$ Mn) Projections, 2022-2032 7.2.1. Y-o-Y Growth Trend Analysis 7.2.2. Absolute $ Opportunity Analysis 8. Global Fixed Asset Management Software Market Analysis 2015-2021 and Forecast 2022-2032, By Component 8.1. Introduction / Key Findings 8.2. Historical Market Size (US$ Mn) Analysis By Component , 2015-2021 8.3. Current and Future Market Size (US$ Mn) Analysis and Forecast By Component , 2022-2032 8.3.1. Software 8.3.2. Services 8.3.2.1. Consulting and Implementation 8.3.2.2. Training and Support 8.4. Market Attractiveness Analysis By Component 9. Global Fixed Asset Management Software Market Analysis 2015-2021 and Forecast 2022-2032, By Vertical 9.1. Introduction / Key Findings 9.2. Historical Market Size (US$ Mn) Analysis By Vertical, 2015-2021 9.3. Current and Future Market Size (US$ Mn) Analysis and Forecast By Vertical, 2022-2032 9.3.1. On-Premises 9.3.2. Manufacturing 9.3.3. IT, Telecom, and Media 9.3.4. Transportation and Logistics 9.3.5. Healthcare and Life Sciences 9.3.6. Others 9.4. Market Attractiveness Analysis By Vertical 10. Global Fixed Asset Management Software Market Analysis 2015-2021 and Forecast 2022-2032, By Deployment Type 10.1. Introduction / Key Findings 10.2. Historical Market Size (US$ Mn) Analysis By Deployment Type , 2015-2021 10.3. Current and Future Market Size (US$ Mn) Analysis and Forecast By Deployment Type , 2022-2032 10.3.1. On-premises 10.3.2. Cloud 10.4. Market Attractiveness Analysis By Deployment Type 11. Global Fixed Asset Management Software Market Analysis 2015-2021 and Forecast 2022-2032, By Organization Size 11.1. Introduction / Key Findings 11.2. Historical Market Size (US$ Mn) Analysis By Organization Size , 2015-2021 11.3. Current and Future Market Size (US$ Mn) Analysis and Forecast By Organization Size , 2022-2032 11.3.1. Large Enterprises 11.3.2. Small and Medium-Sized Enterprises 11.4. Market Attractiveness Analysis By Organization Size 12. Global Fixed Asset Management Software Market Analysis 2015-2021 and Forecast 2022-2032, By Region 12.1. Introduction 12.2. Historical Market Size (US$ Mn) Analysis By Region, 2015-2021 12.3. Current Market Size (US$ Mn) & Analysis and Forecast By Region, 2022-2032 12.3.1. North America 12.3.2. Latin America 12.3.3. Europe 12.3.4. Asia Pacific 12.3.5. Middle East and Africa (MEA) 12.4. Market Attractiveness Analysis By Region 13. North America Fixed Asset Management Software Market Analysis 2015-2021 and Forecast 2022-2032 13.1. Introduction 13.2. Pricing Analysis 13.3. Historical Market Value (US$ Mn) Trend Analysis By Market Taxonomy, 2015-2021 13.4. Market Value (US$ Mn) & Forecast By Market Taxonomy, 2022-2032 13.4.1. By Country 13.4.1.1. U.S. 13.4.1.2. Canada 13.4.1.3. Rest of North America 13.4.2. By Component 13.4.3. By Vertical 13.4.4. By Organization Size 13.4.5. By Deployment Type 13.5. Market Attractiveness Analysis 13.5.1. By Country 13.5.2. By Component 13.5.3. By Vertical 13.5.4. By Organization Size 13.5.5. By Deployment Type 14. Latin America Fixed Asset Management Software Market Analysis 2015-2021 and Forecast 2022-2032 14.1. Introduction 14.2. Pricing Analysis 14.3. Historical Market Value (US$ Mn) Trend Analysis By Market Taxonomy, 2015-2021 14.4. Market Value (US$ Mn) & Forecast By Market Taxonomy, 2022-2032 14.4.1. By Country 14.4.1.1. Brazil 14.4.1.2. Mexico 14.4.1.3. Rest of Latin America 14.4.2. By Component 14.4.3. By Vertical 14.4.4. By Organization Size 14.4.5. By Deployment Type 14.5. Market Attractiveness Analysis 14.5.1. By Country 14.5.2. By Component 14.5.3. By Vertical 14.5.4. By Organization Size 14.5.5. By Deployment Type 15. Europe Fixed Asset Management Software Market Analysis 2015-2021 and Forecast 2022-2032 15.1. Introduction 15.2. Pricing Analysis 15.3. Historical Market Value (US$ Mn) Trend Analysis By Market Taxonomy, 2015-2021 15.4. Market Value (US$ Mn) & Forecast By Market Taxonomy, 2022-2032 15.4.1. By Country 15.4.1.1. Germany 15.4.1.2. France 15.4.1.3. U.K. 15.4.1.4. Italy 15.4.1.5. Benelux 15.4.1.6. Nordic Countries 15.4.1.7. Rest of Europe 15.4.2. By Component 15.4.3. By Vertical 15.4.4. By Organization Size 15.4.5. By Deployment Type 15.5. Market Attractiveness Analysis 15.5.1. By Country 15.5.2. By Component 15.5.3. By Vertical 15.5.4. By Organization Size 15.5.5. By Deployment Type 16. Asia Pacific Fixed Asset Management Software Market Analysis 2015-2021 and Forecast 2022-2032 16.1. Introduction 16.2. Pricing Analysis 16.3. Historical Market Value (US$ Mn) Trend Analysis By Market Taxonomy, 2015-2021 16.4. Market Value (US$ Mn) & Forecast By Market Taxonomy, 2022-2032 16.4.1. By Country 16.4.1.1. China 16.4.1.2. Japan 16.4.1.3. South Korea 16.4.1.4. Rest of Asia Pacific 16.4.2. By Component 16.4.3. By Vertical 16.4.4. By Organization Size 16.4.5. By Deployment Type 16.5. Market Attractiveness Analysis 16.5.1. By Country 16.5.2. By Component 16.5.3. By Vertical 16.5.4. By Organization Size 16.5.5. By Deployment Type 17. Middle East and Africa Fixed Asset Management Software Market Analysis 2015-2021 and Forecast 2022-2032 17.1. Introduction 17.2. Pricing Analysis 17.3. Historical Market Value (US$ Mn) Trend Analysis By Market Taxonomy, 2015-2021 17.4. Market Value (US$ Mn) & Forecast By Market Taxonomy, 2022-2032 17.4.1. By Country 17.4.1.1. GCC Countries 17.4.1.2. South Africa 17.4.1.3. Turkey 17.4.1.4. Rest of Middle East and Africa 17.4.2. By Component 17.4.3. By Vertical 17.4.4. By Organization Size 17.4.5. By Deployment Type 17.5. Market Attractiveness Analysis 17.5.1. By Country 17.5.2. By Component 17.5.3. By Vertical 17.5.4. By Organization Size 17.5.5. By Deployment Type 18. Key Countries Fixed Asset Management Software Market Analysis 2015-2021 and Forecast 2022-2032 18.1. Introduction 18.1.1. Market Value Proportion Analysis, By Key Countries 18.1.2. Global Vs. Country Growth Comparison 18.2. US Fixed Asset Management Software Market Analysis 18.2.1. Value Proportion Analysis by Market Taxonomy 18.2.2. Value Analysis and Forecast by Market Taxonomy, 2015-2032 18.2.2.1. By Component 18.2.2.2. By Vertical 18.2.2.3. By Organization Size 18.2.2.4. By Deployment Type 18.3. Canada Fixed Asset Management Software Market Analysis 18.3.1. Value Proportion Analysis by Market Taxonomy 18.3.2. Value Analysis and Forecast by Market Taxonomy, 2015-2032 18.3.2.1. By Component 18.3.2.2. By Vertical 18.3.2.3. By Organization Size 18.3.2.4. By Deployment Type 18.4. Mexico Fixed Asset Management Software Market Analysis 18.4.1. Value Proportion Analysis by Market Taxonomy 18.4.2. Value Analysis and Forecast by Market Taxonomy, 2015-2032 18.4.2.1. By Component 18.4.2.2. By Vertical 18.4.2.3. By Organization Size 18.4.2.4. By Deployment Type 18.5. Brazil Fixed Asset Management Software Market Analysis 18.5.1. Value Proportion Analysis by Market Taxonomy 18.5.2. Value Analysis and Forecast by Market Taxonomy, 2015-2032 18.5.2.1. By Component 18.5.2.2. By Vertical 18.5.2.3. By Organization Size 18.5.2.4. By Deployment Type 18.6. Germany Fixed Asset Management Software Market Analysis 18.6.1. Value Proportion Analysis by Market Taxonomy 18.6.2. Value Analysis and Forecast by Market Taxonomy, 2015-2032 18.6.2.1. By Component 18.6.2.2. By Vertical 18.6.2.3. By Organization Size 18.6.2.4. By Deployment Type 18.7. France Fixed Asset Management Software Market Analysis 18.7.1. Value Proportion Analysis by Market Taxonomy 18.7.2. Value Analysis and Forecast by Market Taxonomy, 2015-2032 18.7.2.1. By Component 18.7.2.2. By Vertical 18.7.2.3. By Organization Size 18.7.2.4. By Deployment Type 18.8. Italy Fixed Asset Management Software Market Analysis 18.8.1. Value Proportion Analysis by Market Taxonomy 18.8.2. Value Analysis and Forecast by Market Taxonomy, 2015-2032 18.8.2.1. By Component 18.8.2.2. By Vertical 18.8.2.3. By Organization Size 18.8.2.4. By Deployment Type 18.9. BENELUX Fixed Asset Management Software Market Analysis 18.9.1. Value Proportion Analysis by Market Taxonomy 18.9.2. Value Analysis and Forecast by Market Taxonomy, 2015-2032 18.9.2.1. By Component 18.9.2.2. By Vertical 18.9.2.3. By Organization Size 18.9.2.4. By Deployment Type 18.10. UK Fixed Asset Management Software Market Analysis 18.10.1. Value Proportion Analysis by Market Taxonomy 18.10.2. Value Analysis and Forecast by Market Taxonomy, 2015-2032 18.10.2.1. By Component 18.10.2.2. By Vertical 18.10.2.3. By Organization Size 18.10.2.4. By Deployment Type 18.11. Nordic Countries Fixed Asset Management Software Market Analysis 18.11.1. Value Proportion Analysis by Market Taxonomy 18.11.2. Value Analysis and Forecast by Market Taxonomy, 2015-2032 18.11.2.1. By Component 18.11.2.2. By Vertical 18.11.2.3. By Organization Size 18.11.2.4. By Deployment Type 18.12. China Fixed Asset Management Software Market Analysis 18.12.1. Value Proportion Analysis by Market Taxonomy 18.12.2. Value Analysis and Forecast by Market Taxonomy, 2015-2032 18.12.2.1. By Component 18.12.2.2. By Vertical 18.12.2.3. By Organization Size 18.12.2.4. By Deployment Type 18.13. Japan Fixed Asset Management Software Market Analysis 18.13.1. Value Proportion Analysis by Market Taxonomy 18.13.2. Value Analysis and Forecast by Market Taxonomy, 2015-2032 18.13.2.1. By Component 18.13.2.2. By Vertical 18.13.2.3. By Organization Size 18.13.2.4. By Deployment Type 18.14. South Korea Fixed Asset Management Software Market Analysis 18.14.1. Value Proportion Analysis by Market Taxonomy 18.14.2. Value Analysis and Forecast by Market Taxonomy, 2015-2032 18.14.2.1. By Component 18.14.2.2. By Vertical 18.14.2.3. By Organization Size 18.14.2.4. By Deployment Type 18.15. GCC Countries Fixed Asset Management Software Market Analysis 18.15.1. Value Proportion Analysis by Market Taxonomy 18.15.2. Value Analysis and Forecast by Market Taxonomy, 2015-2032 18.15.2.1. By Component 18.15.2.2. By Vertical 18.15.2.3. By Organization Size 18.15.2.4. By Deployment Type 18.16. South Africa Fixed Asset Management Software Market Analysis 18.16.1. Value Proportion Analysis by Market Taxonomy 18.16.2. Value Analysis and Forecast by Market Taxonomy, 2015-2032 18.16.2.1. By Component 18.16.2.2. By Vertical 18.16.2.3. By Organization Size 18.16.2.4. By Deployment Type 18.17. Turkey Fixed Asset Management Software Market Analysis 18.17.1. Value Proportion Analysis by Market Taxonomy 18.17.2. Value Analysis and Forecast by Market Taxonomy, 2015-2032 18.17.2.1. By Component 18.17.2.2. By Vertical 18.17.2.3. By Organization Size 18.17.2.4. By Deployment Type 18.17.3. Competition Landscape and Player Concentration in the Country 19. Market Structure Analysis 19.1. Market Analysis by Tier of Companies 19.2. Market Concentration 19.3. Market Share Analysis of Top Players 19.4. Market Presence Analysis 19.4.1. By Regional footprint of Players 19.4.2. Product footprint by Players 20. Competition Analysis 20.1. Competition Dashboard 20.2. Competition Benchmarking 20.3. Competition Deep Dive 20.3.1. IBM 20.3.1.1. Overview 20.3.1.2. Product Portfolio 20.3.1.3. Sales Footprint 20.3.1.4. Strategy Overview 20.3.2. Infor 20.3.2.1. Overview 20.3.2.2. Product Portfolio 20.3.2.3. Sales Footprint 20.3.2.4. Strategy Overview 20.3.3. SAP 20.3.3.1. Overview 20.3.3.2. Product Portfolio 20.3.3.3. Sales Footprint 20.3.3.4. Strategy Overview 20.3.4. Microsoft 20.3.4.1. Overview 20.3.4.2. Product Portfolio 20.3.4.3. Sales Footprint 20.3.4.4. Strategy Overview 20.3.5. Oracle 20.3.5.1. Overview 20.3.5.2. Product Portfolio 20.3.5.3. Sales Footprint 20.3.5.4. Strategy Overview 20.3.6. Sage 20.3.6.1. Overview 20.3.6.2. Product Portfolio 20.3.6.3. Sales Footprint 20.3.6.4. Strategy Overview 20.3.7. Aptean 20.3.7.1. Overview 20.3.7.2. Product Portfolio 20.3.7.3. Sales Footprint 20.3.7.4. Strategy Overview 20.3.8. Acumatica 20.3.8.1. Overview 20.3.8.2. Product Portfolio 20.3.8.3. Sales Footprint 20.3.8.4. Strategy Overview 20.3.9. Emaint 20.3.9.1. Overview 20.3.9.2. Product Portfolio 20.3.9.3. Sales Footprint 20.3.9.4. Strategy Overview 20.3.10. Aveva 20.3.10.1. Overview 20.3.10.2. Product Portfolio 20.3.10.3. Sales Footprint 20.3.10.4. Strategy Overview 21. Assumptions and Acronyms Used 22. Research Methodology
Let us know your requirement to get
100% FREE customization
List of Tables
Table 1: Global Fixed Asset Management Software Market Value (US$ Mn),By Component , 2015 – 2021 Table 2: Global Fixed Asset Management Software Market Value (US$ Mn),By Component , 2022 – 2032 Table 3: Global Fixed Asset Management Software Market Value (US$ Mn), By Vertical, 2015 – 2021 Table 4: Global Fixed Asset Management Software Market Value (US$ Mn), By Vertical, 2022 – 2032 Table 5: Global Fixed Asset Management Software Market Value (US$ Mn), By Deployment Type , 2015 – 2021 Table 6: Global Fixed Asset Management Software Market Value (US$ Mn), By Deployment Type , 2022 – 2032 Table 7: Global Fixed Asset Management Software Market Value (US$ Mn), By Organization Size , 2015 – 2021 Table 8: Global Fixed Asset Management Software Market Value (US$ Mn), By Organization Size , 2022 – 2032 Table 9: Global Fixed Asset Management Software Market, By Region, 2015 – 2021 Table 10: Global Fixed Asset Management Software Market, By Region, 2022 – 2032 Table 11: North America Fixed Asset Management Software Market Value (US$ Mn),By Component , 2015 – 2021 Table 12: North America Fixed Asset Management Software Market Value (US$ Mn),By Component , 2022 – 2032 Table 13: North America Fixed Asset Management Software Market Value (US$ Mn), By Vertical, 2015 – 2021 Table 14: North America Fixed Asset Management Software Market Value (US$ Mn), By Vertical, 2022 – 2032 Table 15: North America Fixed Asset Management Software Market Value (US$ Mn), By Deployment Type , 2015 – 2021 Table 16: North America Fixed Asset Management Software Market Value (US$ Mn), By Deployment Type , 2022 – 2032 Table 17: North America Fixed Asset Management Software Market Value (US$ Mn), By Organization Size , 2015 – 2021 Table 18: North America Fixed Asset Management Software Market Value (US$ Mn), By Organization Size , 2022 – 2032 Table 19: North America Fixed Asset Management Software Market, By Country, 2015 – 2021 Table 20: North America Fixed Asset Management Software Market, By Country, 2022 – 2032 Table 21: Latin America Fixed Asset Management Software Market Value (US$ Mn),By Component , 2015 – 2021 Table 22: Latin America Fixed Asset Management Software Market Value (US$ Mn),By Component , 2022 – 2032 Table 23: Latin America Fixed Asset Management Software Market Value (US$ Mn), By Vertical, 2015 – 2021 Table 24: Latin America Fixed Asset Management Software Market Value (US$ Mn), By Vertical, 2022 – 2032 Table 25: Latin America Fixed Asset Management Software Market Value (US$ Mn), By Deployment Type , 2015 – 2021 Table 26: Latin America Fixed Asset Management Software Market Value (US$ Mn), By Deployment Type , 2022 – 2032 Table 27: Latin America Fixed Asset Management Software Market Value (US$ Mn), By Organization Size , 2015 – 2021 Table 28: Latin America Fixed Asset Management Software Market Value (US$ Mn), By Organization Size , 2022 – 2032 Table 29: Latin America Fixed Asset Management Software Market, By Country, 2015 – 2021 Table 30: Latin America Fixed Asset Management Software Market, By Country, 2022 – 2032 Table 31: Europe Fixed Asset Management Software Market Value (US$ Mn),By Component , 2015 – 2021 Table 32: Europe Fixed Asset Management Software Market Value (US$ Mn),By Component , 2022 – 2032 Table 33: Europe Fixed Asset Management Software Market Value (US$ Mn), By Vertical, 2015 – 2021 Table 34: Europe Fixed Asset Management Software Market Value (US$ Mn), By Vertical, 2022 – 2032 Table 35: Europe Fixed Asset Management Software Market Value (US$ Mn), By Deployment Type , 2015 – 2021 Table 36: Europe Fixed Asset Management Software Market Value (US$ Mn), By Deployment Type , 2022 – 2032 Table 37: Europe Fixed Asset Management Software Market Value (US$ Mn), By Organization Size , 2015 – 2021 Table 38: Europe Fixed Asset Management Software Market Value (US$ Mn), By Organization Size , 2022 – 2032 Table 39: Europe Fixed Asset Management Software Market, By Country, 2015 – 2021 Table 40: Europe Fixed Asset Management Software Market, By Country, 2022 – 2032 Table 41: Asia Pacific Fixed Asset Management Software Market Value (US$ Mn),By Component , 2015 – 2021 Table 42: Asia Pacific Fixed Asset Management Software Market Value (US$ Mn),By Component , 2022 – 2032 Table 43: Asia Pacific Fixed Asset Management Software Market Value (US$ Mn), By Vertical, 2015 – 2021 Table 44: Asia Pacific Fixed Asset Management Software Market Value (US$ Mn), By Vertical, 2022 – 2032 Table 45: Asia Pacific Fixed Asset Management Software Market Value (US$ Mn), By Deployment Type , 2015 – 2021 Table 46: Asia Pacific Fixed Asset Management Software Market Value (US$ Mn), By Deployment Type , 2022 – 2032 Table 47: Asia Pacific Fixed Asset Management Software Market Value (US$ Mn), By Organization Size , 2015 – 2021 Table 48: Asia Pacific Fixed Asset Management Software Market Value (US$ Mn), By Organization Size , 2022 – 2032 Table 49: Asia Pacific Fixed Asset Management Software Market, By Country, 2015 – 2021 Table 50: Asia Pacific Fixed Asset Management Software Market, By Country, 2022 – 2032 Table 51: MEA Fixed Asset Management Software Market Value (US$ Mn),By Component , 2015 – 2021 Table 52: MEA Fixed Asset Management Software Market Value (US$ Mn),By Component , 2022 – 2032 Table 53: MEA Fixed Asset Management Software Market Value (US$ Mn), By Vertical, 2015 – 2021 Table 54: MEA Fixed Asset Management Software Market Value (US$ Mn), By Vertical, 2022 – 2032 Table 55: MEA Fixed Asset Management Software Market Value (US$ Mn), By Deployment Type , 2015 – 2021 Table 56: MEA Fixed Asset Management Software Market Value (US$ Mn), By Deployment Type , 2022 – 2032 Table 57: MEA Fixed Asset Management Software Market Value (US$ Mn), By Organization Size , 2015 – 2021 Table 58: MEA Fixed Asset Management Software Market Value (US$ Mn), By Organization Size , 2022 – 2032 Table 59: MEA Fixed Asset Management Software Market, By Country, 2015 – 2021 Table 60: MEA Fixed Asset Management Software Market, By Country, 2022 – 2032
Find your sweet spots for generating winning opportunities in this market.
Talk to AnalystList of Charts
Figure 1: Global Fixed Asset Management Software Market Value (US$ Mn) and Year-on-Year Growth, 2015-2032 Figure 2: Global Fixed Asset Management Software Market Absolute $ Historical Gain (2015 - 2021) and Opportunity (2022 – 2032), US$ Mn Figure 3: Global Fixed Asset Management Software Market Share, By Component , 2022 & 2032 Figure 4: Global Fixed Asset Management Software Market Y-o-Y Growth Projections, By Component – 2022-2032 Figure 5: Global Fixed Asset Management Software Market Attractiveness Index, By Component – 2022-2032 Figure 6: Global Fixed Asset Management Software Market Share, By Vertical, 2022 & 2032 Figure 7: Global Fixed Asset Management Software Market Y-o-Y Growth Projections, By Vertical – 2022-2032 Figure 8: Global Fixed Asset Management Software Market Attractiveness Index, By Vertical – 2022-2032 Figure 9: Global Fixed Asset Management Software Market Share, By Organization Size , 2022 & 2032 Figure 10: Global Fixed Asset Management Software Market Y-o-Y Growth Projections, By Organization Size – 2022-2032 Figure 11: Global Fixed Asset Management Software Market Attractiveness Index, By Organization Size – 2022-2032 Figure 12: Global Fixed Asset Management Software Market Share, By Deployment Type , 2022 & 2032 Figure 13: Global Fixed Asset Management Software Market Y-o-Y Growth Projections, By Deployment Type – 2022-2032 Figure 14: Global Fixed Asset Management Software Market Attractiveness Index, By Deployment Type – 2022-2032 Figure 15: Global Fixed Asset Management Software Market Share, By Region, 2022 & 2032 Figure 16: Global Fixed Asset Management Software Market Y-o-Y Growth Projections, By Region – 2022-2032 Figure 17: Global Fixed Asset Management Software Market Attractiveness Index, By Region – 2022-2032 Figure 18: North America Fixed Asset Management Software Market Value (US$ Mn) and Year-on-Year Growth, 2015-2032 Figure 19: North America Fixed Asset Management Software Market Absolute $ Opportunity Historical (2015 - 2021) and Forecast Period (2022 – 2032), US$ Mn Figure 20: North America Fixed Asset Management Software Market Share, By Component , 2022 & 2032 Figure 21: North America Fixed Asset Management Software Market Y-o-Y Growth Projections, By Component – 2022-2032 Figure 22: North America Fixed Asset Management Software Market Attractiveness Index, By Component – 2022-2032 Figure 23: North America Fixed Asset Management Software Market Share, By Vertical, 2022 & 2032 Figure 24: North America Fixed Asset Management Software Market Y-o-Y Growth Projections, By Vertical – 2022-2032 Figure 25: North America Fixed Asset Management Software Market Attractiveness Index, By Vertical – 2022-2032 Figure 26: North America Fixed Asset Management Software Market Share, By Organization Size , 2022 & 2032 Figure 27: North America Fixed Asset Management Software Market Y-o-Y Growth Projections, By Organization Size – 2022-2032 Figure 28: North America Fixed Asset Management Software Market Attractiveness Index, By Organization Size – 2022-2032 Figure 29: North America Fixed Asset Management Software Market Share, By Deployment Type , 2022 & 2032 Figure 30: North America Fixed Asset Management Software Market Y-o-Y Growth Projections, By Deployment Type –2022-2032 Figure 31: North America Fixed Asset Management Software Market Attractiveness Index, By Deployment Type – 2022-2032 Figure 32: North America Fixed Asset Management Software Market Share, By Country, 2022 & 2032 Figure 33: North America Market Y-o-Y Growth Projections, By Country – 2022-2032 Figure 34: North America Market Attractiveness Index, By Country – 2022-2032 Figure 35: Latin America Fixed Asset Management Software Market Value (US$ Mn) and Year-on-Year Growth, 2015-2032 Figure 36: Latin America Fixed Asset Management Software Market Absolute $ Opportunity Historical (2015 - 2021) and Forecast Period (2022 – 2032), US$ Mn Figure 37: Latin America Fixed Asset Management Software Market Share, By Component , 2022 & 2032 Figure 38: Latin America Fixed Asset Management Software Market Y-o-Y Growth Projections, By Component – 2022-2032 Figure 39: Latin America Fixed Asset Management Software Market Attractiveness Index, By Component – 2022-2032 Figure 40: Latin America Fixed Asset Management Software Market Share, By Vertical, 2022 & 2032 Figure 41: Latin America Fixed Asset Management Software Market Y-o-Y Growth Projections, By Vertical – 2022-2032 Figure 42: Latin America Fixed Asset Management Software Market Attractiveness Index, By Vertical – 2022-2032 Figure 43: Latin America Fixed Asset Management Software Market Share, By Organization Size , 2022 & 2032 Figure 44: Latin America Fixed Asset Management Software Market Y-o-Y Growth Projections, By Organization Size – 2022-2032 Figure 45: Latin America Fixed Asset Management Software Market Attractiveness Index, By Organization Size – 2022-2032 Figure 46: Latin America Fixed Asset Management Software Market Share, By Deployment Type , 2022 & 2032 Figure 47: Latin America Fixed Asset Management Software Market Y-o-Y Growth Projections, By Deployment Type – 2022-2032 Figure 48: Latin America Fixed Asset Management Software Market Attractiveness Index, By Deployment Type – 2022-2032 Figure 49: Latin America Fixed Asset Management Software Market Share, By Country, 2022 & 2032 Figure 50: Latin America Fixed Asset Management Software Market Y-o-Y Growth Projections, By Country – 2022-2032 Figure 51: Latin America Fixed Asset Management Software Market Attractiveness Index, By Country – 2022-2032 Figure 52: Europe Fixed Asset Management Software Market Value (US$ Mn) and Year-on-Year Growth, 2015-2032 Figure 53: Europe Fixed Asset Management Software Market Absolute $ Opportunity Historical (2015 - 2021) and Forecast Period (2022 – 2032), US$ Mn Figure 54: Europe Fixed Asset Management Software Market Share, By Component , 2022 & 2032 Figure 55: Europe Fixed Asset Management Software Market Y-o-Y Growth Projections, By Component – 2022-2032 Figure 56: Europe Fixed Asset Management Software Market Attractiveness Index, By Component – 2022-2032 Figure 57: Europe Fixed Asset Management Software Market Share, By Vertical, 2022 & 2032 Figure 58: Europe Fixed Asset Management Software Market Y-o-Y Growth Projections, By Vertical – 2022-2032 Figure 59: Europe Fixed Asset Management Software Market Attractiveness Index, By Vertical – 2022-2032 Figure 60: Europe Fixed Asset Management Software Market Share, By Organization Size , 2022 & 2032 Figure 61: Europe Fixed Asset Management Software Market Y-o-Y Growth Projections, By Organization Size – 2022-2032 Figure 62: Europe Fixed Asset Management Software Market Attractiveness Index, By Organization Size – 2022-2032 Figure 63: Europe Fixed Asset Management Software Market Share, By Deployment Type , 2022 & 2032 Figure 64: Europe Fixed Asset Management Software Market Y-o-Y Growth Projections, By Deployment Type – 2022-2032 Figure 65: Europe Fixed Asset Management Software Market Attractiveness Index, By Deployment Type – 2022-2032 Figure 66: Europe Fixed Asset Management Software Market Share, By Country, 2022 & 2032 Figure 67: Europe Fixed Asset Management Software Market Y-o-Y Growth Projections, By Country – 2022-2032 Figure 68: Europe Fixed Asset Management Software Market Attractiveness Index, By Country – 2022-2032 Figure 69: MEA Fixed Asset Management Software Market Value (US$ Mn) and Year-on-Year Growth, 2015-2032 Figure 70: MEA Fixed Asset Management Software Market Absolute $ Opportunity Historical (2015 - 2021) and Forecast Period (2022 – 2032), US$ Mn Figure 71: MEA Fixed Asset Management Software Market Share, By Component , 2022 & 2032 Figure 72: MEA Fixed Asset Management Software Market Y-o-Y Growth Projections, By Component – 2022-2032 Figure 73: MEA Fixed Asset Management Software Market Attractiveness Index, By Component – 2022-2032 Figure 74: MEA Fixed Asset Management Software Market Share, By Vertical, 2022 & 2032 Figure 75: MEA Fixed Asset Management Software Market Y-o-Y Growth Projections, By Vertical – 2022-2032 Figure 76: MEA Fixed Asset Management Software Market Attractiveness Index, By Vertical – 2022-2032 Figure 77: MEA Fixed Asset Management Software Market Share, By Organization Size , 2022 & 2032 Figure 78: MEA Fixed Asset Management Software Market Y-o-Y Growth Projections, By Organization Size – 2022-2032 Figure 79: MEA Fixed Asset Management Software Market Attractiveness Index, By Organization Size – 2022-2032 Figure 80: MEA Fixed Asset Management Software Market Share, By Deployment Type , 2022 & 2032 Figure 81: MEA Fixed Asset Management Software Market Y-o-Y Growth Projections, By Deployment Type – 2022-2032 Figure 82: MEA Fixed Asset Management Software Market Attractiveness Index, By Deployment Type – 2022-2032 Figure 83: MEA Fixed Asset Management Software Market Share, By Country, 2022 & 2032 Figure 84: MEA Fixed Asset Management Software Market Y-o-Y Growth Projections, By Country – 2022-2032 Figure 85: MEA Fixed Asset Management Software Market Attractiveness Index, By Country – 2022-2032 Figure 86: Asia Pacific Fixed Asset Management Software Market Value (US$ Mn) and Year-on-Year Growth, 2015-2032 Figure 87: Asia Pacific Fixed Asset Management Software Market Absolute $ Opportunity Historical (2015 - 2021) and Forecast Period (2022 – 2032), US$ Mn Figure 88: Asia Pacific Fixed Asset Management Software Market Share, By Component , 2022 & 2032 Figure 89: Asia Pacific Fixed Asset Management Software Market Y-o-Y Growth Projections, By Component – 2022-2032 Figure 90: Asia Pacific Fixed Asset Management Software Market Attractiveness Index, By Component – 2022-2032 Figure 91: Asia Pacific Fixed Asset Management Software Market Share, By Vertical, 2022 & 2032 Figure 92: Asia Pacific Fixed Asset Management Software Market Y-o-Y Growth Projections, By Vertical – 2022-2032 Figure 93: Asia Pacific Fixed Asset Management Software Market Attractiveness Index, By Vertical – 2022-2032 Figure 94: Asia Pacific Fixed Asset Management Software Market Share, By Organization Size , 2022 & 2032 Figure 95: Asia Pacific Fixed Asset Management Software Market Y-o-Y Growth Projections, By Organization Size – 2022-2032 Figure 96: Asia Pacific Fixed Asset Management Software Market Attractiveness Index, By Organization Size – 2022-2032 Figure 97: Asia Pacific Fixed Asset Management Software Market Share, By Deployment Type , 2022 & 2032 Figure 98: Asia Pacific Fixed Asset Management Software Market Y-o-Y Growth Projections, By Deployment Type – 2022-2032 Figure 99: Asia Pacific Fixed Asset Management Software Market Attractiveness Index, By Deployment Type – 2022-2032 Figure 100: Asia Pacific Fixed Asset Management Software Market Share, By Country, 2022 & 2032 Figure 101: Asia Pacific Fixed Asset Management Software Market Y-o-Y Growth Projections, By Country – 2022-2032 Figure 102: Asia Pacific Fixed Asset Management Software Market Attractiveness Index, By Country – 2022-2032
Need specific information?
Request CustomizationExplore Technology Insights
View Reports