Reports

- Global Locations -

Headquarters

Future Market Insights, Inc.

Christiana Corporate, 200
Continental Drive, Suite 401,
Newark, Delaware - 19713,
United States

T: +1-845-579-5705

Americas

Future Market Insights, Inc.

616 Corporate Way, Suite 2-9018,
Valley Cottage, NY 10989, United States

T: +1-347-918-3531

MEA

Future Market Insights

1602-6 Jumeirah Bay X2 Tower, Plot No: JLT-PH2-X2A,
Jumeirah Lakes Towers, Dubai,
United Arab Emirates

Europe

Future Market Insights

3rd Floor, 207 Regent Street,
W1B 3HH London
United Kingdom

T: + 44 (0) 20 8123 9659
D: +44 (0) 20 3287 4268

Asia Pacific

Future Market Insights

IndiaLand Global Tech Park, Unit UG-1, Behind Grand HighStreet, Phase 1, Hinjawadi, MH, Pune – 411057, India

Remote Asset Management Market Outlook (2022 to 2032)

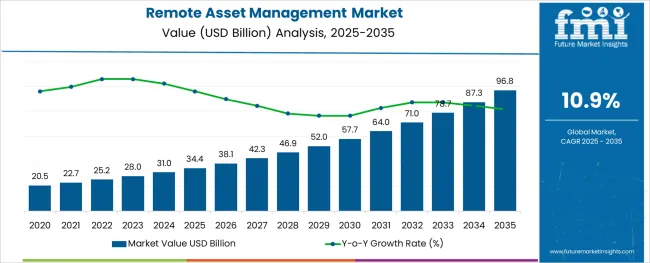
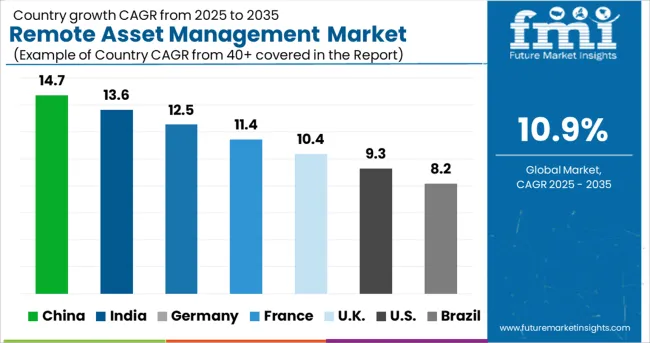
The remote asset management market is anticipated likely to record a CAGR of 10.9% during the forecast period, up from US$ 25,219.8 Million in 2022 to reach a valuation of US$ 75,553 Million by 2032.

Predictive maintenance, IoT-enabled remote asset management solutions, and a decreasing cost of IoT-based sensors are the main factors driving the demand for remote asset management, which in turn reduces operational costs of remote assets by boosting the use of remote asset management.

Monitoring and maintaining assets, machinery, and systems from a distance is now possible with remote asset management, thanks to an analytical system. To better manage and control assets, remote asset management allows real-time two-way communication between the organization's assets and the central monitoring application.

Since remote asset management reduces costs while increasing efficiency and convenience, the rate of adoption of remote asset management is rising. The remote asset management market is flourishing due to the numerous advantages provided by these solutions.

Attributes Details
Estimated Market Value (2022) US$ 25219.8 Million
Forecasted Market Value (2032) US$ 75553 Million
CAGR (2022 to 2032) 10.9%

Cloud computing services are becoming more affordable; internet connectivity is improving; components are becoming cheaper; and governments in developed and developing regions are spending more money on ICT. These factors are expected to drive the demand for remote asset management to significant levels in the short and long term. Increasing smartphone adoption, internet penetration, and IoT improvements are further contributing factors to the remote asset management market. Remote asset management market growth is projected to be hindered by the high cost of asset management systems.

The report sheds light on the factors improving the sales of remote asset management, and, in turn, the opportunities for the market players. However, the remote asset management market also faces some challenges, which might limit the remote asset management market share from reaching its potential.

Don't pay for what you don't need

Customize your report by selecting specific countries or regions and save 30%!

What are the Key Drivers to the Remote Asset Management Market Share?

The remote asset management market will benefit from an increase in the usage of IoT for efficient asset management, intelligent infrastructure, and real-time asset monitoring.

As sensor technology becomes more widely adopted, the need for remote asset management solutions will grow, as will the need for lower operational costs as a result of newer, more inventive solutions. This is leading to higher sales of remote asset management.

The remote asset management market's expansion is likely to be fuelled by an increase in the use of IoT-enabled remote asset management solutions. Predictive maintenance is likely to see an increase in demand if it is implemented more widely. In the future, the remote asset management industry is likely to develop as IoT-based sensors become more affordable.

Using big data, GPS tracking, and other IoT devices, manufacturers are modernizing their supply chains in order to better manage supply, demand, and logistics challenges while also giving themselves an advantage over their competitors and staying one step ahead of their competitors in the remote asset management market. A pharmaceutical company, Apotex, updated its manufacturing methods to automate manual processes. RFID tagging, sorting, and process flow tracking were all used to ensure consistent batch production. Real-time monitoring of production operations resulted as a result.

Because of their high scalability, connection with ERPs and corporate systems, and the ability to enable safe connectivity with corporate systems, remote asset management systems are becoming increasingly popular with corporate purchasers. Costs can be reduced and a competitive advantage is gained by automating maintenance, supply management, and alarms management. While remote asset management systems are likely to develop during the forecast period, these advantages are expected to drive the remote asset management market expansion.

How is the Remote Asset Management Market Segmented?

The mobile asset segment of the remote asset management market is expected to have a higher CAGR during the forecast period. The growth is due to the rising acceptance of disruptive technologies that let utilities deploy remote visual monitoring and alarm response management. Mobile assets with GIS integration enable greater access to business and spatial data in a single view, improved asset management in the context of location, and the ability to visualize and search for assets on a map.
Sudip Saha
Sudip Saha

Principal Consultant

Talk to Analyst

Find your sweet spots for generating winning opportunities in this market.

Which is the Leading Region in the Remote Asset Management Market?

North America is likely to lead the remote asset management market due to its advanced transportation, logistics, and manufacturing industries. Government initiatives such as the Federal Highway Association (FHWA) in the leadership of AASHTO and DOTs are striving to integrate remote asset management in logistics and transportation. Increasing cargo thefts lost items in transit, and real-time location solutions in the region will boost the remote asset management market.

Due to the growing acceptance of cloud-based solutions and emerging technologies, such as big data analytics, mobility, and the Internet of Things, Asia Pacific is likely to see substantial growth in the adoption of remote asset management (IoT). A huge number of linked devices require asset management in this region, making it a major remote asset management market. There is also a growing need for remote asset management systems in areas like retail, building automation, logistics and transportation, utilities, and healthcare in various nations in the Asia-Pacific region. Emerging economies like China and India are likely to fuel the expansion of the global remote asset management market.

In contrast, the remote asset management sector in Europe is experiencing significant expansion due to structural factors, such as monetary policy loosening, government intervention, and an emphasis on environmental, social, and governance (ESG) performance. Middle East and Africa are predicted to grow significantly in the global remote asset management market because of their rapid expansion, which necessitates remote access management solutions rather than traditional asset management systems in the region.

Start-up Ecosystem

Startup Ecosystem in the Remote Asset Management Market

In today's business climate, automation is essential. Dynamic and automated asset monitoring solutions provide organizations with real-time data and visibility into operational status. A quick response and a strong link between human capital and assets are possible because of this.

Increased productivity, regulatory compliance, threat mitigation, and asset monitoring are just some of the benefits of using a cloud-based platform. IoT technologies have already been utilized by more than two-thirds of manufacturers to increase their ROA. This is also leading the development of the startup ecosystem in the remote asset management market.
Get the data you need at a Fraction of the cost

Personalize your report by choosing insights you need
and save 40%!

How is the Competitive Landscape in the Remote Asset Management Market?

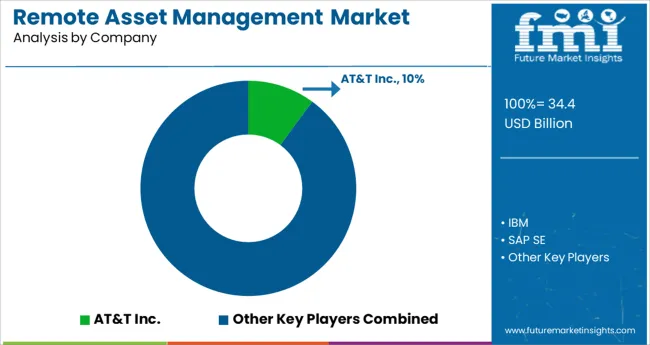
Many different companies are involved in the field of remote asset tracking, resulting in a fragmented remote asset management industry. There are several Research and Development activities being undertaken by solution providers in order to improve their present solutions and create new products that incorporate the most recent technology breakthroughs. Global growth is also seen as a way to gain the most remote asset management market share.

The report consists of key players, contributing to the remote asset management market share. It also consists of organic and inorganic growth strategies adopted by market players to improve their market positions. This exclusive report analyzes the competitive landscape and remote asset management market share acquired by players to strengthen their market position.

Recent Developments

Customers of remote asset management systems are utilizing a variety of organic and inorganic approaches, such as mergers and acquisitions and new product launches and alliances to increase their market share. As an example, Cisco Systems Inc. purchased Kenna Security Inc. in May of that year. This deal will help Cisco change its security and IT telecommunications to reduce cyberattacks.

Key Players:

  • Siemens AG. Cisco Systems Inc.
  • AT&T
  • Hitachi Ltd. Schneider Electric
  • Infosys Limited
  • PTC
  • Rockwell Automation Inc.
  • IBM Corporation
  • SAP
  • Bosch.IO
  • Verizon
  • Meridium Inc.
  • Rapid Value Solutions
  • Vodafone Group
  • EAMnrace
  • RCS Technologies
  • ROAMWORKS
  • Accruent
  • Intellimation Pvt. Ltd

Report Scope

Report Attribute Details
Growth rate CAGR of 10.9% from 2022 to 2032
The base year for estimation 2021
Historical data 2016 to 2021
Forecast period 2022 to 2032
Quantitative units Revenue in USD million and CAGR from 2022 to 2032
Report Coverage Revenue forecast, volume forecast, company ranking, competitive landscape, growth factors, and trends, Pricing Analysis
Segments Covered Communication, Application, End-user industries, Region
Regional scope North America; Western Europe, Eastern Europe, Middle East, Africa, ASEAN, South Asia, Rest of Asia, Australia, and New Zealand
Country scope United States of America; Canada; Mexico; Germany; United Kingdom; France; Italy; Spain; Russia; Belgium; Poland; Czech Republic; China; India; Japan; Australia; Brazil; Argentina; Colombia; Saudi Arabia; UAE; Iran; South Africa
Key companies profiled Siemens AG. Cisco Systems Inc., AT&T, Hitachi Ltd. Schneider Electric, Infosys Limited, PTC, Rockwell Automation Inc., IBM Corporation, SAP, Bosch.IO, Verizon, Meridium Inc., Rapid Value Solutions, Vodafone Group, EAMnrace, RCS Technologies, ROAMWORKS, Accruent, and Intellimation Pvt. Ltd among others.
Customization scope Free report customization (equivalent to up to 8 analysts' working days) with purchase. Addition or alteration to country, regional & segment scope.
Pricing and purchase options Avail customized purchase options to meet your exact research needs.

Key Segments

By Communication Type:

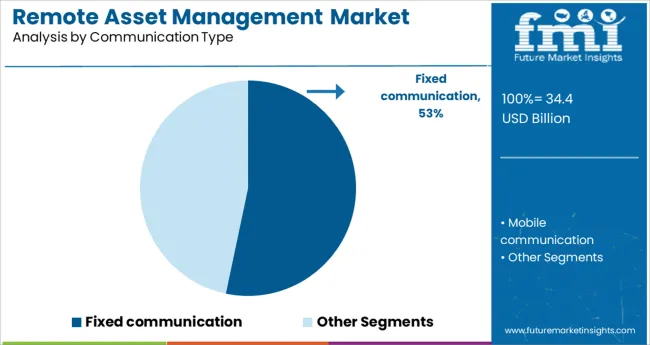
  • Fixed communication
  • Mobile communication

By Application:

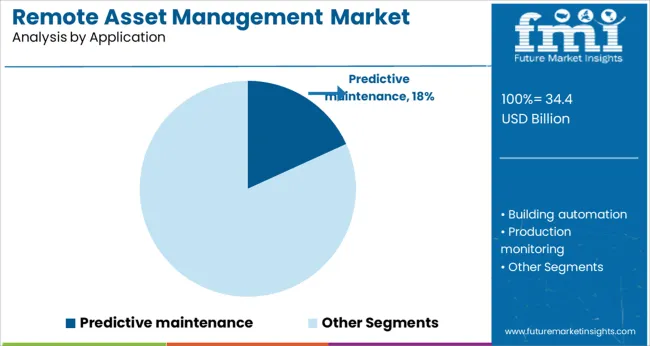
  • Predictive maintenance
  • Building automation
  • Production monitoring
  • Vehicle tracking
  • Analytics
  • Performance management
  • Remote programming of consumer devices
  • Air conditioner monitoring

By End-User Industries:

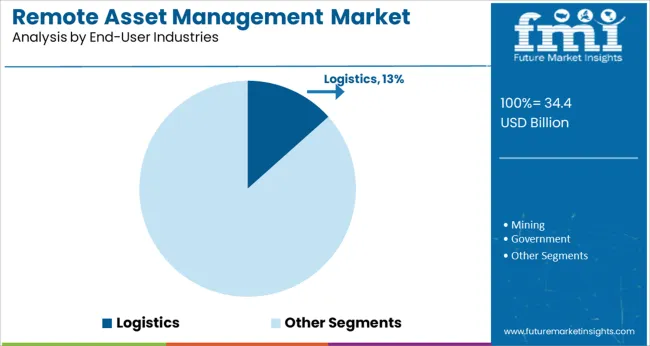
  • Logistics
  • Mining
  • Government
  • Fisheries
  • Healthcare
  • Oil & gas
  • Utilities
  • BFSI
  • Manufacturing
  • Retail & consumer goods
  • Automobiles
  • Information technology
  • Telecommunication

By Region:

  • North America
  • Latin America
  • Asia Pacific
  • Middle East and Africa (MEA)
  • Europe

Frequently Asked Questions

What is the Growth Outlook for the Remote Asset Management Market?

The remote asset management market is likely to register a CAGR of 10.9% during the forecast period.

What is the Future of the Remote Asset Management Market?

As per the analysis, the remote asset management market share is likely to be US$ 75,553 Million by 2032.

Which is the Key Driver in the Remote Asset Management Market?

Demand for remote asset management is likely to rise on the back of increasing innovative solutions.

Table of Content

1. Executive Summary | Remote Asset Management Market

    1.1. Global Market Outlook

    1.2. Demand-side Trends

    1.3. Supply-side Trends

    1.4. Technology Roadmap Analysis

    1.5. Analysis and Recommendations

2. Market Overview

    2.1. Market Coverage / Taxonomy

    2.2. Market Definition / Scope / Limitations

3. Market Background

    3.1. Market Dynamics

        3.1.1. Drivers

        3.1.2. Restraints

        3.1.3. Opportunity

        3.1.4. Trends

    3.2. Scenario Forecast

        3.2.1. Demand in Optimistic Scenario

        3.2.2. Demand in Likely Scenario

        3.2.3. Demand in Conservative Scenario

    3.3. Opportunity Map Analysis

    3.4. Investment Feasibility Matrix

    3.5. PESTLE and Porter’s Analysis

    3.6. Regulatory Landscape

        3.6.1. By Key Regions

        3.6.2. By Key Countries

    3.7. Regional Parent Market Outlook

4. Global Market Analysis 2017 to 2021 and Forecast, 2022 to 2032

    4.1. Historical Market Size Value (US$ Million) Analysis, 2017 to 2021

    4.2. Current and Future Market Size Value (US$ Million) Projections, 2022 to 2032

        4.2.1. Y-o-Y Growth Trend Analysis

        4.2.2. Absolute Opportunity Analysis

5. Global Market Analysis 2017 to 2021 and Forecast 2022 to 2032, By Communication Type

    5.1. Introduction / Key Findings

    5.2. Historical Market Size Value (US$ Million) Analysis By Communication Type, 2017 to 2021

    5.3. Current and Future Market Size Value (US$ Million) Analysis and Forecast By Communication Type, 2022 to 2032

        5.3.1. Fixed Communication

        5.3.2. Mobile Communication

    5.4. Y-o-Y Growth Trend Analysis By Communication Type, 2017 to 2021

    5.5. Absolute Opportunity Analysis By Communication Type, 2022 to 2032

6. Global Market Analysis 2017 to 2021 and Forecast 2022 to 2032, By Application

    6.1. Introduction / Key Findings

    6.2. Historical Market Size Value (US$ Million) Analysis By Application, 2017 to 2021

    6.3. Current and Future Market Size Value (US$ Million) Analysis and Forecast By Application, 2022 to 2032

        6.3.1. Predictive Maintenance

        6.3.2. Building Automation

        6.3.3. Production Monitoring

        6.3.4. Vehicle Tracking

        6.3.5. Analytics

        6.3.6. Performance Management

        6.3.7. Remote Programming of Consumer Devices

        6.3.8. Air Conditioner Monitoring

    6.4. Y-o-Y Growth Trend Analysis By Application, 2017 to 2021

    6.5. Absolute Opportunity Analysis By Application, 2022 to 2032

7. Global Market Analysis 2017 to 2021 and Forecast 2022 to 2032, By End User

    7.1. Introduction / Key Findings

    7.2. Historical Market Size Value (US$ Million) Analysis By End User, 2017 to 2021

    7.3. Current and Future Market Size Value (US$ Million) Analysis and Forecast By End User, 2022 to 2032

        7.3.1. Logistics

        7.3.2. Mining

        7.3.3. Government

        7.3.4. Fisheries

        7.3.5. Healthcare

        7.3.6. Oil & Gas

        7.3.7. Utilities

        7.3.8. BFSI

        7.3.9. Manufacturing

        7.3.10. Retail & Consumer Goods

        7.3.11. Automobiles

        7.3.12. Information Technology

        7.3.13. Telecommunication

    7.4. Y-o-Y Growth Trend Analysis By End User, 2017 to 2021

    7.5. Absolute Opportunity Analysis By End User, 2022 to 2032

8. Global Market Analysis 2017 to 2021 and Forecast 2022 to 2032, By Region

    8.1. Introduction

    8.2. Historical Market Size Value (US$ Million) Analysis By Region, 2017 to 2021

    8.3. Current Market Size Value (US$ Million) Analysis and Forecast By Region, 2022 to 2032

        8.3.1. North America

        8.3.2. Latin America

        8.3.3. Europe

        8.3.4. Asia Pacific

        8.3.5. Middle East and Africa

    8.4. Market Attractiveness Analysis By Region

9. North America Market Analysis 2017 to 2021 and Forecast 2022 to 2032, By Country

    9.1. Historical Market Size Value (US$ Million) Trend Analysis By Market Taxonomy, 2017 to 2021

    9.2. Market Size Value (US$ Million) Forecast By Market Taxonomy, 2022 to 2032

        9.2.1. By Country

            9.2.1.1. US

            9.2.1.2. Canada

        9.2.2. By Communication Type

        9.2.3. By Application

        9.2.4. By End User

    9.3. Market Attractiveness Analysis

        9.3.1. By Country

        9.3.2. By Communication Type

        9.3.3. By Application

        9.3.4. By End User

    9.4. Key Takeaways

10. Latin America Market Analysis 2017 to 2021 and Forecast 2022 to 2032, By Country

    10.1. Historical Market Size Value (US$ Million) Trend Analysis By Market Taxonomy, 2017 to 2021

    10.2. Market Size Value (US$ Million) Forecast By Market Taxonomy, 2022 to 2032

        10.2.1. By Country

            10.2.1.1. Brazil

            10.2.1.2. Mexico

            10.2.1.3. Rest of Latin America

        10.2.2. By Communication Type

        10.2.3. By Application

        10.2.4. By End User

    10.3. Market Attractiveness Analysis

        10.3.1. By Country

        10.3.2. By Communication Type

        10.3.3. By Application

        10.3.4. By End User

    10.4. Key Takeaways

11. Europe Market Analysis 2017 to 2021 and Forecast 2022 to 2032, By Country

    11.1. Historical Market Size Value (US$ Million) Trend Analysis By Market Taxonomy, 2017 to 2021

    11.2. Market Size Value (US$ Million) Forecast By Market Taxonomy, 2022 to 2032

        11.2.1. By Country

            11.2.1.1. Germany

            11.2.1.2. United Kingdom

            11.2.1.3. France

            11.2.1.4. Spain

            11.2.1.5. Italy

            11.2.1.6. Rest of Europe

        11.2.2. By Communication Type

        11.2.3. By Application

        11.2.4. By End User

    11.3. Market Attractiveness Analysis

        11.3.1. By Country

        11.3.2. By Communication Type

        11.3.3. By Application

        11.3.4. By End User

    11.4. Key Takeaways

12. Asia Pacific Market Analysis 2017 to 2021 and Forecast 2022 to 2032, By Country

    12.1. Historical Market Size Value (US$ Million) Trend Analysis By Market Taxonomy, 2017 to 2021

    12.2. Market Size Value (US$ Million) Forecast By Market Taxonomy, 2022 to 2032

        12.2.1. By Country

            12.2.1.1. China

            12.2.1.2. Japan

            12.2.1.3. South Korea

            12.2.1.4. Rest of Asia Pacific

        12.2.2. By Communication Type

        12.2.3. By Application

        12.2.4. By End User

    12.3. Market Attractiveness Analysis

        12.3.1. By Country

        12.3.2. By Communication Type

        12.3.3. By Application

        12.3.4. By End User

    12.4. Key Takeaways

13. Middle East and Africa Market Analysis 2017 to 2021 and Forecast 2022 to 2032, By Country

    13.1. Historical Market Size Value (US$ Million) Trend Analysis By Market Taxonomy, 2017 to 2021

    13.2. Market Size Value (US$ Million) Forecast By Market Taxonomy, 2022 to 2032

        13.2.1. By Country

            13.2.1.1. GCC Countries

            13.2.1.2. South Africa

            13.2.1.3. Israel

            13.2.1.4. Rest of Middle East and Africa

        13.2.2. By Communication Type

        13.2.3. By Application

        13.2.4. By End User

    13.3. Market Attractiveness Analysis

        13.3.1. By Country

        13.3.2. By Communication Type

        13.3.3. By Application

        13.3.4. By End User

    13.4. Key Takeaways

14. Key Countries Market Analysis

    14.1. US

        14.1.1. Pricing Analysis

        14.1.2. Market Share Analysis, 2021

            14.1.2.1. By Communication Type

            14.1.2.2. By Application

            14.1.2.3. By End User

    14.2. Canada

        14.2.1. Pricing Analysis

        14.2.2. Market Share Analysis, 2021

            14.2.2.1. By Communication Type

            14.2.2.2. By Application

            14.2.2.3. By End User

    14.3. Brazil

        14.3.1. Pricing Analysis

        14.3.2. Market Share Analysis, 2021

            14.3.2.1. By Communication Type

            14.3.2.2. By Application

            14.3.2.3. By End User

    14.4. Mexico

        14.4.1. Pricing Analysis

        14.4.2. Market Share Analysis, 2021

            14.4.2.1. By Communication Type

            14.4.2.2. By Application

            14.4.2.3. By End User

    14.5. Germany

        14.5.1. Pricing Analysis

        14.5.2. Market Share Analysis, 2021

            14.5.2.1. By Communication Type

            14.5.2.2. By Application

            14.5.2.3. By End User

    14.6. United Kingdom

        14.6.1. Pricing Analysis

        14.6.2. Market Share Analysis, 2021

            14.6.2.1. By Communication Type

            14.6.2.2. By Application

            14.6.2.3. By End User

    14.7. France

        14.7.1. Pricing Analysis

        14.7.2. Market Share Analysis, 2021

            14.7.2.1. By Communication Type

            14.7.2.2. By Application

            14.7.2.3. By End User

    14.8. Spain

        14.8.1. Pricing Analysis

        14.8.2. Market Share Analysis, 2021

            14.8.2.1. By Communication Type

            14.8.2.2. By Application

            14.8.2.3. By End User

    14.9. Italy

        14.9.1. Pricing Analysis

        14.9.2. Market Share Analysis, 2021

            14.9.2.1. By Communication Type

            14.9.2.2. By Application

            14.9.2.3. By End User

    14.10. China

        14.10.1. Pricing Analysis

        14.10.2. Market Share Analysis, 2021

            14.10.2.1. By Communication Type

            14.10.2.2. By Application

            14.10.2.3. By End User

    14.11. Japan

        14.11.1. Pricing Analysis

        14.11.2. Market Share Analysis, 2021

            14.11.2.1. By Communication Type

            14.11.2.2. By Application

            14.11.2.3. By End User

    14.12. South Korea

        14.12.1. Pricing Analysis

        14.12.2. Market Share Analysis, 2021

            14.12.2.1. By Communication Type

            14.12.2.2. By Application

            14.12.2.3. By End User

    14.13. GCC Countries

        14.13.1. Pricing Analysis

        14.13.2. Market Share Analysis, 2021

            14.13.2.1. By Communication Type

            14.13.2.2. By Application

            14.13.2.3. By End User

    14.14. South Africa

        14.14.1. Pricing Analysis

        14.14.2. Market Share Analysis, 2021

            14.14.2.1. By Communication Type

            14.14.2.2. By Application

            14.14.2.3. By End User

    14.15. Israel

        14.15.1. Pricing Analysis

        14.15.2. Market Share Analysis, 2021

            14.15.2.1. By Communication Type

            14.15.2.2. By Application

            14.15.2.3. By End User

15. Market Structure Analysis

    15.1. Competition Dashboard

    15.2. Competition Benchmarking

    15.3. Market Share Analysis of Top Players

        15.3.1. By Regional

        15.3.2. By Communication Type

        15.3.3. By Application

        15.3.4. By End User

16. Competition Analysis

    16.1. Competition Deep Dive

        16.1.1. AT&T Inc.

            16.1.1.1. Overview

            16.1.1.2. Product Portfolio

            16.1.1.3. Profitability by Market Segments

            16.1.1.4. Sales Footprint

            16.1.1.5. Strategy Overview

                16.1.1.5.1. Marketing Strategy

        16.1.2. IBM

            16.1.2.1. Overview

            16.1.2.2. Product Portfolio

            16.1.2.3. Profitability by Market Segments

            16.1.2.4. Sales Footprint

            16.1.2.5. Strategy Overview

                16.1.2.5.1. Marketing Strategy

        16.1.3. SAP SE

            16.1.3.1. Overview

            16.1.3.2. Product Portfolio

            16.1.3.3. Profitability by Market Segments

            16.1.3.4. Sales Footprint

            16.1.3.5. Strategy Overview

                16.1.3.5.1. Marketing Strategy

        16.1.4. Rockwell Automation

            16.1.4.1. Overview

            16.1.4.2. Product Portfolio

            16.1.4.3. Profitability by Market Segments

            16.1.4.4. Sales Footprint

            16.1.4.5. Strategy Overview

                16.1.4.5.1. Marketing Strategy

        16.1.5. Cisco Systems

            16.1.5.1. Overview

            16.1.5.2. Product Portfolio

            16.1.5.3. Profitability by Market Segments

            16.1.5.4. Sales Footprint

            16.1.5.5. Strategy Overview

                16.1.5.5.1. Marketing Strategy

        16.1.6. Succorfish M2M Ltd

            16.1.6.1. Overview

            16.1.6.2. Product Portfolio

            16.1.6.3. Profitability by Market Segments

            16.1.6.4. Sales Footprint

            16.1.6.5. Strategy Overview

                16.1.6.5.1. Marketing Strategy

        16.1.7. Bosch Software Innovations

            16.1.7.1. Overview

            16.1.7.2. Product Portfolio

            16.1.7.3. Profitability by Market Segments

            16.1.7.4. Sales Footprint

            16.1.7.5. Strategy Overview

                16.1.7.5.1. Marketing Strategy

        16.1.8. Hitachi

            16.1.8.1. Overview

            16.1.8.2. Product Portfolio

            16.1.8.3. Profitability by Market Segments

            16.1.8.4. Sales Footprint

            16.1.8.5. Strategy Overview

                16.1.8.5.1. Marketing Strategy

        16.1.9. GE Digital

            16.1.9.1. Overview

            16.1.9.2. Product Portfolio

            16.1.9.3. Profitability by Market Segments

            16.1.9.4. Sales Footprint

            16.1.9.5. Strategy Overview

                16.1.9.5.1. Marketing Strategy

        16.1.10. Schneider Electric SE

            16.1.10.1. Overview

            16.1.10.2. Product Portfolio

            16.1.10.3. Profitability by Market Segments

            16.1.10.4. Sales Footprint

            16.1.10.5. Strategy Overview

                16.1.10.5.1. Marketing Strategy

        16.1.11. Siemens

            16.1.11.1. Overview

            16.1.11.2. Product Portfolio

            16.1.11.3. Profitability by Market Segments

            16.1.11.4. Sales Footprint

            16.1.11.5. Strategy Overview

                16.1.11.5.1. Marketing Strategy

        16.1.12. Infosys Limited

            16.1.12.1. Overview

            16.1.12.2. Product Portfolio

            16.1.12.3. Profitability by Market Segments

            16.1.12.4. Sales Footprint

            16.1.12.5. Strategy Overview

                16.1.12.5.1. Marketing Strategy

        16.1.13. Magic Leap Herzliya

            16.1.13.1. Overview

            16.1.13.2. Product Portfolio

            16.1.13.3. Profitability by Market Segments

            16.1.13.4. Sales Footprint

            16.1.13.5. Strategy Overview

                16.1.13.5.1. Marketing Strategy

        16.1.14. Verizon Communications

            16.1.14.1. Overview

            16.1.14.2. Product Portfolio

            16.1.14.3. Profitability by Market Segments

            16.1.14.4. Sales Footprint

            16.1.14.5. Strategy Overview

                16.1.14.5.1. Marketing Strategy

        16.1.15. Vodafone Group

            16.1.15.1. Overview

            16.1.15.2. Product Portfolio

            16.1.15.3. Profitability by Market Segments

            16.1.15.4. Sales Footprint

            16.1.15.5. Strategy Overview

                16.1.15.5.1. Marketing Strategy

17. Assumptions & Acronyms Used

18. Research Methodology

List of Tables

Table 1: Global Market Value (US$ Million) Forecast by Region, 2017 to 2032

Table 2: Global Market Value (US$ Million) Forecast by Communication Type, 2017 to 2032

Table 3: Global Market Value (US$ Million) Forecast by Application, 2017 to 2032

Table 4: Global Market Value (US$ Million) Forecast by End User, 2017 to 2032

Table 5: North America Market Value (US$ Million) Forecast by Country, 2017 to 2032

Table 6: North America Market Value (US$ Million) Forecast by Communication Type, 2017 to 2032

Table 7: North America Market Value (US$ Million) Forecast by Application, 2017 to 2032

Table 8: North America Market Value (US$ Million) Forecast by End User, 2017 to 2032

Table 9: Latin America Market Value (US$ Million) Forecast by Country, 2017 to 2032

Table 10: Latin America Market Value (US$ Million) Forecast by Communication Type, 2017 to 2032

Table 11: Latin America Market Value (US$ Million) Forecast by Application, 2017 to 2032

Table 12: Latin America Market Value (US$ Million) Forecast by End User, 2017 to 2032

Table 13: Europe Market Value (US$ Million) Forecast by Country, 2017 to 2032

Table 14: Europe Market Value (US$ Million) Forecast by Communication Type, 2017 to 2032

Table 15: Europe Market Value (US$ Million) Forecast by Application, 2017 to 2032

Table 16: Europe Market Value (US$ Million) Forecast by End User, 2017 to 2032

Table 17: Asia Pacific Market Value (US$ Million) Forecast by Country, 2017 to 2032

Table 18: Asia Pacific Market Value (US$ Million) Forecast by Communication Type, 2017 to 2032

Table 19: Asia Pacific Market Value (US$ Million) Forecast by Application, 2017 to 2032

Table 20: Asia Pacific Market Value (US$ Million) Forecast by End User, 2017 to 2032

Table 21: Middle East and Africa Market Value (US$ Million) Forecast by Country, 2017 to 2032

Table 22: Middle East and Africa Market Value (US$ Million) Forecast by Communication Type, 2017 to 2032

Table 23: Middle East and Africa Market Value (US$ Million) Forecast by Application, 2017 to 2032

Table 24: Middle East and Africa Market Value (US$ Million) Forecast by End User, 2017 to 2032

List of Charts

Figure 1: Global Market Value (US$ Million) by Communication Type, 2022 to 2032

Figure 2: Global Market Value (US$ Million) by Application, 2022 to 2032

Figure 3: Global Market Value (US$ Million) by End User, 2022 to 2032

Figure 4: Global Market Value (US$ Million) by Region, 2022 to 2032

Figure 5: Global Market Value (US$ Million) Analysis by Region, 2017 to 2032

Figure 6: Global Market Value Share (%) and BPS Analysis by Region, 2022 to 2032

Figure 7: Global Market Y-o-Y Growth (%) Projections by Region, 2022 to 2032

Figure 8: Global Market Value (US$ Million) Analysis by Communication Type, 2017 to 2032

Figure 9: Global Market Value Share (%) and BPS Analysis by Communication Type, 2022 to 2032

Figure 10: Global Market Y-o-Y Growth (%) Projections by Communication Type, 2022 to 2032

Figure 11: Global Market Value (US$ Million) Analysis by Application, 2017 to 2032

Figure 12: Global Market Value Share (%) and BPS Analysis by Application, 2022 to 2032

Figure 13: Global Market Y-o-Y Growth (%) Projections by Application, 2022 to 2032

Figure 14: Global Market Value (US$ Million) Analysis by End User, 2017 to 2032

Figure 15: Global Market Value Share (%) and BPS Analysis by End User, 2022 to 2032

Figure 16: Global Market Y-o-Y Growth (%) Projections by End User, 2022 to 2032

Figure 17: Global Market Attractiveness by Communication Type, 2022 to 2032

Figure 18: Global Market Attractiveness by Application, 2022 to 2032

Figure 19: Global Market Attractiveness by End User, 2022 to 2032

Figure 20: Global Market Attractiveness by Region, 2022 to 2032

Figure 21: North America Market Value (US$ Million) by Communication Type, 2022 to 2032

Figure 22: North America Market Value (US$ Million) by Application, 2022 to 2032

Figure 23: North America Market Value (US$ Million) by End User, 2022 to 2032

Figure 24: North America Market Value (US$ Million) by Country, 2022 to 2032

Figure 25: North America Market Value (US$ Million) Analysis by Country, 2017 to 2032

Figure 26: North America Market Value Share (%) and BPS Analysis by Country, 2022 to 2032

Figure 27: North America Market Y-o-Y Growth (%) Projections by Country, 2022 to 2032

Figure 28: North America Market Value (US$ Million) Analysis by Communication Type, 2017 to 2032

Figure 29: North America Market Value Share (%) and BPS Analysis by Communication Type, 2022 to 2032

Figure 30: North America Market Y-o-Y Growth (%) Projections by Communication Type, 2022 to 2032

Figure 31: North America Market Value (US$ Million) Analysis by Application, 2017 to 2032

Figure 32: North America Market Value Share (%) and BPS Analysis by Application, 2022 to 2032

Figure 33: North America Market Y-o-Y Growth (%) Projections by Application, 2022 to 2032

Figure 34: North America Market Value (US$ Million) Analysis by End User, 2017 to 2032

Figure 35: North America Market Value Share (%) and BPS Analysis by End User, 2022 to 2032

Figure 36: North America Market Y-o-Y Growth (%) Projections by End User, 2022 to 2032

Figure 37: North America Market Attractiveness by Communication Type, 2022 to 2032

Figure 38: North America Market Attractiveness by Application, 2022 to 2032

Figure 39: North America Market Attractiveness by End User, 2022 to 2032

Figure 40: North America Market Attractiveness by Country, 2022 to 2032

Figure 41: Latin America Market Value (US$ Million) by Communication Type, 2022 to 2032

Figure 42: Latin America Market Value (US$ Million) by Application, 2022 to 2032

Figure 43: Latin America Market Value (US$ Million) by End User, 2022 to 2032

Figure 44: Latin America Market Value (US$ Million) by Country, 2022 to 2032

Figure 45: Latin America Market Value (US$ Million) Analysis by Country, 2017 to 2032

Figure 46: Latin America Market Value Share (%) and BPS Analysis by Country, 2022 to 2032

Figure 47: Latin America Market Y-o-Y Growth (%) Projections by Country, 2022 to 2032

Figure 48: Latin America Market Value (US$ Million) Analysis by Communication Type, 2017 to 2032

Figure 49: Latin America Market Value Share (%) and BPS Analysis by Communication Type, 2022 to 2032

Figure 50: Latin America Market Y-o-Y Growth (%) Projections by Communication Type, 2022 to 2032

Figure 51: Latin America Market Value (US$ Million) Analysis by Application, 2017 to 2032

Figure 52: Latin America Market Value Share (%) and BPS Analysis by Application, 2022 to 2032

Figure 53: Latin America Market Y-o-Y Growth (%) Projections by Application, 2022 to 2032

Figure 54: Latin America Market Value (US$ Million) Analysis by End User, 2017 to 2032

Figure 55: Latin America Market Value Share (%) and BPS Analysis by End User, 2022 to 2032

Figure 56: Latin America Market Y-o-Y Growth (%) Projections by End User, 2022 to 2032

Figure 57: Latin America Market Attractiveness by Communication Type, 2022 to 2032

Figure 58: Latin America Market Attractiveness by Application, 2022 to 2032

Figure 59: Latin America Market Attractiveness by End User, 2022 to 2032

Figure 60: Latin America Market Attractiveness by Country, 2022 to 2032

Figure 61: Europe Market Value (US$ Million) by Communication Type, 2022 to 2032

Figure 62: Europe Market Value (US$ Million) by Application, 2022 to 2032

Figure 63: Europe Market Value (US$ Million) by End User, 2022 to 2032

Figure 64: Europe Market Value (US$ Million) by Country, 2022 to 2032

Figure 65: Europe Market Value (US$ Million) Analysis by Country, 2017 to 2032

Figure 66: Europe Market Value Share (%) and BPS Analysis by Country, 2022 to 2032

Figure 67: Europe Market Y-o-Y Growth (%) Projections by Country, 2022 to 2032

Figure 68: Europe Market Value (US$ Million) Analysis by Communication Type, 2017 to 2032

Figure 69: Europe Market Value Share (%) and BPS Analysis by Communication Type, 2022 to 2032

Figure 70: Europe Market Y-o-Y Growth (%) Projections by Communication Type, 2022 to 2032

Figure 71: Europe Market Value (US$ Million) Analysis by Application, 2017 to 2032

Figure 72: Europe Market Value Share (%) and BPS Analysis by Application, 2022 to 2032

Figure 73: Europe Market Y-o-Y Growth (%) Projections by Application, 2022 to 2032

Figure 74: Europe Market Value (US$ Million) Analysis by End User, 2017 to 2032

Figure 75: Europe Market Value Share (%) and BPS Analysis by End User, 2022 to 2032

Figure 76: Europe Market Y-o-Y Growth (%) Projections by End User, 2022 to 2032

Figure 77: Europe Market Attractiveness by Communication Type, 2022 to 2032

Figure 78: Europe Market Attractiveness by Application, 2022 to 2032

Figure 79: Europe Market Attractiveness by End User, 2022 to 2032

Figure 80: Europe Market Attractiveness by Country, 2022 to 2032

Figure 81: Asia Pacific Market Value (US$ Million) by Communication Type, 2022 to 2032

Figure 82: Asia Pacific Market Value (US$ Million) by Application, 2022 to 2032

Figure 83: Asia Pacific Market Value (US$ Million) by End User, 2022 to 2032

Figure 84: Asia Pacific Market Value (US$ Million) by Country, 2022 to 2032

Figure 85: Asia Pacific Market Value (US$ Million) Analysis by Country, 2017 to 2032

Figure 86: Asia Pacific Market Value Share (%) and BPS Analysis by Country, 2022 to 2032

Figure 87: Asia Pacific Market Y-o-Y Growth (%) Projections by Country, 2022 to 2032

Figure 88: Asia Pacific Market Value (US$ Million) Analysis by Communication Type, 2017 to 2032

Figure 89: Asia Pacific Market Value Share (%) and BPS Analysis by Communication Type, 2022 to 2032

Figure 90: Asia Pacific Market Y-o-Y Growth (%) Projections by Communication Type, 2022 to 2032

Figure 91: Asia Pacific Market Value (US$ Million) Analysis by Application, 2017 to 2032

Figure 92: Asia Pacific Market Value Share (%) and BPS Analysis by Application, 2022 to 2032

Figure 93: Asia Pacific Market Y-o-Y Growth (%) Projections by Application, 2022 to 2032

Figure 94: Asia Pacific Market Value (US$ Million) Analysis by End User, 2017 to 2032

Figure 95: Asia Pacific Market Value Share (%) and BPS Analysis by End User, 2022 to 2032

Figure 96: Asia Pacific Market Y-o-Y Growth (%) Projections by End User, 2022 to 2032

Figure 97: Asia Pacific Market Attractiveness by Communication Type, 2022 to 2032

Figure 98: Asia Pacific Market Attractiveness by Application, 2022 to 2032

Figure 99: Asia Pacific Market Attractiveness by End User, 2022 to 2032

Figure 100: Asia Pacific Market Attractiveness by Country, 2022 to 2032

Figure 101: Middle East and Africa Market Value (US$ Million) by Communication Type, 2022 to 2032

Figure 102: Middle East and Africa Market Value (US$ Million) by Application, 2022 to 2032

Figure 103: Middle East and Africa Market Value (US$ Million) by End User, 2022 to 2032

Figure 104: Middle East and Africa Market Value (US$ Million) by Country, 2022 to 2032

Figure 105: Middle East and Africa Market Value (US$ Million) Analysis by Country, 2017 to 2032

Figure 106: Middle East and Africa Market Value Share (%) and BPS Analysis by Country, 2022 to 2032

Figure 107: Middle East and Africa Market Y-o-Y Growth (%) Projections by Country, 2022 to 2032

Figure 108: Middle East and Africa Market Value (US$ Million) Analysis by Communication Type, 2017 to 2032

Figure 109: Middle East and Africa Market Value Share (%) and BPS Analysis by Communication Type, 2022 to 2032

Figure 110: Middle East and Africa Market Y-o-Y Growth (%) Projections by Communication Type, 2022 to 2032

Figure 111: Middle East and Africa Market Value (US$ Million) Analysis by Application, 2017 to 2032

Figure 112: Middle East and Africa Market Value Share (%) and BPS Analysis by Application, 2022 to 2032

Figure 113: Middle East and Africa Market Y-o-Y Growth (%) Projections by Application, 2022 to 2032

Figure 114: Middle East and Africa Market Value (US$ Million) Analysis by End User, 2017 to 2032

Figure 115: Middle East and Africa Market Value Share (%) and BPS Analysis by End User, 2022 to 2032

Figure 116: Middle East and Africa Market Y-o-Y Growth (%) Projections by End User, 2022 to 2032

Figure 117: Middle East and Africa Market Attractiveness by Communication Type, 2022 to 2032

Figure 118: Middle East and Africa Market Attractiveness by Application, 2022 to 2032

Figure 119: Middle East and Africa Market Attractiveness by End User, 2022 to 2032

Figure 120: Middle East and Africa Market Attractiveness by Country, 2022 to 2032

Recommendations

Technology

Hardware Asset Management Market

Published : March 2024

Technology

IT Asset Management Market

Published : May 2022

Explore Technology Insights

View Reports

Remote Asset Management Market