Methodology

Remote Valve Tissue Expanders Market Size and Share Forecast Outlook 2025 to 2035

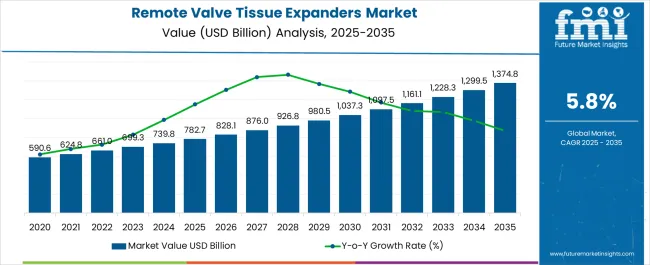
The Remote Valve Tissue Expanders Market is estimated to be valued at USD 782.7 billion in 2025 and is projected to reach USD 1374.8 billion by 2035, registering a compound annual growth rate (CAGR) of 5.8% over the forecast period.
Quick Stats for Remote Valve Tissue Expanders Market

  • Remote Valve Tissue Expanders Market Industry Value (2025): USD 782.7 billion
  • Remote Valve Tissue Expanders Market Forecast Value (2035): USD 1374.8 billion
  • Remote Valve Tissue Expanders Market Forecast CAGR: 5.8%
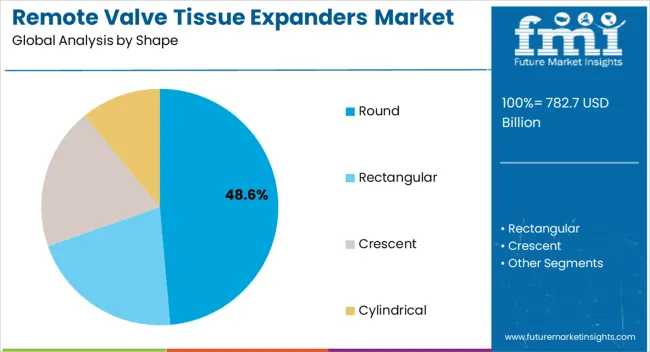
  • Leading Segment in Remote Valve Tissue Expanders Market in 2025: Round (48.6%)
  • Key Growth Region in Remote Valve Tissue Expanders Market: North America, Asia-Pacific, Europe
  • Top Key Players in Remote Valve Tissue Expanders Market: GC Aesthetics, POLYTECH Health & Aesthetics GmbH, SILIMED, Mentor Worldwide LLC (Johnson & Johnson), PMT Corporation, AirXpanders

Remote Valve Tissue Expanders Market Market Value Analysis

Metric Value
Remote Valve Tissue Expanders Market Estimated Value in (2025 E) USD 782.7 billion
Remote Valve Tissue Expanders Market Forecast Value in (2035 F) USD 1374.8 billion
Forecast CAGR (2025 to 2035) 5.8%

Rationale for Segmental Growth in the Remote Valve Tissue Expanders Market

The remote valve tissue expanders market is gaining traction as demand rises for advanced reconstructive procedures, particularly in breast reconstruction and craniofacial surgeries. Growing awareness of minimally invasive options and technological improvements in expander designs are driving adoption among both patients and healthcare providers.

The ability of remote valve systems to offer controlled expansion without frequent clinical visits has enhanced patient comfort and reduced procedural complexities. Hospitals and specialized surgical centers are increasingly incorporating these devices to improve outcomes and patient satisfaction.

Advances in biomaterials, integration with imaging technologies, and enhanced safety mechanisms are strengthening clinical confidence. The market outlook remains positive as rising prevalence of breast cancer, trauma related deformities, and congenital anomalies continues to increase the need for efficient tissue expansion solutions.
Segmental Analysis

Insights into the Round Shape Segment

Remote Valve Tissue Expanders Market Analysis By Shape

The round shape segment is expected to contribute 48.60% of the overall market by 2025, making it the leading shape category. This dominance is supported by its aesthetic advantages in creating natural contours during reconstructive procedures and its ease of surgical placement.

Surgeons prefer round expanders due to predictable outcomes, uniform stretching, and reduced risk of complications during gradual expansion. The design has been widely adopted in both breast reconstruction and cosmetic procedures, reinforcing its strong market presence.

Patient satisfaction associated with improved post operative appearance has also contributed to higher demand for round shaped expanders, consolidating their leadership within this category.
Insights into the Breast Reconstruction Application Segment

Remote Valve Tissue Expanders Market Analysis By Application

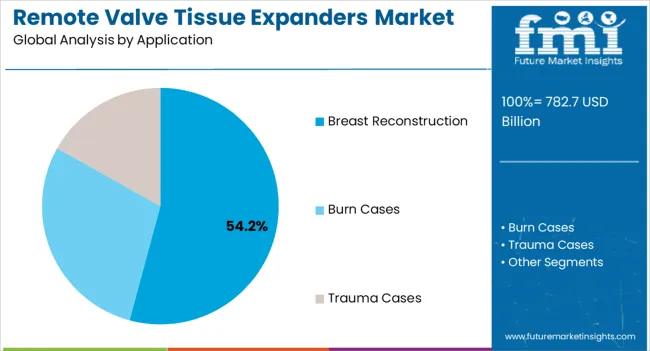
The breast reconstruction application segment is projected to account for 54.20% of total revenue in 2025, positioning it as the most prominent application area. This growth is being fueled by the rising incidence of breast cancer and the subsequent increase in mastectomy procedures, which necessitate reconstructive interventions.

Remote valve tissue expanders are particularly valued for enabling staged reconstruction with reduced clinical visits, thereby enhancing patient convenience. Supportive reimbursement frameworks, growing awareness of post mastectomy reconstruction, and ongoing clinical innovations have further encouraged adoption.

With reconstructive outcomes becoming an integral part of cancer care, this application remains the strongest growth driver in the market.
Insights into the Hospitals End User Segment

Remote Valve Tissue Expanders Market Analysis By End User

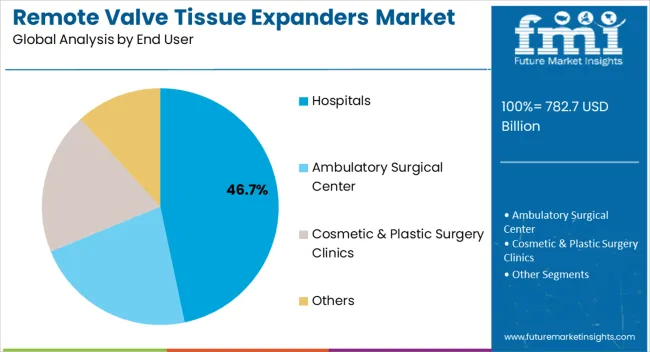
The hospitals segment is expected to hold 46.70% of total market share by 2025, making it the leading end user category. Hospitals remain the primary centers for complex reconstructive surgeries, offering the infrastructure, expertise, and post operative care necessary for tissue expansion procedures.

The availability of multidisciplinary teams and advanced surgical facilities has supported widespread adoption of remote valve tissue expanders in these settings. Increasing patient referrals, coupled with the ability to handle higher surgical volumes, has reinforced the dominance of hospitals.

Their role in driving clinical best practices and adopting advanced technologies continues to secure their leadership within the end user segment.

Comparison of Historical vs Future Outlook for Remote Valve Tissue Expanders Market (2020 to 2024 vs 2025 to 2035)

From 2020 to 2025, the global remote valve tissue expander market experienced a CAGR of 5.6%, reaching a market size of USD 782.7 million in 2025.

From 2020 to 2025, the global remote valve tissue expander market industry witnessed steady growth due to the increasing demand for reconstructive surgery.

Lung cancer is one of the top causes of cancer mortality globally. Reconstructive operations, such as breast reconstruction following mastectomy, are in high demand. As a result, the need for tissue expanders as a key technique of tissue repair has increased.

Tissue expander design, materials, and remote control capabilities have all improved over the years. These advancements have improved patient outcomes while also broadening the uses of tissue expanders.

Future Forecast for Remote Valve Tissue Expanders Market Industry:

Looking ahead, the global remote valve tissue expander market industry is expected to rise at a CAGR of 6.1% from 2025 to 2035. During the forecast period, the market size is expected to reach USD 1374.8 billion by 2035.

The remote valve tissue expander market industry is expected to continue its growth trajectory from 2025 to 2035. The popularity of less invasive surgeries is growing. Tissue expander technology improvements in the future may focus on producing smaller and less intrusive devices, minimizing patient suffering and recovery time.

Personalised medicine is fast progressing. Tissue expanders that may be tailored to particular patient demands, such as size, shape, and remote control choices, could become more common in the future, increasing market expansion.
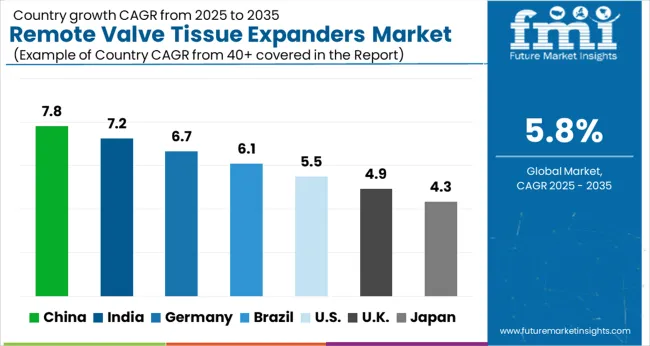
Analysis of Top Countries Manufacturing, Distributing, and Using Remote Valve Tissue Expanders

Remote Valve Tissue Expanders Market Cagr Analysis By Country

 Remote Valve Tissue Expanders Market to Surge in the United States Due to Demand for Breast Reconstruction Surgeries.

Country The United States
Market Size (USD Million) by End of Forecast Period (2035) USD 1374.8 million
CAGR % 2025 to End of Forecast (2035) 6.0%

The remote valve tissue expander market industry in the United States is expected to reach a market size of USD 1374.8 million by 2035, expanding at a CAGR of 6.0%.

Breast reconstruction operations, including tissue expansion, are becoming increasingly frequent as a result of variables such as increased breast cancer awareness and availability to reconstructive surgery. According to Breastcancer.org, more than 107,000 breast reconstruction surgeries were performed in the United States in 2020.

The increasing demand for breast reconstruction operations necessitates the use of remote valve tissue expanders, which are routinely employed in the first stage of the reconstruction process.

Rising Demand for Remote Valve Tissue Expanders Market is Due to the Regulatory Environment and Aging Population.

Country The United Kingdom
Market Size (USD Million) by End of Forecast Period (2035) USD 34.1 million
CAGR % 2025 to End of Forecast (2035) 4.1%

The remote valve tissue expander market industry in the United Kingdom is expected to reach a market value of USD 34.1 million, expanding at a CAGR of 4.1% during the forecast period.

The regulatory rules and recommendations established by agencies such as the Medicines and Healthcare products Regulatory Agency (MHRA) can have a considerable influence on the removal valve tissue expander industry in the United Kingdom.

Product availability and market access might be hampered by stringent rules and approval processes. Furthermore, the UK's ageing population may lead to a rise in demand for tissue expanders.

Notable Growth Expected in China's Remote Valve Tissue Expanders Market as Increasing Medical Tourism.

Country China
Market Size (USD Million) by End of Forecast Period (2035) USD 42.4 million
CAGR % 2025 to End of Forecast (2035) 7.1%

The remote valve tissue expander market industry in China is anticipated to reach a market size of USD 42.4 million, moving at a CAGR of 7.1% during the forecast period. The remote valve tissue expander market industry in China is expected to grow prominently due to the increasing medical tourism.

Due to its excellent healthcare facilities and cheaper treatment prices, China has become a popular destination for medical tourism. This may draw patients from other nations seeking breast reconstruction surgeries, increasing demand for removal valve tissue expanders.
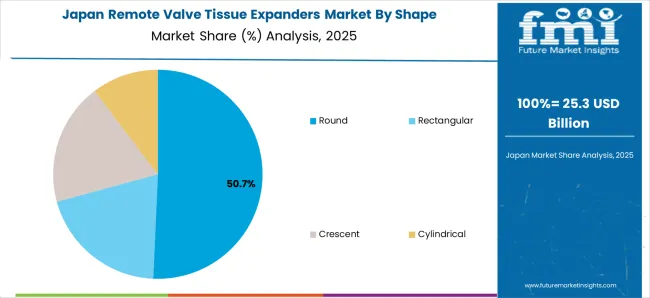
Reconstructive Surgery Culture to Drive Market Growth in Japan

Remote Valve Tissue Expanders Market Japan Market Share Analysis By Shape

Country Japan
Market Size (USD Million) by End of Forecast Period (2035) USD 21.9 million
CAGR % 2025 to End of Forecast (2035) 4.8%

The remote valve tissue expander market industry in Japan is estimated to reach a market size of USD 21.9 million by 2035, thriving at a CAGR of 4.8%. The market in Japan is predicted to grow because of its reconstructive surgery culture.

Japan has a robust reconstructive surgery culture, which includes breast reconstruction. This cultural tendency, along with rising breast cancer awareness, may drive demand for removing valve tissue expanders in the country.

Demand for Remote Valve Tissue Expanders Market is Rising Due to Growing Preference for Cosmetic Procedures.

Country South Korea
Market Size (USD Million) by End of Forecast Period (2035) USD 47.8 million
CAGR % 2025 to End of Forecast (2035) 6.5%

The remote valve tissue expander market industry in South Korea is expected to reach a market size of USD 47.8 million, expanding at a CAGR of 6.5% during the forecast period. South Korea is well-known for its technology breakthroughs and healthcare spending.

South Korea has an ageing population and a greater emphasis on healthcare. As a result, surgical treatments and post-surgical solutions such as tissue expanders are being prioritized. This may aid in the growth of the removal valve tissue expanders industry.

Remote Valve Tissue Expanders Market Analysis by Top Investment Segments

Cylindrical shape to Dominate Remote Valve Tissue Expanders Market Industry with 35.5% Market Share in 2025

The cylindrical dominated the remote valve tissue expander market industry with a market share of 35.6% in 2025. Cylindrical expanders are widely used for the tissue expansion as this shape allows for uniform stretching and growth, resulting in a more natural and aesthetically pleasing outcome.

It ensures that the expanded tissue matches the surrounding anatomy accurately. These benefits associated with the cylindrical shape, the demand is rising.

Which Application is Dominating Market?

The breast reconstruction is dominating the remote valve tissue expander market with the market share of 59.0% in 2025. The high frequency of breast cancer throughout the world accounts for the market's significant proportion of breast reconstruction. Breast reconstruction is most typically performed following breast cancer surgery to treat or prevent the disease.

Providers utilize it to shape breasts and replace damaged or missing tissue. This method can also be used to reestablish symmetry. This suggests that both breasts are designed to be the same size and shape.

Which End User Is Widely Adopted In the Market?

The hospital is dominating the remote valve tissue expander market with the market share of 46.0% in 2025. Patients commonly visit hospitals for rapid and efficient care, as the need for specialist treatments grows, fueling the segment's growth.

Furthermore, due to the global increase in breast cancer prevalence and burn cases the more people are seeking treatment and care at hospitals.
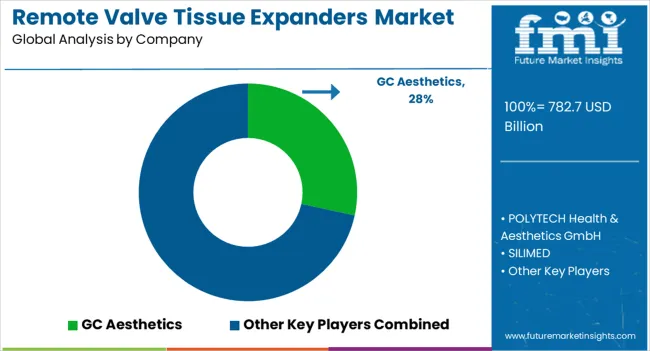
Competitive Strategies Adopted by Leading Players in the Remote Valve Tissue Expanders Market

Remote Valve Tissue Expanders Market Analysis By Company

The remote valve tissue expanders sector is fiercely competitive, with many companies fighting for market dominance. To stay ahead of the competition in such a circumstance, essential players must employ smart techniques.

Key Strategies Used by the Participants

Product Innovation

Key players focus on developing and introducing innovative products to address unmet needs in the market. They invest in research and development to improve existing formulations, delivery systems, and enhance the efficacy and safety of the products

Strategic Partnerships and Collaborations

Key players often form strategic partnerships and collaborations with other companies, research institutes, or healthcare organizations, these partnerships allow for knowledge sharing, joint research and development efforts, and access to complementary technologies or expertise.

Expansion into Emerging Markets

Key players strive to expand their presence in different geographic regions to tap into new markets and reach a wider customer base. They may establish subsidiaries, distribution networks. Or strategic alliances in various countries to strengthen their market position.

Mergers and Acquisitions

Companies in the market may engage in mergers or acquisitions to consolidate their product portfolio, acquire new technologies, these strategic moves allow companies to enter new market segments, gain access to novel products or intellectual property, and achieve synergies in terms of research, manufacturing, or distributions.

Leading Remote Valve Tissue Expanders Manufacturers and Market Share Analysis

  • GC Aesthetics®
  • POLYTECH Health & Aesthetics GmbH
  • SILIMED
  • Mentor Worldwide LLC (Johnson & Johnson)
  • PMT Corporation
  • AirXpanders

Key Developments in the Remote Valve Tissue Expanders Market:

  • In June 2025, GC Aesthetics, a privately held medical technology business, announced its development and growth ambitions for the Brazilian market.

Segmentation Analysis of the Remote Valve Tissue Expanders Market

By Shape:

  • Round
  • Rectangular
  • Crescent
  • Cylindrical

By Application:

  • Breast Reconstruction
  • Burn Cases
  • Trauma Cases

By End User:

  • Hospitals
  • Ambulatory Surgical Center
  • Cosmetic & Plastic Surgery Clinics
  • Others

By Region:

  • North America
  • Latin America
  • Europe
  • East Asia
  • South Asia
  • Oceania
  • The Middle East & Africa

Frequently Asked Questions

How big is the remote valve tissue expanders market in 2025?

The global remote valve tissue expanders market is estimated to be valued at USD 782.7 billion in 2025.

What will be the size of remote valve tissue expanders market in 2035?

The market size for the remote valve tissue expanders market is projected to reach USD 1,374.8 billion by 2035.

How much will be the remote valve tissue expanders market growth between 2025 and 2035?

The remote valve tissue expanders market is expected to grow at a 5.8% CAGR between 2025 and 2035.

What are the key product types in the remote valve tissue expanders market?

The key product types in remote valve tissue expanders market are round, rectangular, crescent and cylindrical.

Which application segment to contribute significant share in the remote valve tissue expanders market in 2025?

In terms of application, breast reconstruction segment to command 54.2% share in the remote valve tissue expanders market in 2025.

Table of Content

  1. Executive Summary
    • Global Market Outlook
    • Demand-side Trends
    • Supply-side Trends
    • Technology Roadmap Analysis
    • Analysis and Recommendations
  2. Market Overview
    • Market Coverage / Taxonomy
    • Market Definition / Scope / Limitations
  3. Market Background
    • Market Dynamics
      • Drivers
      • Restraints
      • Opportunity
      • Trends
    • Scenario Forecast
      • Demand in Optimistic Scenario
      • Demand in Likely Scenario
      • Demand in Conservative Scenario
    • Opportunity Map Analysis
    • Product Life Cycle Analysis
    • Supply Chain Analysis
    • Investment Feasibility Matrix
    • Value Chain Analysis
    • PESTLE and Porter’s Analysis
    • Regulatory Landscape
    • Regional Parent Market Outlook
    • Production and Consumption Statistics
    • Import and Export Statistics
  4. Global Market Analysis 2020 to 2024 and Forecast, 2025 to 2035
    • Historical Market Size Value (USD Million) Analysis, 2020 to 2024
    • Current and Future Market Size Value (USD Million) Projections, 2025 to 2035
      • Y-o-Y Growth Trend Analysis
      • Absolute $ Opportunity Analysis
  5. Global Market Pricing Analysis 2020 to 2024 and Forecast 2025 to 2035
  6. Global Market Analysis 2020 to 2024 and Forecast 2025 to 2035, By Shape
    • Introduction / Key Findings
    • Historical Market Size Value (USD Million) Analysis By Shape , 2020 to 2024
    • Current and Future Market Size Value (USD Million) Analysis and Forecast By Shape , 2025 to 2035
      • Round
      • Rectangular
      • Crescent
      • Cylindrical
    • Y-o-Y Growth Trend Analysis By Shape , 2020 to 2024
    • Absolute $ Opportunity Analysis By Shape , 2025 to 2035
  7. Global Market Analysis 2020 to 2024 and Forecast 2025 to 2035, By Application
    • Introduction / Key Findings
    • Historical Market Size Value (USD Million) Analysis By Application, 2020 to 2024
    • Current and Future Market Size Value (USD Million) Analysis and Forecast By Application, 2025 to 2035
      • Breast Reconstruction
      • Burn Cases
      • Trauma Cases
    • Y-o-Y Growth Trend Analysis By Application, 2020 to 2024
    • Absolute $ Opportunity Analysis By Application, 2025 to 2035
  8. Global Market Analysis 2020 to 2024 and Forecast 2025 to 2035, By End User
    • Introduction / Key Findings
    • Historical Market Size Value (USD Million) Analysis By End User, 2020 to 2024
    • Current and Future Market Size Value (USD Million) Analysis and Forecast By End User, 2025 to 2035
      • Hospitals
      • Ambulatory Surgical Center
      • Cosmetic & Plastic Surgery Clinics
      • Others
    • Y-o-Y Growth Trend Analysis By End User, 2020 to 2024
    • Absolute $ Opportunity Analysis By End User, 2025 to 2035
  9. Global Market Analysis 2020 to 2024 and Forecast 2025 to 2035, By Region
    • Introduction
    • Historical Market Size Value (USD Million) Analysis By Region, 2020 to 2024
    • Current Market Size Value (USD Million) Analysis and Forecast By Region, 2025 to 2035
      • North America
      • Latin America
      • Western Europe
      • Eastern Europe
      • East Asia
      • South Asia and Pacific
      • Middle East & Africa
    • Market Attractiveness Analysis By Region
  10. North America Market Analysis 2020 to 2024 and Forecast 2025 to 2035, By Country
    • Historical Market Size Value (USD Million) Trend Analysis By Market Taxonomy, 2020 to 2024
    • Market Size Value (USD Million) Forecast By Market Taxonomy, 2025 to 2035
      • By Country
        • USA
        • Canada
        • Mexico
      • By Shape
      • By Application
      • By End User
    • Market Attractiveness Analysis
      • By Country
      • By Shape
      • By Application
      • By End User
    • Key Takeaways
  11. Latin America Market Analysis 2020 to 2024 and Forecast 2025 to 2035, By Country
    • Historical Market Size Value (USD Million) Trend Analysis By Market Taxonomy, 2020 to 2024
    • Market Size Value (USD Million) Forecast By Market Taxonomy, 2025 to 2035
      • By Country
        • Brazil
        • Chile
        • Rest of Latin America
      • By Shape
      • By Application
      • By End User
    • Market Attractiveness Analysis
      • By Country
      • By Shape
      • By Application
      • By End User
    • Key Takeaways
  12. Western Europe Market Analysis 2020 to 2024 and Forecast 2025 to 2035, By Country
    • Historical Market Size Value (USD Million) Trend Analysis By Market Taxonomy, 2020 to 2024
    • Market Size Value (USD Million) Forecast By Market Taxonomy, 2025 to 2035
      • By Country
        • Germany
        • UK
        • Italy
        • Spain
        • France
        • Nordic
        • BENELUX
        • Rest of Western Europe
      • By Shape
      • By Application
      • By End User
    • Market Attractiveness Analysis
      • By Country
      • By Shape
      • By Application
      • By End User
    • Key Takeaways
  13. Eastern Europe Market Analysis 2020 to 2024 and Forecast 2025 to 2035, By Country
    • Historical Market Size Value (USD Million) Trend Analysis By Market Taxonomy, 2020 to 2024
    • Market Size Value (USD Million) Forecast By Market Taxonomy, 2025 to 2035
      • By Country
        • Russia
        • Poland
        • Hungary
        • Balkan & Baltic
        • Rest of Eastern Europe
      • By Shape
      • By Application
      • By End User
    • Market Attractiveness Analysis
      • By Country
      • By Shape
      • By Application
      • By End User
    • Key Takeaways
  14. East Asia Market Analysis 2020 to 2024 and Forecast 2025 to 2035, By Country
    • Historical Market Size Value (USD Million) Trend Analysis By Market Taxonomy, 2020 to 2024
    • Market Size Value (USD Million) Forecast By Market Taxonomy, 2025 to 2035
      • By Country
        • China
        • Japan
        • South Korea
      • By Shape
      • By Application
      • By End User
    • Market Attractiveness Analysis
      • By Country
      • By Shape
      • By Application
      • By End User
    • Key Takeaways
  15. South Asia and Pacific Market Analysis 2020 to 2024 and Forecast 2025 to 2035, By Country
    • Historical Market Size Value (USD Million) Trend Analysis By Market Taxonomy, 2020 to 2024
    • Market Size Value (USD Million) Forecast By Market Taxonomy, 2025 to 2035
      • By Country
        • India
        • ASEAN
        • Australia & New Zealand
        • Rest of South Asia and Pacific
      • By Shape
      • By Application
      • By End User
    • Market Attractiveness Analysis
      • By Country
      • By Shape
      • By Application
      • By End User
    • Key Takeaways
  16. Middle East & Africa Market Analysis 2020 to 2024 and Forecast 2025 to 2035, By Country
    • Historical Market Size Value (USD Million) Trend Analysis By Market Taxonomy, 2020 to 2024
    • Market Size Value (USD Million) Forecast By Market Taxonomy, 2025 to 2035
      • By Country
        • Kingdom of Saudi Arabia
        • Other GCC Countries
        • Turkiye
        • South Africa
        • Other African Union
        • Rest of Middle East & Africa
      • By Shape
      • By Application
      • By End User
    • Market Attractiveness Analysis
      • By Country
      • By Shape
      • By Application
      • By End User
    • Key Takeaways
  17. Key Countries Market Analysis
    • USA
      • Pricing Analysis
      • Market Share Analysis, 2024
        • By Shape
        • By Application
        • By End User
    • Canada
      • Pricing Analysis
      • Market Share Analysis, 2024
        • By Shape
        • By Application
        • By End User
    • Mexico
      • Pricing Analysis
      • Market Share Analysis, 2024
        • By Shape
        • By Application
        • By End User
    • Brazil
      • Pricing Analysis
      • Market Share Analysis, 2024
        • By Shape
        • By Application
        • By End User
    • Chile
      • Pricing Analysis
      • Market Share Analysis, 2024
        • By Shape
        • By Application
        • By End User
    • Germany
      • Pricing Analysis
      • Market Share Analysis, 2024
        • By Shape
        • By Application
        • By End User
    • UK
      • Pricing Analysis
      • Market Share Analysis, 2024
        • By Shape
        • By Application
        • By End User
    • Italy
      • Pricing Analysis
      • Market Share Analysis, 2024
        • By Shape
        • By Application
        • By End User
    • Spain
      • Pricing Analysis
      • Market Share Analysis, 2024
        • By Shape
        • By Application
        • By End User
    • France
      • Pricing Analysis
      • Market Share Analysis, 2024
        • By Shape
        • By Application
        • By End User
    • India
      • Pricing Analysis
      • Market Share Analysis, 2024
        • By Shape
        • By Application
        • By End User
    • ASEAN
      • Pricing Analysis
      • Market Share Analysis, 2024
        • By Shape
        • By Application
        • By End User
    • Australia & New Zealand
      • Pricing Analysis
      • Market Share Analysis, 2024
        • By Shape
        • By Application
        • By End User
    • China
      • Pricing Analysis
      • Market Share Analysis, 2024
        • By Shape
        • By Application
        • By End User
    • Japan
      • Pricing Analysis
      • Market Share Analysis, 2024
        • By Shape
        • By Application
        • By End User
    • South Korea
      • Pricing Analysis
      • Market Share Analysis, 2024
        • By Shape
        • By Application
        • By End User
    • Russia
      • Pricing Analysis
      • Market Share Analysis, 2024
        • By Shape
        • By Application
        • By End User
    • Poland
      • Pricing Analysis
      • Market Share Analysis, 2024
        • By Shape
        • By Application
        • By End User
    • Hungary
      • Pricing Analysis
      • Market Share Analysis, 2024
        • By Shape
        • By Application
        • By End User
    • Kingdom of Saudi Arabia
      • Pricing Analysis
      • Market Share Analysis, 2024
        • By Shape
        • By Application
        • By End User
    • Turkiye
      • Pricing Analysis
      • Market Share Analysis, 2024
        • By Shape
        • By Application
        • By End User
    • South Africa
      • Pricing Analysis
      • Market Share Analysis, 2024
        • By Shape
        • By Application
        • By End User
  18. Market Structure Analysis
    • Competition Dashboard
    • Competition Benchmarking
    • Market Share Analysis of Top Players
      • By Regional
      • By Shape
      • By Application
      • By End User
  19. Competition Analysis
    • Competition Deep Dive
      • GC Aesthetics
        • Overview
        • Product Portfolio
        • Profitability by Market Segments (Product/Age /Sales Channel/Region)
        • Sales Footprint
        • Strategy Overview
          • Marketing Strategy
          • Product Strategy
          • Channel Strategy
      • POLYTECH Health & Aesthetics GmbH
      • SILIMED
      • Mentor Worldwide LLC (Johnson & Johnson)
      • PMT Corporation
      • AirXpanders
  20. Assumptions & Acronyms Used
  21. Research Methodology

List of Tables

  • Table 1: Global Market Value (USD Million) Forecast by Region, 2020 to 2035
  • Table 2: Global Market Value (USD Million) Forecast by Shape , 2020 to 2035
  • Table 3: Global Market Value (USD Million) Forecast by Application, 2020 to 2035
  • Table 4: Global Market Value (USD Million) Forecast by End User, 2020 to 2035
  • Table 5: North America Market Value (USD Million) Forecast by Country, 2020 to 2035
  • Table 6: North America Market Value (USD Million) Forecast by Shape , 2020 to 2035
  • Table 7: North America Market Value (USD Million) Forecast by Application, 2020 to 2035
  • Table 8: North America Market Value (USD Million) Forecast by End User, 2020 to 2035
  • Table 9: Latin America Market Value (USD Million) Forecast by Country, 2020 to 2035
  • Table 10: Latin America Market Value (USD Million) Forecast by Shape , 2020 to 2035
  • Table 11: Latin America Market Value (USD Million) Forecast by Application, 2020 to 2035
  • Table 12: Latin America Market Value (USD Million) Forecast by End User, 2020 to 2035
  • Table 13: Western Europe Market Value (USD Million) Forecast by Country, 2020 to 2035
  • Table 14: Western Europe Market Value (USD Million) Forecast by Shape , 2020 to 2035
  • Table 15: Western Europe Market Value (USD Million) Forecast by Application, 2020 to 2035
  • Table 16: Western Europe Market Value (USD Million) Forecast by End User, 2020 to 2035
  • Table 17: Eastern Europe Market Value (USD Million) Forecast by Country, 2020 to 2035
  • Table 18: Eastern Europe Market Value (USD Million) Forecast by Shape , 2020 to 2035
  • Table 19: Eastern Europe Market Value (USD Million) Forecast by Application, 2020 to 2035
  • Table 20: Eastern Europe Market Value (USD Million) Forecast by End User, 2020 to 2035
  • Table 21: East Asia Market Value (USD Million) Forecast by Country, 2020 to 2035
  • Table 22: East Asia Market Value (USD Million) Forecast by Shape , 2020 to 2035
  • Table 23: East Asia Market Value (USD Million) Forecast by Application, 2020 to 2035
  • Table 24: East Asia Market Value (USD Million) Forecast by End User, 2020 to 2035
  • Table 25: South Asia and Pacific Market Value (USD Million) Forecast by Country, 2020 to 2035
  • Table 26: South Asia and Pacific Market Value (USD Million) Forecast by Shape , 2020 to 2035
  • Table 27: South Asia and Pacific Market Value (USD Million) Forecast by Application, 2020 to 2035
  • Table 28: South Asia and Pacific Market Value (USD Million) Forecast by End User, 2020 to 2035
  • Table 29: Middle East & Africa Market Value (USD Million) Forecast by Country, 2020 to 2035
  • Table 30: Middle East & Africa Market Value (USD Million) Forecast by Shape , 2020 to 2035
  • Table 31: Middle East & Africa Market Value (USD Million) Forecast by Application, 2020 to 2035
  • Table 32: Middle East & Africa Market Value (USD Million) Forecast by End User, 2020 to 2035

List of Figures

  • Figure 1: Global Market Pricing Analysis
  • Figure 2: Global Market Value (USD Million) Forecast 2020 to 2035
  • Figure 3: Global Market Value Share and BPS Analysis by Shape , 2025 and 2035
  • Figure 4: Global Market Y-o-Y Growth Comparison by Shape , 2025 to 2035
  • Figure 5: Global Market Attractiveness Analysis by Shape
  • Figure 6: Global Market Value Share and BPS Analysis by Application, 2025 and 2035
  • Figure 7: Global Market Y-o-Y Growth Comparison by Application, 2025 to 2035
  • Figure 8: Global Market Attractiveness Analysis by Application
  • Figure 9: Global Market Value Share and BPS Analysis by End User, 2025 and 2035
  • Figure 10: Global Market Y-o-Y Growth Comparison by End User, 2025 to 2035
  • Figure 11: Global Market Attractiveness Analysis by End User
  • Figure 12: Global Market Value (USD Million) Share and BPS Analysis by Region, 2025 and 2035
  • Figure 13: Global Market Y-o-Y Growth Comparison by Region, 2025 to 2035
  • Figure 14: Global Market Attractiveness Analysis by Region
  • Figure 15: North America Market Incremental Dollar Opportunity, 2025 to 2035
  • Figure 16: Latin America Market Incremental Dollar Opportunity, 2025 to 2035
  • Figure 17: Western Europe Market Incremental Dollar Opportunity, 2025 to 2035
  • Figure 18: Eastern Europe Market Incremental Dollar Opportunity, 2025 to 2035
  • Figure 19: East Asia Market Incremental Dollar Opportunity, 2025 to 2035
  • Figure 20: South Asia and Pacific Market Incremental Dollar Opportunity, 2025 to 2035
  • Figure 21: Middle East & Africa Market Incremental Dollar Opportunity, 2025 to 2035
  • Figure 22: North America Market Value Share and BPS Analysis by Country, 2025 and 2035
  • Figure 23: North America Market Value Share and BPS Analysis by Shape , 2025 and 2035
  • Figure 24: North America Market Y-o-Y Growth Comparison by Shape , 2025 to 2035
  • Figure 25: North America Market Attractiveness Analysis by Shape
  • Figure 26: North America Market Value Share and BPS Analysis by Application, 2025 and 2035
  • Figure 27: North America Market Y-o-Y Growth Comparison by Application, 2025 to 2035
  • Figure 28: North America Market Attractiveness Analysis by Application
  • Figure 29: North America Market Value Share and BPS Analysis by End User, 2025 and 2035
  • Figure 30: North America Market Y-o-Y Growth Comparison by End User, 2025 to 2035
  • Figure 31: North America Market Attractiveness Analysis by End User
  • Figure 32: Latin America Market Value Share and BPS Analysis by Country, 2025 and 2035
  • Figure 33: Latin America Market Value Share and BPS Analysis by Shape , 2025 and 2035
  • Figure 34: Latin America Market Y-o-Y Growth Comparison by Shape , 2025 to 2035
  • Figure 35: Latin America Market Attractiveness Analysis by Shape
  • Figure 36: Latin America Market Value Share and BPS Analysis by Application, 2025 and 2035
  • Figure 37: Latin America Market Y-o-Y Growth Comparison by Application, 2025 to 2035
  • Figure 38: Latin America Market Attractiveness Analysis by Application
  • Figure 39: Latin America Market Value Share and BPS Analysis by End User, 2025 and 2035
  • Figure 40: Latin America Market Y-o-Y Growth Comparison by End User, 2025 to 2035
  • Figure 41: Latin America Market Attractiveness Analysis by End User
  • Figure 42: Western Europe Market Value Share and BPS Analysis by Country, 2025 and 2035
  • Figure 43: Western Europe Market Value Share and BPS Analysis by Shape , 2025 and 2035
  • Figure 44: Western Europe Market Y-o-Y Growth Comparison by Shape , 2025 to 2035
  • Figure 45: Western Europe Market Attractiveness Analysis by Shape
  • Figure 46: Western Europe Market Value Share and BPS Analysis by Application, 2025 and 2035
  • Figure 47: Western Europe Market Y-o-Y Growth Comparison by Application, 2025 to 2035
  • Figure 48: Western Europe Market Attractiveness Analysis by Application
  • Figure 49: Western Europe Market Value Share and BPS Analysis by End User, 2025 and 2035
  • Figure 50: Western Europe Market Y-o-Y Growth Comparison by End User, 2025 to 2035
  • Figure 51: Western Europe Market Attractiveness Analysis by End User
  • Figure 52: Eastern Europe Market Value Share and BPS Analysis by Country, 2025 and 2035
  • Figure 53: Eastern Europe Market Value Share and BPS Analysis by Shape , 2025 and 2035
  • Figure 54: Eastern Europe Market Y-o-Y Growth Comparison by Shape , 2025 to 2035
  • Figure 55: Eastern Europe Market Attractiveness Analysis by Shape
  • Figure 56: Eastern Europe Market Value Share and BPS Analysis by Application, 2025 and 2035
  • Figure 57: Eastern Europe Market Y-o-Y Growth Comparison by Application, 2025 to 2035
  • Figure 58: Eastern Europe Market Attractiveness Analysis by Application
  • Figure 59: Eastern Europe Market Value Share and BPS Analysis by End User, 2025 and 2035
  • Figure 60: Eastern Europe Market Y-o-Y Growth Comparison by End User, 2025 to 2035
  • Figure 61: Eastern Europe Market Attractiveness Analysis by End User
  • Figure 62: East Asia Market Value Share and BPS Analysis by Country, 2025 and 2035
  • Figure 63: East Asia Market Value Share and BPS Analysis by Shape , 2025 and 2035
  • Figure 64: East Asia Market Y-o-Y Growth Comparison by Shape , 2025 to 2035
  • Figure 65: East Asia Market Attractiveness Analysis by Shape
  • Figure 66: East Asia Market Value Share and BPS Analysis by Application, 2025 and 2035
  • Figure 67: East Asia Market Y-o-Y Growth Comparison by Application, 2025 to 2035
  • Figure 68: East Asia Market Attractiveness Analysis by Application
  • Figure 69: East Asia Market Value Share and BPS Analysis by End User, 2025 and 2035
  • Figure 70: East Asia Market Y-o-Y Growth Comparison by End User, 2025 to 2035
  • Figure 71: East Asia Market Attractiveness Analysis by End User
  • Figure 72: South Asia and Pacific Market Value Share and BPS Analysis by Country, 2025 and 2035
  • Figure 73: South Asia and Pacific Market Value Share and BPS Analysis by Shape , 2025 and 2035
  • Figure 74: South Asia and Pacific Market Y-o-Y Growth Comparison by Shape , 2025 to 2035
  • Figure 75: South Asia and Pacific Market Attractiveness Analysis by Shape
  • Figure 76: South Asia and Pacific Market Value Share and BPS Analysis by Application, 2025 and 2035
  • Figure 77: South Asia and Pacific Market Y-o-Y Growth Comparison by Application, 2025 to 2035
  • Figure 78: South Asia and Pacific Market Attractiveness Analysis by Application
  • Figure 79: South Asia and Pacific Market Value Share and BPS Analysis by End User, 2025 and 2035
  • Figure 80: South Asia and Pacific Market Y-o-Y Growth Comparison by End User, 2025 to 2035
  • Figure 81: South Asia and Pacific Market Attractiveness Analysis by End User
  • Figure 82: Middle East & Africa Market Value Share and BPS Analysis by Country, 2025 and 2035
  • Figure 83: Middle East & Africa Market Value Share and BPS Analysis by Shape , 2025 and 2035
  • Figure 84: Middle East & Africa Market Y-o-Y Growth Comparison by Shape , 2025 to 2035
  • Figure 85: Middle East & Africa Market Attractiveness Analysis by Shape
  • Figure 86: Middle East & Africa Market Value Share and BPS Analysis by Application, 2025 and 2035
  • Figure 87: Middle East & Africa Market Y-o-Y Growth Comparison by Application, 2025 to 2035
  • Figure 88: Middle East & Africa Market Attractiveness Analysis by Application
  • Figure 89: Middle East & Africa Market Value Share and BPS Analysis by End User, 2025 and 2035
  • Figure 90: Middle East & Africa Market Y-o-Y Growth Comparison by End User, 2025 to 2035
  • Figure 91: Middle East & Africa Market Attractiveness Analysis by End User
  • Figure 92: Global Market – Tier Structure Analysis
  • Figure 93: Global Market – Company Share Analysis
Dashboard
Dashboard
Dashboard
Dashboard
Dashboard
Dashboard

Our Research Products

Full Research Suite

The "Full Research Suite" delivers actionable market intel, deep dives on markets or technologies, so clients act faster, cut risk, and unlock growth.

Competitor Leaderboard Report

The Leaderboard benchmarks and ranks top vendors, classifying them as Established Leaders, Leading Challengers, or Disruptors & Challengers.

Future Leaders Index

Locates where complements amplify value and substitutes erode it, forecasting net impact by horizon

Market Data & Forecasts

We deliver granular, decision-grade intel: market sizing, 5-year forecasts, pricing, adoption, usage, revenue, and operational KPIs—plus competitor tracking, regulation, and value chains—across 60 countries broadly.

Market Focus Report

Spot the shifts before they hit your P&L. We track inflection points, adoption curves, pricing moves, and ecosystem plays to show where demand is heading, why it is changing, and what to do next across high-growth markets and disruptive tech

Survey Report

Real-time reads of user behavior. We track shifting priorities, perceptions of today’s and next-gen services, and provider experience, then pace how fast tech moves from trial to adoption, blending buyer, consumer, and channel inputs with social signals (#WhySwitch, #UX).

Bespoke Reports

Partner with our analyst team to build a custom report designed around your business priorities. From analysing market trends to assessing competitors or crafting bespoke datasets, we tailor insights to your needs.

Supplier Intelligence

Discovery & Profiling

Capacity & Footprint

Performance & Risk

Compliance & Governance

Commercial Readiness

Who Supplies Whom

Scorecards & Shortlists

Playbooks & Docs

Category Intelligence

Definition & Scope

Demand & Use Cases

Cost Drivers

Market Structure

Supply Chain Map

Trade & Policy

Operating Norms

Deliverables

Buyer Intelligence

Account Basics

Spend & Scope

Procurement Model

Vendor Requirements

Terms & Policies

Entry Strategy

Pain Points & Triggers

Outputs

Pricing Analysis

Benchmarks

Trends

Should-Cost

Indexation

Landed Cost

Commercial Terms

Deliverables

Brand Analysis

Positioning & Value Prop

Share & Presence

Customer Evidence

Go-to-Market

Digital & Reputation

Compliance & Trust

KPIs & Gaps

Outputs

Full Research Suite comprises of:

Market outlook & trends analysis

Market outlook & trends analysis

Interviews & case studies

Interviews & case studies

Strategic recommendations

Strategic recommendations

Vendor profiles & capabilities analysis

Vendor profiles & capabilities analysis

5-year forecasts

5-year forecasts

8 regions and 60+ country-level data splits

8 regions and 60+ country-level data splits

Market segment data splits

Market segment data splits

12 months of continuous data updates

12 months of continuous data updates

DELIVERED AS:

PDF EXCEL ONLINE

Full Research Suite


$5000

$7500

$10000

Buy Report Now
Similar Industry Reports

Similar Industry Reports

Remote ICU Monitoring System Market

Remote ICU Monitoring System Market Size and Share Forecast Outlook 2025 to 2035

Remote Lockout Tool Market

Remote Lockout Tool Market Size and Share Forecast Outlook 2025 to 2035

Remote Desktop Software Market

Remote Desktop Software Market Forecast and Outlook 2025 to 2035

Remote Patient Monitoring Devices Market

Remote Patient Monitoring Devices Market Size and Share Forecast Outlook 2025 to 2035

Remote Assist Headrest Market

Remote Assist Headrest Market Size and Share Forecast Outlook 2025 to 2035

Remote Endarterectomy Devices Market

Remote Endarterectomy Devices Market Size and Share Forecast Outlook 2025 to 2035

Remote Electrocardiogram Monitoring Market

Remote Electrocardiogram Monitoring Market Size and Share Forecast Outlook 2025 to 2035

Remote Patient Monitoring System Market

Remote Patient Monitoring System Market Size and Share Forecast Outlook 2025 to 2035

Remote Imaging Collaboration Market

Remote Imaging Collaboration Market Analysis - Size, Share, and Forecast Outlook 2025 to 2035

Remote Operated Vehicle Market

Remote Operated Vehicle Market Size and Share Forecast Outlook 2025 to 2035

Remote DC Microgrid Market

Remote DC Microgrid Market Size and Share Forecast Outlook 2025 to 2035

Remote Microgrid Market

Remote Microgrid Market Size and Share Forecast Outlook 2025 to 2035

Remote Towers Market

Remote Towers Market Size and Share Forecast Outlook 2025 to 2035

Remote AF Detection Tools Market

Remote AF Detection Tools Market Analysis Size and Share Forecast Outlook 2025 to 2035

Remote Vehicle Diagnostics Market

Remote Vehicle Diagnostics Market Size and Share Forecast Outlook 2025 to 2035

Remote Home Monitoring Systems Market

Remote Home Monitoring Systems Market Size and Share Forecast Outlook 2025 to 2035

Remote Asset Management Market

Remote Asset Management Market Size and Share Forecast Outlook 2025 to 2035

Remote Learning Technology Spending Market

Remote Learning Technology Spending Market Analysis by Technology Software, Technology Services, Learning Mode, End User and Region Through 2025 to 2035

Remote Sensing Services Market

Remote Sensing Services Market Trends - Growth & Forecast 2025 to 2035

Remote Cooled Cube Ice Machines Market

Remote Cooled Cube Ice Machines Market – Advanced Refrigeration & Industry Growth 2025 to 2035

Future Market Insights

Remote Valve Tissue Expanders Market

Chat With MaRIA

Chat With

MaRIA

Hi There, I am MaRIA, Your Market Research Intelligence Assistant. How may I help you?