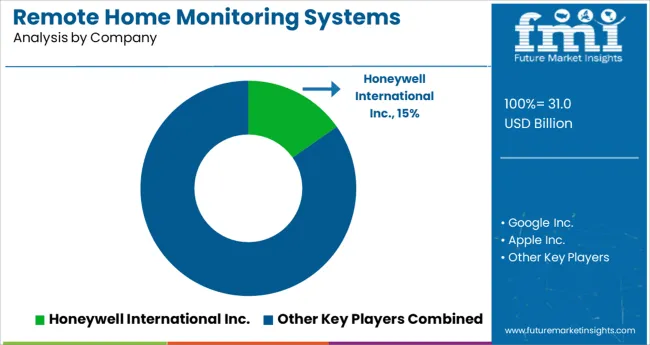
The Remote Home Monitoring Systems Market is estimated to be valued at USD 31.0 billion in 2025 and is projected to reach USD 126.6 billion by 2035, registering a compound annual growth rate (CAGR) of 15.1% over the forecast period.
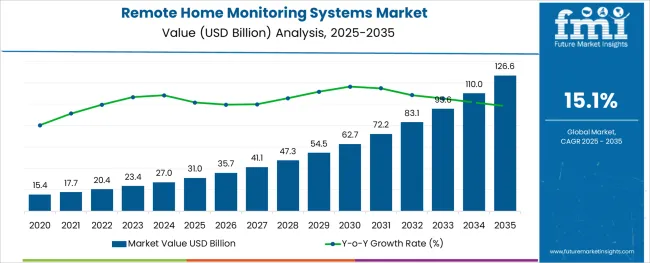
The remote home monitoring systems market is undergoing a significant transformation, fueled by heightened consumer focus on home safety, energy management, and convenience through smart technologies. Growing urbanization and rising security concerns have accelerated the adoption of connected devices that provide real-time monitoring, threat detection, and control from remote locations.
Manufacturers are embedding AI-driven analytics, voice assistant integration, and advanced encryption protocols to enhance system performance and user experience. Insurance incentives for smart security installations and increasing acceptance of do-it-yourself home monitoring kits are also expanding market penetration.
Seamless interoperability between sensors, locks, cameras, and mobile platforms is shaping product development, with cross-device integration becoming a standard requirement. The convergence of 5G, cloud computing, and IoT infrastructure is expected to further scale adoption, enabling more intelligent, responsive, and cost-effective home monitoring ecosystems across both developed and emerging markets.
The market is segmented by Sensor Type, Product, Platform, and Operating System and region. By Sensor Type, the market is divided into Motion sensors, Water sensors, Glass sensors, Door Sensors, Environmental Sensors, and Others. In terms of Product, the market is classified into Electronic and smart locks, Alarms, Security cameras, Security Solutions, DIY home security, Sensors, Detectors, and Others.
Based on Platform, the market is segmented into Mobile and Desktop. By Operating System, the market is divided into Android, iOS, and Windows. Regionally, the market is classified into North America, Latin America, Western Europe, Eastern Europe, Balkan & Baltic Countries, Russia & Belarus, Central Asia, East Asia, South Asia & Pacific, and the Middle East & Africa.
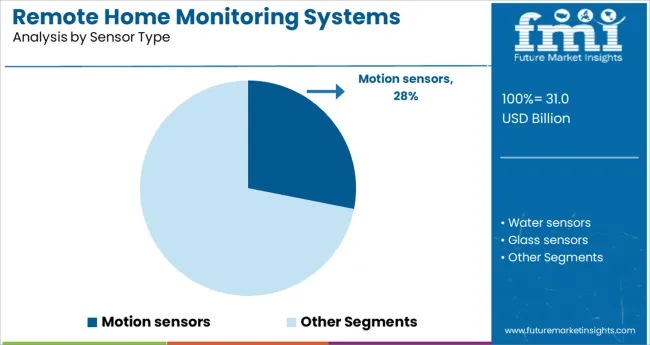
Motion sensors are projected to contribute 28.1% of total revenue in 2025 under the sensor type category, making them the leading segment. This dominance has been driven by the essential role of motion detection in identifying unauthorized entry and triggering automated alerts or defensive responses.
Advancements in passive infrared and microwave dual-technology sensors have improved detection accuracy and minimized false alarms, encouraging broader residential adoption. These sensors are now increasingly embedded into multi-function security devices that combine surveillance, lighting control, and alarm systems.
Their ability to operate continuously and integrate with cloud-connected platforms has enhanced reliability and made them indispensable in modern security architectures. As affordability improves and smart home deployments increase, motion sensors are expected to remain a foundational element within the broader remote monitoring ecosystem.
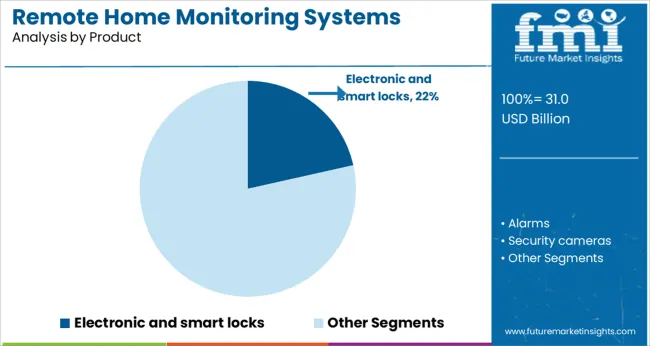
Electronic and smart locks are anticipated to hold 21.5% of market revenue in 2025 within the product category, establishing them as a key component of smart home security infrastructure. This growth has been attributed to the rising demand for remote access control, keyless entry, and real-time door status monitoring.
These locks enhance convenience while significantly improving safety, especially when integrated with motion sensors, video doorbells, and alarm systems. Biometric authentication, mobile app control, and temporary digital keys have become standard features in smart locks, aligning with consumer expectations for flexibility and personalization.
As adoption increases among renters, homeowners, and property managers alike, electronic and smart locks are solidifying their role as critical access control tools in both single-dwelling and multi-unit residences. Continuous innovation in tamper resistance and battery life is expected to support sustained market share in the coming years.
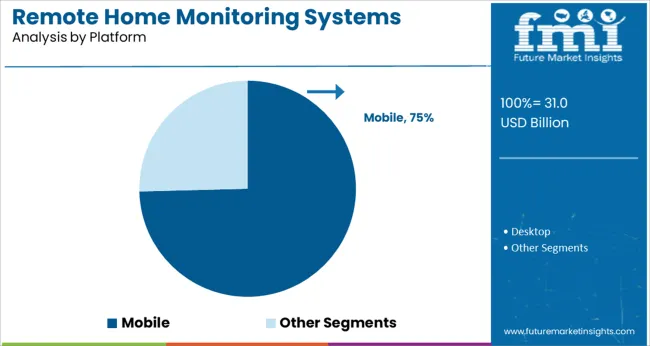
Mobile platforms are forecast to account for 74.6% of total revenue in 2025, making them the most widely used interface in the remote home monitoring systems market. This leadership is the result of increasing consumer reliance on smartphones for centralized control of security devices, alerts, and automation routines.
Mobile apps offer real-time monitoring, geofencing, voice control integration, and event-based notifications, all of which enhance user engagement and responsiveness. The proliferation of high-speed mobile internet, combined with intuitive app design, has accelerated adoption across all demographics.
Additionally, security system providers are prioritizing mobile-first development strategies, offering features like live camera feeds, remote lock management, and activity logs within a single interface. The convenience, portability, and ubiquity of mobile devices are expected to ensure continued dominance of this platform segment well into the forecast period.
Healthcare access for the aging population is becoming increasingly important as the elderly population continues to grow. This is the leading driver for the sales of remote home monitoring systems.
Increased demand for healthcare and long-term care services will put a significant strain on governments and healthcare systems as the elderly population grows. This is good news for the remote home monitoring systems market. Hospital admissions and readmissions can be reduced by the adoption of remote home monitoring systems to reduce the time and expense of traveling to meet healthcare professionals.
It is extremely difficult to treat infectious diseases in hospitals due to the high risk of infection for both patients and healthcare providers. With its inherent advantages, such as early disease detection and virtual visits, telemedicine has the potential to limit the spread of epidemics and healthcare-associated infections.
In terms of the number of in-person visits and travel involved in the treatment process, it's certainly a big help. As a result, infectious diseases are less likely to spread as a result. Thus, the adoption of remote home monitoring systems is rising on a global level.
The ability to monitor clinically important data before and after surgery, identify symptoms, and prevent complications made the special monitors segment the market leader in the remote home monitoring systems market in 2024, with a revenue share of over 83.8%.
Products with wireless communication and iPad compatibility can be diagnosed and used more quickly. The ECG, non-invasive blood pressure, body temperature, respiration rate, and brain activity can all be monitored with vital sign monitors. When multiple vital sign monitors are combined in one system, the popularity of these products is expected to rise significantly.
The diabetes segment of the remote home monitoring systems market accounted for 12.8% of revenue in 2024. Diabetes, a primary cause of death, demands constant blood glucose monitoring.
It affects the heart, eyesight, liver, and kidneys. Continuous and routine monitoring is needed, and remote patient monitoring equipment can help. Around 425 million people worldwide have diabetes, according to the IDF. By 2040, 642 million are projected. As diabetes becomes more common, insulin infusion pumps help people self-administer insulin.
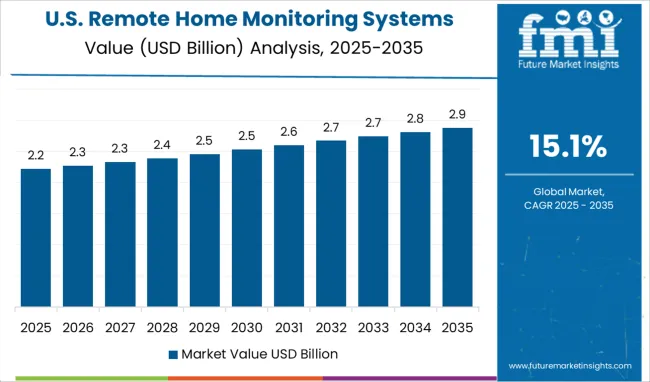
North America held 41.6% of the remote home monitoring systems market in 2024. Increased chronic disease incidence, the need for wireless and portable systems, and complex reimbursement schemes to reduce out-of-pocket costs are driving regional expansion.
Increasing Research and Development for sensor-based patient monitoring systems further drives the regional demand for remote home monitoring systems. Most significant market players are headquartered in the region, which boosts the remote home monitoring systems market growth.
Due to the increased mortality rate and rising desire for low-cost treatment, Europe is likely to be the second most lucrative region over the forecast period. The rising need for in-house monitoring, supportive central data management systems, and increasing accuracy and efficiency of remote patient monitors are significant growth drivers for the region.
Due to the presence of unexplored potential in India and China's rising remote home monitoring systems markets, Asia-Pacific is anticipated to have the highest CAGR throughout the projection period. Japan is anticipated to be an important revenue producer in the remote home monitoring systems market due to its large elderly population (65+).
The primary trend in the remote home monitoring systems market is the improvement of currently available technologies, the introduction of new products, the expansion of product portfolios, and mergers or strategic alliances with healthcare facilities.
The remote home monitoring systems market is highly fragmented on a global scale, with the majority of the world's manufacturers originating in industrialized nations. A varied product portfolio of digital platforms, as well as constant developments made by the companies that provide remote patient monitoring, which ultimately leads to the introduction of new goods, are important and major aspects that contribute to the robust presence of the companies.
The report consists of key players contributing to the remote home monitoring systems market share. It also consists of organic and inorganic growth strategies adopted by market players to improve their market positions. This exclusive report analyzes the competitive landscape and remote home monitoring systems market share acquired by players to strengthen their market position.
BioTelemetry, Inc. was bought by Philips in February 2024. Philips expects that the addition of cardiac diagnostics and monitoring equipment from BioTelemetry will help expand its patient monitoring portfolio. Players are also looking to expand their manufacturing operations into nations with large populations and significant disease loads.
A new Research and Development facility in China will be expanded by Mindray in June 2024, the company revealed in a statement. Medical equipment systems Research and Development, manufacture, and operation will all be housed in one convenient location at this complex.
In order to digitally alter the systems in middle- and lower-income countries, a strong focus on partnerships and acquisition methods is predicted to attract high customers and increase market revenue in the coming years. Patients and healthcare providers will soon be able to monitor their health remotely thanks to a partnership between Rx. Health and LiveCare.
New innovations are dominating the remote home monitoring systems market, with both new and old players resorting to new technology for more diversified and comprehensive market growth.
100 Plus made the announcement in April 2024 that they would be releasing three new RPM devices. These devices were the 100 Plus blood pressure cuff, the digital weight scale, and the Blood glucose monitor.
In October of 2024, Medtronic introduced the AzureTM pacemaker, which was the first device of its kind in the world to be equipped with BlueSyncTM technology, allowing it to interact directly with patients' smartphones and tablets.
| Report Attribute | Details |
|---|---|
| Growth rate | CAGR of 15.1% from 2025 to 2035 |
| The base year for estimation | 2024 |
| Historical data | 2020 to 2024 |
| Forecast period | 2025 to 2035 |
| Quantitative units | Revenue in USD million and CAGR from 2025 to 2035 |
| Report Coverage | Revenue forecast, volume forecast, company ranking, competitive landscape, growth factors, and trends, Pricing Analysis |
| Segments Covered | Sensor, Product, Platform, Operating System Region |
| Regional scope | North America; Western Europe, Eastern Europe, Middle East, Africa, ASEAN, South Asia, Rest of Asia, Australia, and New Zealand |
| Country scope | United States of America, Canada, Mexico, Germany, United Kingdom, France, Italy, Spain, Russia, Belgium, Poland, Czech Republic, China, India, Japan, Australia, Brazil, Argentina, Colombia, Saudi Arabia, UAE, Iran, South Africa |
| Key companies profiled | Honeywell International Inc.; Ooma; Inc.; IBM Corporation; SimpliSafe; Inc.; General Electric Company; Bosch Security Systems; Inc.; Schneider Electric S.E.; Tyco International Ltd; Nortek Security & Control; LLC.; Control4 Corporation; Apple Inc.; Google Inc.; Samsung Electronics Co. Ltd; Visonic Limited; Siemens Corporation; and LOREX Technology Inc. |
| Customization scope | Free report customization (equivalent to up to 8 analysts' working days) with purchase. Addition or alteration to country, regional & segment scope. |
| Pricing and purchase options | Avail customized purchase options to meet your exact research needs. |
The global remote home monitoring systems market is estimated to be valued at USD 31.0 billion in 2025.
It is projected to reach USD 126.6 billion by 2035.
The market is expected to grow at a 15.1% CAGR between 2025 and 2035.
The key product types are motion sensors, water sensors, glass sensors, door sensors, environmental sensors and others.
electronic and smart locks segment is expected to dominate with a 21.5% industry share in 2025.


Full Research Suite comprises of:
Market outlook & trends analysis
Interviews & case studies
Strategic recommendations
Vendor profiles & capabilities analysis
5-year forecasts
8 regions and 60+ country-level data splits
Market segment data splits
12 months of continuous data updates
DELIVERED AS:
PDF EXCEL ONLINE
Remote Lockout Tool Market Size and Share Forecast Outlook 2025 to 2035
Remote Desktop Software Market Forecast and Outlook 2025 to 2035
Remote Assist Headrest Market Size and Share Forecast Outlook 2025 to 2035
Remote Endarterectomy Devices Market Size and Share Forecast Outlook 2025 to 2035
Remote Valve Tissue Expanders Market Size and Share Forecast Outlook 2025 to 2035
Remote Imaging Collaboration Market Analysis - Size, Share, and Forecast Outlook 2025 to 2035
Remote Operated Vehicle Market Size and Share Forecast Outlook 2025 to 2035
Remote DC Microgrid Market Size and Share Forecast Outlook 2025 to 2035
Remote Microgrid Market Size and Share Forecast Outlook 2025 to 2035
Remote Towers Market Size and Share Forecast Outlook 2025 to 2035
Remote AF Detection Tools Market Analysis Size and Share Forecast Outlook 2025 to 2035
Remote Vehicle Diagnostics Market Size and Share Forecast Outlook 2025 to 2035
Remote Asset Management Market Size and Share Forecast Outlook 2025 to 2035
Remote Learning Technology Spending Market Analysis by Technology Software, Technology Services, Learning Mode, End User and Region Through 2025 to 2035
Remote Sensing Services Market Trends - Growth & Forecast 2025 to 2035
Remote Cooled Cube Ice Machines Market – Advanced Refrigeration & Industry Growth 2025 to 2035
Remote Healthcare Market - Growth & Innovations 2025 to 2035
Remote Construction Market Analysis by Component, Application, End-use Industry and Region Through 2035
Remote Plasma Source Market
Remote Magnetic Catheter Systems Market

Thank you!
You will receive an email from our Business Development Manager. Please be sure to check your SPAM/JUNK folder too.
Chat With
MaRIA