AR Remote Maintenance Tools Market Size and Share Forecast Outlook 2025 to 2035

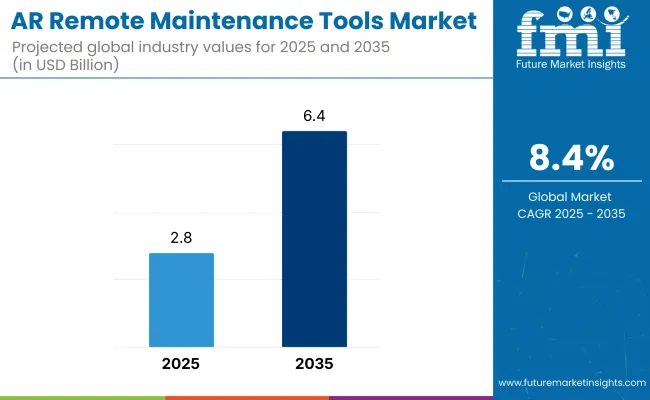
The AR remote maintenance tools market is expected to grow from USD 2.8 billion in 2025 to USD 6.4 billion by 2035, resulting in a total increase of USD 3.6 billion over the forecast decade. This represents a 128.6% total expansion, with the market advancing at a compound annual growth rate (CAGR) of 8.4%. Over ten years, the market grows by a 2.3 multiple.
Quick Stats for AR Remote Maintenance Tools Market

  • Market Value (2025): USD 2.8 billion
  • Market Forecast Value (2035): USD 6.4 billion
  • Market Forecast CAGR: 8.4%
  • Leading Segment in 2025: Smart glasses (41.7%)
  • Key Growth Regions: Asia-Pacific (South Korea is the fastest-growing market with 9.5% CAGR)
  • Top Key Players: PTC, Eon Reality, ZOHO, CareAR, VSight, Mitsubishi Electric - M’s BRIDGE™, LG CNS, ABB, Taqtile, Acty.

Ar Remote Maintenance Tool Market

Metric Value
Industry Size (2025E) USD 2.8 billion
Industry Value (2035F) USD 6.4 billion
CAGR (2025 to 2035) 8.4%

In the first five years (2025-2030), the market progresses from USD 2.8 billion to USD 4.2 billion, contributing USD 1.4 billion, or 38.9% of total decade growth. This phase is shaped by manufacturing, energy, and aerospace sectors adopting AR for real-time equipment troubleshooting and training. High demand is driven by reduced downtime, lower travel costs, and improved technician productivity.

In the second half (2030-2035), the market grows from USD 4.2 billion to USD 6.4 billion, adding USD 2.2 billion, or 61.1% of the total growth. This acceleration is supported by integration with AI-driven diagnostics, IoT connectivity, and wearable AR headsets with enhanced field-of-view. Expansion into emerging markets and increased 5G coverage further enable instant, high-quality remote support, solidifying AR tools in industrial maintenance strategies.

From 2020 to 2024, the AR remote maintenance tools market expanded from USD 2.1 billion to USD 2.6 billion, fueled by industrial digitalization, equipment uptime optimization, and skilled labor shortages. Over 70% of revenue came from OEM-led platforms embedded into machinery servicing ecosystems. Market leaders such as PTC, TeamViewer, and Scope AR emphasized real-time 3D visualization, IoT sensor integration, and secure remote access.

Differentiation focused on precision overlay accuracy, latency reduction, and cross-device compatibility, while advanced AI-based diagnostics were secondary add-ons. Service models tied to predictive maintenance contracts accounted for less than 20% of revenue, with most enterprises investing in capital deployments for long-term operational control.

By 2035, the AR remote maintenance tools market will reach USD 6.4 billion, growing at a CAGR of 8.4%, with software-driven capabilities accounting for more than 40% of total value. Competitive momentum will shift toward integrated solution providers offering AI-guided repair workflows, digital twin synchronization, and immersive multi-user collaboration.

Established players are adapting to hybrid models with subscription-based AR servicing, continuous cloud updates, and edge AI for instant failure detection. New entrants such as Librestream, RE’FLEKT, and XMReality are gaining traction through modular deployment options, enhanced cybersecurity features, and industry-specific AR content libraries tailored for sectors like aerospace, energy, and advanced manufacturing.

Why the AR Remote Maintenance Tools Market is growing?

The increasing need for real-time technical support, reduced downtime, and cost-efficient maintenance is driving growth in the AR remote maintenance tools market. These solutions enable technicians to receive expert guidance through augmented reality interfaces, improving accuracy and speed. Adoption is rising across manufacturing, energy, automotive, and aerospace sectors due to global skilled labour shortages.

Tools integrating hands-free AR headsets, IoT-enabled diagnostics, and cloud-based collaboration are gaining traction for their ability to provide instant problem-solving without travel. Features like remote annotations, 3D overlays, and step-by-step guidance enhance operational efficiency. Compatibility with existing enterprise systems and sustainability benefits from reduced carbon footprints further boost their appeal in industrial and field service applications.

Segmental Analysis

The market is segmented by device type, functionality, deployment type, application, end-use industry, and region. Device type segmentation includes smart glasses, tablet/phone interfaces, head-mounted displays (HMDs), and wearables, each enhancing hands-free access to maintenance instructions. Functionality covers real-time video support, AR overlay manuals, remote diagnostics, and IoT integration, streamlining operational efficiency and minimizing downtime. Deployment type includes cloud-based and on premise models, catering to varied data security and accessibility needs.

Applications include packaging line troubleshooting, machine setup, and remote operator training, enabling rapid skill transfer and reduced service delays. End-use industries include food packaging, pharma lines, industrial equipment, aerospace, and automotive. Regionally, the market is segmented into North America, Europe, Asia-Pacific, Latin America, and the Middle East & Africa.
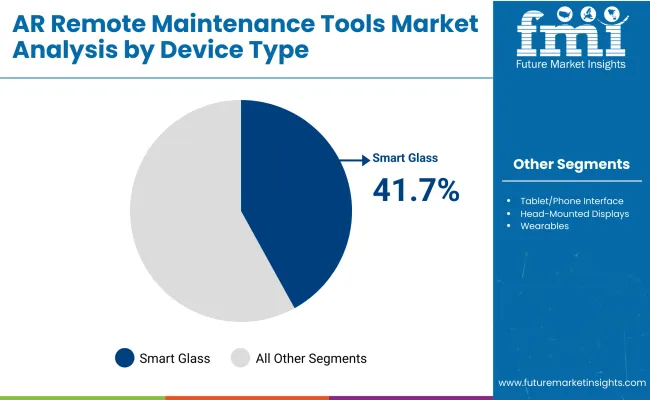
Smart Glasses Lead with Hands-Free Efficiency and Immersive Guidance

Ar Remote Maintenance Tool Market By Device

Smart glasses are projected to hold a 41.7% share in 2025, driven by their ability to deliver hands-free, real-time visual instructions in industrial settings. These devices overlay digital schematics, work instructions, and 3D annotations directly into the technician’s field of view, reducing downtime and error rates. Integrated sensors and high-resolution displays enable precision work in complex maintenance tasks.

Adoption is fuelled by compatibility with AR software platforms that allow remote experts to guide on-site staff without physical presence. Durable, lightweight designs with safety compliance make them ideal for packaging plants and high-speed production lines. As battery life, processing power, and connectivity improve, smart glasses are becoming essential for modern maintenance operations.
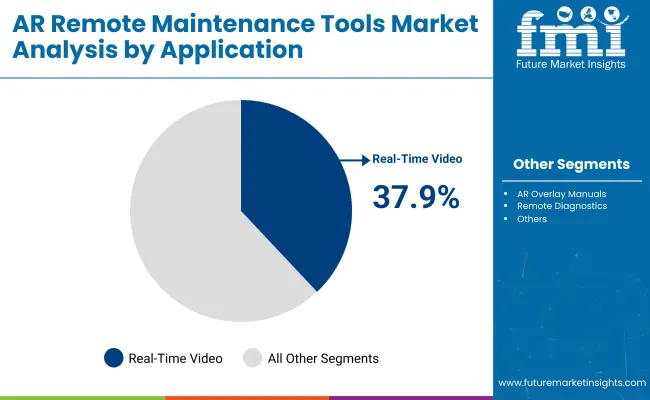
Real-Time Video Support Dominates with Instant Problem-Solving Capability

Ar Remote Maintenance Tool Market By Application

The real-time video support segment is expected to account for 37.9% of the market in 2025, providing live, interactive communication between field technicians and remote specialists. This functionality enables step-by-step troubleshooting, with shared camera views and annotation tools to highlight critical components or procedures. The approach reduces costly service delays and accelerates repair cycles.

Its adoption is increasing in packaging and manufacturing sectors where immediate fault resolution minimizes production loss. Integration with AR platforms allows remote experts to superimpose visual cues onto live feeds, improving technician accuracy. Enhanced bandwidth through 5G and low-latency streaming ensures seamless communication, even in challenging industrial network environments.
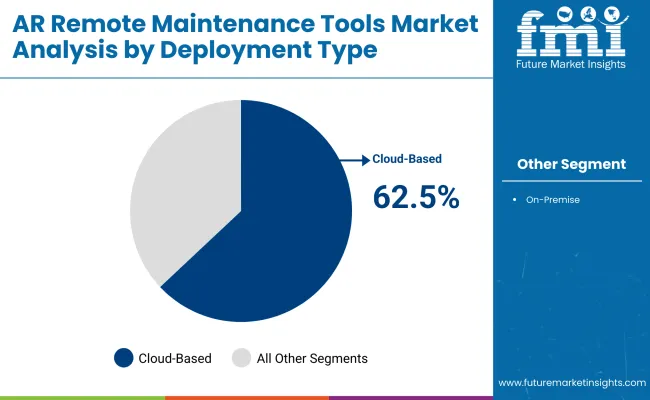
Cloud-Based Deployment Leads with Scalability and Remote Access

Ar Remote Maintenance Tool Market By Deployment

Cloud-based solutions are forecast to hold a 62.5% share in 2025, enabling flexible access to AR maintenance tools without extensive on-premise infrastructure. These platforms allow real-time data synchronization, remote diagnostics, and continuous software updates, ensuring optimal tool performance. Lower upfront costs and simplified integration appeal to both small and large enterprises.

The model supports multi-location operations, allowing centralized teams to manage maintenance support globally. Enhanced data security, encryption protocols, and compliance with industry regulations improve trust in cloud deployment. With predictive analytics and AI capabilities, cloud-based AR systems are becoming critical to proactive maintenance strategies across diverse industrial sectors.

Packaging Line Troubleshooting Leads with High Downtime Cost Avoidance

Packaging line troubleshooting is projected to hold a 34.9% share in 2025, as AR tools streamline fault detection and resolution in automated packaging environments. These tools enable quick identification of mechanical, electrical, or software-related issues through guided visual workflows. The capability reduces unplanned downtime and preserves production schedules.

Industries such as food, beverage, and consumer goods rely heavily on uninterrupted packaging operations. AR-guided troubleshooting supports faster part replacements, configuration adjustments, and quality checks. With high-speed lines handling diverse SKUs, rapid changeovers are critical, making AR-based guidance a valuable addition to operational efficiency frameworks.

Food Packaging Industry Leads with Stringent Compliance and Safety Standards

The food packaging industry is expected to account for 28.4% of market demand in 2025, driven by strict hygiene regulations and zero-contamination requirements. AR maintenance tools assist in ensuring equipment is serviced without compromising sterile production environments. They also help document compliance for audits and traceability records.

Adoption is further supported by the need to minimize downtime in high-volume food processing lines. Remote AR guidance enables safe intervention without prolonged exposure to sensitive production zones. As the sector embraces automation, AR maintenance tools are becoming integral to quality assurance, preventive maintenance, and workforce training initiatives.

What are the Drivers, Restraints, and Key Trends of the AR Remote Maintenance Tools Market?

The AR remote maintenance tools market is expanding as industries adopt immersive technologies to improve equipment servicing, reduce downtime, and minimize travel costs. Growing reliance on real-time, hands-free technical guidance is boosting uptake in manufacturing, energy, and aerospace sectors. However, high deployment costs, infrastructure limitations, and integration complexities slow adoption in smaller operations. Advances in AI-enabled diagnostics, wearable compatibility, and cloud-based collaboration are expected to define future growth.

Efficiency Gains, Cost Savings, and Workforce Training Driving Adoption

AR remote maintenance tools enable technicians to receive visual, step-by-step guidance without being physically on-site, reducing operational delays and minimizing the need for expert travel. Manufacturing plants use these tools to troubleshoot machinery, energy firms deploy them for field inspections, and aerospace operators integrate them for aircraft servicing.

The ability to overlay real-time data, schematics, and sensor readings onto physical equipment enhances repair accuracy and shortens maintenance cycles. These tools also facilitate remote training, enabling less experienced staff to complete complex tasks under virtual supervision, reducing skill gaps and increasing productivity across global operations.

High Implementation Costs, Network Dependence, and Security Concerns

While adoption is rising, high hardware costs for AR headsets, compatible mobile devices, and supporting sensors remain a challenge, especially for smaller firms. The technology’s reliance on stable high-speed internet can limit use in remote or offshore environments where connectivity is inconsistent. Integration with legacy systems requires substantial IT investment and change management efforts.

Furthermore, the transmission of sensitive maintenance data over networks raises cybersecurity and intellectual property protection concerns, leading some industries to hesitate until stronger security protocols are standardized. These barriers are slowing large-scale deployment in cost-sensitive markets.

AI-driven Guidance, 5G Connectivity, and Wearable Integration Emerging

Technological innovation is accelerating, with AI-enabled AR tools capable of auto-detecting faults and recommending corrective actions in real time. The rollout of 5G networks is enhancing data transmission speed and reliability, enabling smoother remote collaboration even in bandwidth-intensive scenarios. Wearable integration, from smart glasses to AR-enabled helmets, is making hands-free operation more practical and comfortable for field workers.

Cloud-based platforms now store maintenance histories, enabling predictive servicing and reducing unplanned downtime. As industries prioritize sustainability, AR tools are also contributing by reducing the environmental impact of travel for maintenance teams, reinforcing their role in future operational strategies.
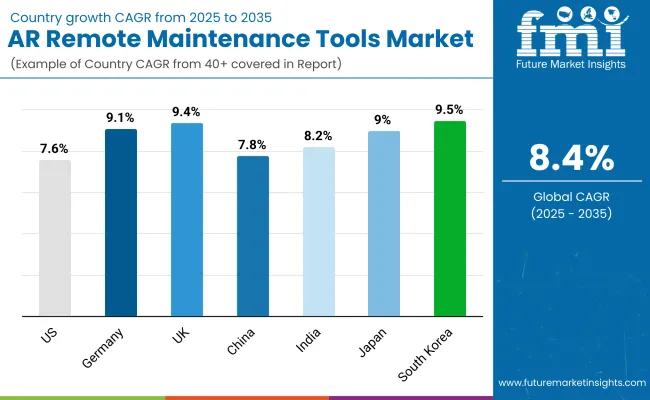
Analysis of AR Remote Maintenance Tools Market by Key Countries

Ar Remote Maintenance Tool Market By Country

The global AR remote maintenance tools market is growing steadily, supported by increasing adoption of Industry 4.0, real-time troubleshooting needs, and remote collaboration requirements. Asia-Pacific is emerging as a high-growth region, with India and China expanding due to industrial automation investments and workforce upskilling. Developed markets like the USA, Germany, and Japan are advancing AR-integrated diagnostics, wearable compatibility, and AI-enhanced assistance to meet operational efficiency, safety, and compliance demands.

Sales Outlook for AR Remote Maintenance Tools United States

The USA market is projected to grow at a CAGR of 7.6% from 2025 to 2035, driven by high adoption in manufacturing, aerospace, and energy sectors. Enterprises are deploying AR tools for equipment inspection, guided repair, and real-time expert collaboration. Integration with IoT sensors and cloud-based analytics is enhancing predictive maintenance capabilities.

  • OEMs launch AR-enabled smart glasses for field technicians.
  • Remote repair platforms reduce downtime in industrial plants.
  • AI-based fault detection supports faster resolution and compliance.

Growth Outlook for AR Remote Maintenance Tools Germany

Germany’s market is expected to grow at a CAGR of 9.1%, powered by strong manufacturing and engineering sectors. Automotive and machinery industries are using AR solutions to streamline complex assembly and maintenance tasks. Collaboration tools integrating CAD overlays and multilingual instructions are gaining traction.

  • AR-assisted repair guides reduce training time for new technicians.
  • Predictive analytics platforms connect with AR systems for proactive servicing.
  • OEMs develop modular AR applications for diverse industrial use cases.

Expansion Outlook for AR Remote Maintenance Tools United Kingdom

The UK market is forecast to expand at a CAGR of 9.4%, driven by defense, energy, and transport infrastructure modernization. SMEs are adopting subscription-based AR platforms to cut operational costs and improve workforce productivity. Cloud-enabled AR tools with remote supervision features are increasingly preferred.

  • Rail maintenance teams use AR overlays for inspection accuracy.
  • Offshore energy operators integrate AR for hazard identification.
  • Mobile AR apps enable on-the-go asset servicing.

Sales Outlook for AR Remote Maintenance Tools China

China’s market is projected to grow at a CAGR of 7.8%, fueled by large-scale smart manufacturing initiatives and government support for industrial digitization. AR solutions are being deployed in electronics, automotive, and heavy machinery sectors to enhance production line uptime.

  • Factories adopt AR-guided calibration for precision equipment.
  • Local tech firms integrate AI-driven translation into AR maintenance apps.
  • OEMs provide custom AR solutions for export-oriented industries.

Growth Outlook for AR Remote Maintenance Tools India

India’s market is set to grow at a CAGR of 8.2%, supported by rapid industrial growth and digital transformation programs. AR tools are being used in utilities, automotive, and telecom maintenance to optimize performance. Affordable AR headsets and localized software are increasing adoption among mid-sized firms.

  • Power sector operators use AR for grid inspection and fault repair.
  • Automotive workshops deploy AR diagnostics for complex servicing.
  • AR apps offer multilingual guidance for diverse workforces.

Growth Outlook for AR Remote Maintenance Tools Japan

Japan is projected to grow at a CAGR of 9.0%, with industries focusing on AR for precision manufacturing, healthcare equipment maintenance, and transport systems. Demand is rising for wearable-integrated AR systems with gesture control.

  • Railway operators deploy AR to reduce service downtime.
  • Robotics firms integrate AR interfaces for maintenance.
  • AR modules provide compliance documentation in real time.

Expansion Outlook for AR Remote Maintenance Tools South Korea

South Korea’s market is expected to expand at a CAGR of 9.5%, led by semiconductor, shipbuilding, and electronics sectors. High-speed connectivity supports seamless AR streaming for real-time problem-solving.
  • Shipyards use AR to enhance hull inspection and repair.
  • Semiconductor fabs integrate AR with cleanroom safety protocols.
  • AR cloud platforms enable collaborative global servicing sessions.

Competitive Landscape of AR Remote Maintenance Tools Market

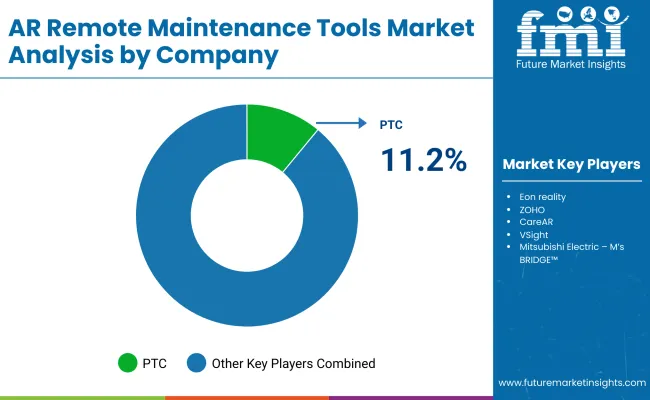
Ar Remote Maintenance Tool Market By Company

The AR remote maintenance tools market is moderately fragmented, with industrial software leaders, AR platform providers, and enterprise service innovators competing across manufacturing, utilities, and field service sectors. Global leaders such as PTC, Eon Reality, and ZOHO hold notable market share, driven by advanced AR visualization, real-time collaboration, and integration with enterprise asset management systems. Their strategies increasingly emphasize AI-enabled diagnostics, multi-device compatibility, and secure cloud-based deployment to enhance operational uptime.

Established mid-sized players including CareAR, VSight, and Mitsubishi Electric’s M’s BRIDGE™ are supporting adoption of modular AR maintenance solutions featuring live annotation, 3D model overlays, and IoT data integration. These companies are especially active in aerospace, automotive, and energy maintenance operations, offering cross-platform support, customizable workflows, and remote expertise delivery for time-critical interventions.

Specialized technology providers such as LG CNS, ABB, Taqtile, and Acty focus on tailored AR solutions for regional industries and niche use cases. Their strengths lie in developing scalable AR toolkits, integrating wearable hardware with maintenance platforms, and delivering end-to-end solutions combining AR guidance with predictive analytics for proactive asset management and reduced service downtime.

Key Development of AR Remote Maintenance Tools Market

  • In January 2024, CareAR, A Xerox Company, and Service Experience Management (SXM) market leader, announced that Keypoint Intelligence named CareAR a Buyers Lab (BLI) 2024 Pick Award winner for the Platform for Outstanding Remote Service & Support Technology. CareAR® Instruct achieved a Platinum rating, and CareAR® Assist achieved a Gold rating in Keypoint Intelligence testing.
  • In September 2024, PTC announced that its AR product Vuforia Chalk will be retired on October 31, 2025, with customers advised to migrate to ServiceMax Zinc, its unified remote collaboration tool.

Key Companies

  • PTC
  • Eon reality
  • ZOHO
  • CareAR
  • VSight
  • Mitsubishi Electric - M’s BRIDGE™
  • LG CNS
  • ABB
  • Taqtile
  • Acty

Scope of the Report

Item Value
Quantitative Units USD 2.8 Billion
By Device Type Smart Glasses, Tablet/Phone Interface, Head-Mounted Displays (HMDs), Wearables
By Functionality Real-time Video Support, AR Overlay Manuals, Remote Diagnostics, IoT Integration
By Deployment Type Cloud-based, On-Premise
By Application Packaging Line Troubleshooting, Machine Setup, Remote Operator Training
By End-Use Industry Food Packaging, Pharma Lines, Industrial Equipment, Aerospace, Automotive
Key Companies Profiled PTC, Eon Reality, ZOHO, CareAR, VSight, Mitsubishi Electric - M’s BRIDGE™, LG CNS, ABB, Taqtile, Acty
Additional Attributes Rising demand for AR tools to minimize downtime and enhance operational efficiency, increasing adoption of smart glasses and HMDs for hands-free remote support, integration of IoT data overlays for predictive maintenance, cloud-based deployments enabling scalability and global collaboration, growing focus on training solutions using AR simulations, and industry adoption across packaging, pharma, and heavy equipment sectors driven by efficiency, safety, and cost reduction benefits.

Key Segmentation

By Device Type:

  • Smart Glasses
  • Tablet/Phone Interface
  • Head-Mounted Displays (HMDs)
  • Wearables

By Functionality:

  • Real-time Video Support
  • AR Overlay Manuals
  • Remote Diagnostics
  • IoT Integration

By Deployment Type:

  • Cloud-based
  • On-Premise

By Application:

  • Packaging Line Troubleshooting
  • Machine Setup
  • Remote Operator Training

By End-Use Industry:

  • Food Packaging
  • Pharma Lines
  • Industrial Equipment
  • Aerospace
  • Automotive

By Region:

  • North America
  • Europe
  • Asia-Pacific
  • Latin America
  • Middle East & Africa

Table of Content

  1. Executive Summary
    • Global Market Outlook
    • Demand-side Trends
    • Supply-side Trends
    • Technology Roadmap Analysis
    • Analysis and Recommendations
  2. Market Overview
    • Market Coverage / Taxonomy
    • Market Definition / Scope / Limitations
  3. Market Background
    • Market Dynamics
      • Drivers
      • Restraints
      • Opportunity
      • Trends
    • Scenario Forecast
      • Demand in Optimistic Scenario
      • Demand in Likely Scenario
      • Demand in Conservative Scenario
    • Opportunity Map Analysis
    • Product Life Cycle Analysis
    • Supply Chain Analysis
      • Supply Side Participants and their Roles
        • Producers
        • Mid-Level Participants (Traders/ Agents/ Brokers)
        • Wholesalers and Distributors
      • Value Added and Value Created at Node in the Supply Chain
      • List of Raw Material Suppliers
      • List of Existing and Potential Buyer’s
    • Investment Feasibility Matrix
    • Value Chain Analysis
      • Profit Margin Analysis
      • Wholesalers and Distributors
      • Retailers
    • PESTLE and Porter’s Analysis
    • Regulatory Landscape
      • By Key Regions
      • By Key Countries
    • Regional Parent Market Outlook
    • Production and Consumption Statistics
    • Import and Export Statistics
  4. Global Market Analysis 2020 to 2024 and Forecast, 2025 to 2035
    • Historical Market Size Value (USD Billion) & Volume (Units) Analysis, 2020 to 2024
    • Current and Future Market Size Value (USD Billion) & Volume (Units) Projections, 2025 to 2035
      • Y-o-Y Growth Trend Analysis
      • Absolute $ Opportunity Analysis
  5. Global Market Pricing Analysis 2020 to 2024 and Forecast 2025 to 2035
  6. Global Market Analysis 2020 to 2024 and Forecast 2025 to 2035, By Device Type
    • Introduction / Key Findings
    • Historical Market Size Value (USD Billion) & Volume (Units) Analysis By Device Type, 2020 to 2024
    • Current and Future Market Size Value (USD Billion) & Volume (Units) Analysis and Forecast By Device Type, 2025 to 2035
      • Smart Glasses
      • Tablet/Phone Interface
      • Head-Mounted Displays (HMDs)
      • Wearables
    • Y-o-Y Growth Trend Analysis By Device Type, 2020 to 2024
    • Absolute $ Opportunity Analysis By Device Type, 2025 to 2035
  7. Global Market Analysis 2020 to 2024 and Forecast 2025 to 2035, By Functionality
    • Introduction / Key Findings
    • Historical Market Size Value (USD Billion) & Volume (Units) Analysis By Functionality, 2020 to 2024
    • Current and Future Market Size Value (USD Billion) & Volume (Units) Analysis and Forecast By Functionality, 2025 to 2035
      • Real-time Video Support
      • AR Overlay Manuals
      • Remote Diagnostics
      • IoT Integration
    • Y-o-Y Growth Trend Analysis By Functionality, 2020 to 2024
    • Absolute $ Opportunity Analysis By Functionality, 2025 to 2035
  8. Global Market Analysis 2020 to 2024 and Forecast 2025 to 2035, By Deployment Type
    • Introduction / Key Findings
    • Historical Market Size Value (USD Billion) & Volume (Units) Analysis By Deployment Type, 2020 to 2024
    • Current and Future Market Size Value (USD Billion) & Volume (Units) Analysis and Forecast By Deployment Type, 2025 to 2035
      • Cloud-based
      • On-Premise
    • Y-o-Y Growth Trend Analysis By Deployment Type, 2020 to 2024
    • Absolute $ Opportunity Analysis By Deployment Type, 2025 to 2035
  9. Global Market Analysis 2020 to 2024 and Forecast 2025 to 2035, By Application
    • Introduction / Key Findings
    • Historical Market Size Value (USD Billion) & Volume (Units) Analysis By Application, 2020 to 2024
    • Current and Future Market Size Value (USD Billion) & Volume (Units) Analysis and Forecast By Application, 2025 to 2035
      • Packaging Line Troubleshooting
      • Machine Setup
      • Remote Operator Training
    • Y-o-Y Growth Trend Analysis By Application, 2020 to 2024
    • Absolute $ Opportunity Analysis By Application, 2025 to 2035
  10. Global Market Analysis 2020 to 2024 and Forecast 2025 to 2035, By End-Use Industry
    • Introduction / Key Findings
    • Historical Market Size Value (USD Billion) & Volume (Units) Analysis By End-Use Industry, 2020 to 2024
    • Current and Future Market Size Value (USD Billion) & Volume (Units) Analysis and Forecast By End-Use Industry, 2025 to 2035
      • Food Packaging
      • Pharma Lines
      • Industrial Equipment
      • Aerospace
      • Automotive
    • Y-o-Y Growth Trend Analysis By End-Use Industry, 2020 to 2024
    • Absolute $ Opportunity Analysis By End-Use Industry, 2025 to 2035
  11. Global Market Analysis 2020 to 2024 and Forecast 2025 to 2035, By Region
    • Introduction
    • Historical Market Size Value (USD Billion) & Volume (Units) Analysis By Region, 2020 to 2024
    • Current Market Size Value (USD Billion) & Volume (Units) Analysis and Forecast By Region, 2025 to 2035
      • North America
      • Latin America
      • Europe
      • East Asia
      • South Asia
      • Oceania
      • MEA
    • Market Attractiveness Analysis By Region
  12. North America Market Analysis 2020 to 2024 and Forecast 2025 to 2035, By Country
    • Historical Market Size Value (USD Billion) & Volume (Units) Trend Analysis By Market Taxonomy, 2020 to 2024
    • Market Size Value (USD Billion) & Volume (Units) Forecast By Market Taxonomy, 2025 to 2035
      • By Country
        • USA
        • Canada
      • By Device Type
      • By Functionality
      • By Deployment Type
      • By Application
      • By End-Use Industry
    • Market Attractiveness Analysis
      • By Country
      • By Device Type
      • By Functionality
      • By Deployment Type
      • By Application
      • By End-Use Industry
    • Key Takeaways
  13. Latin America Market Analysis 2020 to 2024 and Forecast 2025 to 2035, By Country
    • Historical Market Size Value (USD Billion) & Volume (Units) Trend Analysis By Market Taxonomy, 2020 to 2024
    • Market Size Value (USD Billion) & Volume (Units) Forecast By Market Taxonomy, 2025 to 2035
      • By Country
        • Brazil
        • Mexico
        • Argentina
        • Chile
        • Peru
        • Rest of Latin America
      • By Device Type
      • By Functionality
      • By Deployment Type
      • By Application
      • By End-Use Industry
    • Market Attractiveness Analysis
      • By Country
      • By Device Type
      • By Functionality
      • By Deployment Type
      • By Application
      • By End-Use Industry
    • Key Takeaways
  14. Europe Market Analysis 2020 to 2024 and Forecast 2025 to 2035, By Country
    • Historical Market Size Value (USD Billion) & Volume (Units) Trend Analysis By Market Taxonomy, 2020 to 2024
    • Market Size Value (USD Billion) & Volume (Units) Forecast By Market Taxonomy, 2025 to 2035
      • By Country
        • Germany
        • Italy
        • France
        • UK
        • Spain
        • Russia
        • BENELUX
        • Rest of Europe
      • By Device Type
      • By Functionality
      • By Deployment Type
      • By Application
      • By End-Use Industry
    • Market Attractiveness Analysis
      • By Country
      • By Device Type
      • By Functionality
      • By Deployment Type
      • By Application
      • By End-Use Industry
    • Key Takeaways
  15. East Asia Market Analysis 2020 to 2024 and Forecast 2025 to 2035, By Country
    • Historical Market Size Value (USD Billion) & Volume (Units) Trend Analysis By Market Taxonomy, 2020 to 2024
    • Market Size Value (USD Billion) & Volume (Units) Forecast By Market Taxonomy, 2025 to 2035
      • By Country
        • China
        • Japan
        • South Korea
      • By Device Type
      • By Functionality
      • By Deployment Type
      • By Application
      • By End-Use Industry
    • Market Attractiveness Analysis
      • By Country
      • By Device Type
      • By Functionality
      • By Deployment Type
      • By Application
      • By End-Use Industry
    • Key Takeaways
  16. South Asia Market Analysis 2020 to 2024 and Forecast 2025 to 2035, By Country
    • Historical Market Size Value (USD Billion) & Volume (Units) Trend Analysis By Market Taxonomy, 2020 to 2024
    • Market Size Value (USD Billion) & Volume (Units) Forecast By Market Taxonomy, 2025 to 2035
      • By Country
        • India
        • Thailand
        • Malaysia
        • Indonesia
        • Rest of South Asia
      • By Device Type
      • By Functionality
      • By Deployment Type
      • By Application
      • By End-Use Industry
    • Market Attractiveness Analysis
      • By Country
      • By Device Type
      • By Functionality
      • By Deployment Type
      • By Application
      • By End-Use Industry
    • Key Takeaways
  17. Oceania Market Analysis 2020 to 2024 and Forecast 2025 to 2035, By Country
    • Historical Market Size Value (USD Billion) & Volume (Units) Trend Analysis By Market Taxonomy, 2020 to 2024
    • Market Size Value (USD Billion) & Volume (Units) Forecast By Market Taxonomy, 2025 to 2035
      • By Country
        • Australia
        • New Zealand
      • By Device Type
      • By Functionality
      • By Deployment Type
      • By Application
      • By End-Use Industry
    • Market Attractiveness Analysis
      • By Country
      • By Device Type
      • By Functionality
      • By Deployment Type
      • By Application
      • By End-Use Industry
    • Key Takeaways
  18. MEA Market Analysis 2020 to 2024 and Forecast 2025 to 2035, By Country
    • Historical Market Size Value (USD Billion) & Volume (Units) Trend Analysis By Market Taxonomy, 2020 to 2024
    • Market Size Value (USD Billion) & Volume (Units) Forecast By Market Taxonomy, 2025 to 2035
      • By Country
        • GCC
        • Rest of MEA
      • By Device Type
      • By Functionality
      • By Deployment Type
      • By Application
      • By End-Use Industry
    • Market Attractiveness Analysis
      • By Country
      • By Device Type
      • By Functionality
      • By Deployment Type
      • By Application
      • By End-Use Industry
    • Key Takeaways
  19. Key Countries Market Analysis
    • USA
      • Pricing Analysis
      • Market Share Analysis, 2024
        • By Device Type
        • By Functionality
        • By Deployment Type
        • By Application
        • By End-Use Industry
    • Canada
      • Pricing Analysis
      • Market Share Analysis, 2024
        • By Device Type
        • By Functionality
        • By Deployment Type
        • By Application
        • By End-Use Industry
    • Brazil
      • Pricing Analysis
      • Market Share Analysis, 2024
        • By Device Type
        • By Functionality
        • By Deployment Type
        • By Application
        • By End-Use Industry
    • Mexico
      • Pricing Analysis
      • Market Share Analysis, 2024
        • By Device Type
        • By Functionality
        • By Deployment Type
        • By Application
        • By End-Use Industry
    • Argentina
      • Pricing Analysis
      • Market Share Analysis, 2024
        • By Device Type
        • By Functionality
        • By Deployment Type
        • By Application
        • By End-Use Industry
  20. Market Structure Analysis
    • Competition Dashboard
    • Competition Benchmarking
    • Market Share Analysis of Top Players
      • By Regional
      • By Device Type
      • By Functionality
      • By Deployment Type
      • By Application
      • By End-Use Industry
  21. Competition Analysis
    • Competition Deep Dive
      • PTC
        • Overview
        • Product Portfolio
        • Profitability by Market Segments (Product/Age /Sales Channel/Region)
        • Sales Footprint
        • Strategy Overview
          • Marketing Strategy
          • Product Strategy
          • Channel Strategy
      • Eon reality
        • Overview
        • Product Portfolio
        • Profitability by Market Segments (Product/Age /Sales Channel/Region)
        • Sales Footprint
        • Strategy Overview
          • Marketing Strategy
          • Product Strategy
          • Channel Strategy
      • ZOHO
        • Overview
        • Product Portfolio
        • Profitability by Market Segments (Product/Age /Sales Channel/Region)
        • Sales Footprint
        • Strategy Overview
          • Marketing Strategy
          • Product Strategy
          • Channel Strategy
      • CareAR
        • Overview
        • Product Portfolio
        • Profitability by Market Segments (Product/Age /Sales Channel/Region)
        • Sales Footprint
        • Strategy Overview
          • Marketing Strategy
          • Product Strategy
          • Channel Strategy
      • VSight
        • Overview
        • Product Portfolio
        • Profitability by Market Segments (Product/Age /Sales Channel/Region)
        • Sales Footprint
        • Strategy Overview
          • Marketing Strategy
          • Product Strategy
          • Channel Strategy
      • Mitsubishi Electric - M’s BRIDGE™
        • Overview
        • Product Portfolio
        • Profitability by Market Segments (Product/Age /Sales Channel/Region)
        • Sales Footprint
        • Strategy Overview
          • Marketing Strategy
          • Product Strategy
          • Channel Strategy
      • LG CNS
        • Overview
        • Product Portfolio
        • Profitability by Market Segments (Product/Age /Sales Channel/Region)
        • Sales Footprint
        • Strategy Overview
          • Marketing Strategy
          • Product Strategy
          • Channel Strategy
      • ABB
        • Overview
        • Product Portfolio
        • Profitability by Market Segments (Product/Age /Sales Channel/Region)
        • Sales Footprint
        • Strategy Overview
          • Marketing Strategy
          • Product Strategy
          • Channel Strategy
      • Taqtile
        • Overview
        • Product Portfolio
        • Profitability by Market Segments (Product/Age /Sales Channel/Region)
        • Sales Footprint
        • Strategy Overview
          • Marketing Strategy
          • Product Strategy
          • Channel Strategy
      • Acty
        • Overview
        • Product Portfolio
        • Profitability by Market Segments (Product/Age /Sales Channel/Region)
        • Sales Footprint
        • Strategy Overview
          • Marketing Strategy
          • Product Strategy
          • Channel Strategy
  22. Assumptions & Acronyms Used
  23. Research Methodology

List of Tables

  • Table 1: Global Market Value (USD Billion) Forecast by Region, 2020-2035
  • Table 2: Global Market Volume (Units) Forecast by Region, 2020-2035
  • Table 3: Global Market Value (USD Billion) Forecast by Device Type, 2020-2035
  • Table 4: Global Market Volume (Units) Forecast by Device Type, 2020-2035
  • Table 5: Global Market Value (USD Billion) Forecast by Functionality, 2020-2035
  • Table 6: Global Market Volume (Units) Forecast by Functionality, 2020-2035
  • Table 7: Global Market Value (USD Billion) Forecast by Deployment Type, 2020-2035
  • Table 8: Global Market Volume (Units) Forecast by Deployment Type, 2020-2035
  • Table 9: Global Market Value (USD Billion) Forecast by Application, 2020-2035
  • Table 10: Global Market Volume (Units) Forecast by Application, 2020-2035
  • Table 11: Global Market Value (USD Billion) Forecast by End-Use Industry, 2020-2035
  • Table 12: Global Market Volume (Units) Forecast by End-Use Industry, 2020-2035
  • Table 13: North America Market Value (USD Billion) Forecast by Country, 2020-2035
  • Table 14: North America Market Volume (Units) Forecast by Country, 2020-2035
  • Table 15: North America Market Value (USD Billion) Forecast by Device Type, 2020-2035
  • Table 16: North America Market Volume (Units) Forecast by Device Type, 2020-2035
  • Table 17: North America Market Value (USD Billion) Forecast by Functionality, 2020-2035
  • Table 18: North America Market Volume (Units) Forecast by Functionality, 2020-2035
  • Table 19: North America Market Value (USD Billion) Forecast by Deployment Type, 2020-2035
  • Table 20: North America Market Volume (Units) Forecast by Deployment Type, 2020-2035
  • Table 21: North America Market Value (USD Billion) Forecast by Application, 2020-2035
  • Table 22: North America Market Volume (Units) Forecast by Application, 2020-2035
  • Table 23: North America Market Value (USD Billion) Forecast by End-Use Industry, 2020-2035
  • Table 24: North America Market Volume (Units) Forecast by End-Use Industry, 2020-2035
  • Table 25: Latin America Market Value (USD Billion) Forecast by Country, 2020-2035
  • Table 26: Latin America Market Volume (Units) Forecast by Country, 2020-2035
  • Table 27: Latin America Market Value (USD Billion) Forecast by Device Type, 2020-2035
  • Table 28: Latin America Market Volume (Units) Forecast by Device Type, 2020-2035
  • Table 29: Latin America Market Value (USD Billion) Forecast by Functionality, 2020-2035
  • Table 30: Latin America Market Volume (Units) Forecast by Functionality, 2020-2035
  • Table 31: Latin America Market Value (USD Billion) Forecast by Deployment Type, 2020-2035
  • Table 32: Latin America Market Volume (Units) Forecast by Deployment Type, 2020-2035
  • Table 33: Latin America Market Value (USD Billion) Forecast by Application, 2020-2035
  • Table 34: Latin America Market Volume (Units) Forecast by Application, 2020-2035
  • Table 35: Latin America Market Value (USD Billion) Forecast by End-Use Industry, 2020-2035
  • Table 36: Latin America Market Volume (Units) Forecast by End-Use Industry, 2020-2035
  • Table 37: Europe Market Value (USD Billion) Forecast by Country, 2020-2035
  • Table 38: Europe Market Volume (Units) Forecast by Country, 2020-2035
  • Table 39: Europe Market Value (USD Billion) Forecast by Device Type, 2020-2035
  • Table 40: Europe Market Volume (Units) Forecast by Device Type, 2020-2035
  • Table 41: Europe Market Value (USD Billion) Forecast by Functionality, 2020-2035
  • Table 42: Europe Market Volume (Units) Forecast by Functionality, 2020-2035
  • Table 43: Europe Market Value (USD Billion) Forecast by Deployment Type, 2020-2035
  • Table 44: Europe Market Volume (Units) Forecast by Deployment Type, 2020-2035
  • Table 45: Europe Market Value (USD Billion) Forecast by Application, 2020-2035
  • Table 46: Europe Market Volume (Units) Forecast by Application, 2020-2035
  • Table 47: Europe Market Value (USD Billion) Forecast by End-Use Industry, 2020-2035
  • Table 48: Europe Market Volume (Units) Forecast by End-Use Industry, 2020-2035
  • Table 49: East Asia Market Value (USD Billion) Forecast by Country, 2020-2035
  • Table 50: East Asia Market Volume (Units) Forecast by Country, 2020-2035
  • Table 51: East Asia Market Value (USD Billion) Forecast by Device Type, 2020-2035
  • Table 52: East Asia Market Volume (Units) Forecast by Device Type, 2020-2035
  • Table 53: East Asia Market Value (USD Billion) Forecast by Functionality, 2020-2035
  • Table 54: East Asia Market Volume (Units) Forecast by Functionality, 2020-2035
  • Table 55: East Asia Market Value (USD Billion) Forecast by Deployment Type, 2020-2035
  • Table 56: East Asia Market Volume (Units) Forecast by Deployment Type, 2020-2035
  • Table 57: East Asia Market Value (USD Billion) Forecast by Application, 2020-2035
  • Table 58: East Asia Market Volume (Units) Forecast by Application, 2020-2035
  • Table 59: East Asia Market Value (USD Billion) Forecast by End-Use Industry, 2020-2035
  • Table 60: East Asia Market Volume (Units) Forecast by End-Use Industry, 2020-2035
  • Table 61: South Asia Market Value (USD Billion) Forecast by Country, 2020-2035
  • Table 62: South Asia Market Volume (Units) Forecast by Country, 2020-2035
  • Table 63: South Asia Market Value (USD Billion) Forecast by Device Type, 2020-2035
  • Table 64: South Asia Market Volume (Units) Forecast by Device Type, 2020-2035
  • Table 65: South Asia Market Value (USD Billion) Forecast by Functionality, 2020-2035
  • Table 66: South Asia Market Volume (Units) Forecast by Functionality, 2020-2035
  • Table 67: South Asia Market Value (USD Billion) Forecast by Deployment Type, 2020-2035
  • Table 68: South Asia Market Volume (Units) Forecast by Deployment Type, 2020-2035
  • Table 69: South Asia Market Value (USD Billion) Forecast by Application, 2020-2035
  • Table 70: South Asia Market Volume (Units) Forecast by Application, 2020-2035
  • Table 71: South Asia Market Value (USD Billion) Forecast by End-Use Industry, 2020-2035
  • Table 72: South Asia Market Volume (Units) Forecast by End-Use Industry, 2020-2035
  • Table 73: Oceania Market Value (USD Billion) Forecast by Country, 2020-2035
  • Table 74: Oceania Market Volume (Units) Forecast by Country, 2020-2035
  • Table 75: Oceania Market Value (USD Billion) Forecast by Device Type, 2020-2035
  • Table 76: Oceania Market Volume (Units) Forecast by Device Type, 2020-2035
  • Table 77: Oceania Market Value (USD Billion) Forecast by Functionality, 2020-2035
  • Table 78: Oceania Market Volume (Units) Forecast by Functionality, 2020-2035
  • Table 79: Oceania Market Value (USD Billion) Forecast by Deployment Type, 2020-2035
  • Table 80: Oceania Market Volume (Units) Forecast by Deployment Type, 2020-2035
  • Table 81: Oceania Market Value (USD Billion) Forecast by Application, 2020-2035
  • Table 82: Oceania Market Volume (Units) Forecast by Application, 2020-2035
  • Table 83: Oceania Market Value (USD Billion) Forecast by End-Use Industry, 2020-2035
  • Table 84: Oceania Market Volume (Units) Forecast by End-Use Industry, 2020-2035
  • Table 85: MEA Market Value (USD Billion) Forecast by Country, 2020-2035
  • Table 86: MEA Market Volume (Units) Forecast by Country, 2020-2035
  • Table 87: MEA Market Value (USD Billion) Forecast by Device Type, 2020-2035
  • Table 88: MEA Market Volume (Units) Forecast by Device Type, 2020-2035
  • Table 89: MEA Market Value (USD Billion) Forecast by Functionality, 2020-2035
  • Table 90: MEA Market Volume (Units) Forecast by Functionality, 2020-2035
  • Table 91: MEA Market Value (USD Billion) Forecast by Deployment Type, 2020-2035
  • Table 92: MEA Market Volume (Units) Forecast by Deployment Type, 2020-2035
  • Table 93: MEA Market Value (USD Billion) Forecast by Application, 2020-2035
  • Table 94: MEA Market Volume (Units) Forecast by Application, 2020-2035
  • Table 95: MEA Market Value (USD Billion) Forecast by End-Use Industry, 2020-2035
  • Table 96: MEA Market Volume (Units) Forecast by End-Use Industry, 2020-2035

List of Figures

  • Figure 1: Global Market Volume (Units) Forecast 2020-2035
  • Figure 2: Global Market Pricing Analysis
  • Figure 3: Global Market Value (USD Billion) Forecast 2020-2035
  • Figure 4: Global Market Value Share and BPS Analysis by Device Type, 2025 and 2035
  • Figure 5: Global Market Y-o-Y Growth Comparison by Device Type, 2025-2035
  • Figure 6: Global Market Attractiveness Analysis by Device Type
  • Figure 7: Global Market Value Share and BPS Analysis by Functionality, 2025 and 2035
  • Figure 8: Global Market Y-o-Y Growth Comparison by Functionality, 2025-2035
  • Figure 9: Global Market Attractiveness Analysis by Functionality
  • Figure 10: Global Market Value Share and BPS Analysis by Deployment Type, 2025 and 2035
  • Figure 11: Global Market Y-o-Y Growth Comparison by Deployment Type, 2025-2035
  • Figure 12: Global Market Attractiveness Analysis by Deployment Type
  • Figure 13: Global Market Value Share and BPS Analysis by Application, 2025 and 2035
  • Figure 14: Global Market Y-o-Y Growth Comparison by Application, 2025-2035
  • Figure 15: Global Market Attractiveness Analysis by Application
  • Figure 16: Global Market Value Share and BPS Analysis by End-Use Industry, 2025 and 2035
  • Figure 17: Global Market Y-o-Y Growth Comparison by End-Use Industry, 2025-2035
  • Figure 18: Global Market Attractiveness Analysis by End-Use Industry
  • Figure 19: Global Market Value (USD Billion) Share and BPS Analysis by Region, 2025 and 2035
  • Figure 20: Global Market Y-o-Y Growth Comparison by Region, 2025-2035
  • Figure 21: Global Market Attractiveness Analysis by Region
  • Figure 22: North America Market Incremental $ Opportunity, 2025-2035
  • Figure 23: Latin America Market Incremental $ Opportunity, 2025-2035
  • Figure 24: Europe Market Incremental $ Opportunity, 2025-2035
  • Figure 25: East Asia Market Incremental $ Opportunity, 2025-2035
  • Figure 26: South Asia Market Incremental $ Opportunity, 2025-2035
  • Figure 27: Oceania Market Incremental $ Opportunity, 2025-2035
  • Figure 28: MEA Market Incremental $ Opportunity, 2025-2035
  • Figure 29: North America Market Value Share and BPS Analysis by Country, 2025 and 2035
  • Figure 30: North America Market Value Share and BPS Analysis by Device Type, 2025 and 2035
  • Figure 31: North America Market Y-o-Y Growth Comparison by Device Type, 2025-2035
  • Figure 32: North America Market Attractiveness Analysis by Device Type
  • Figure 33: North America Market Value Share and BPS Analysis by Functionality, 2025 and 2035
  • Figure 34: North America Market Y-o-Y Growth Comparison by Functionality, 2025-2035
  • Figure 35: North America Market Attractiveness Analysis by Functionality
  • Figure 36: North America Market Value Share and BPS Analysis by Deployment Type, 2025 and 2035
  • Figure 37: North America Market Y-o-Y Growth Comparison by Deployment Type, 2025-2035
  • Figure 38: North America Market Attractiveness Analysis by Deployment Type
  • Figure 39: North America Market Value Share and BPS Analysis by Application, 2025 and 2035
  • Figure 40: North America Market Y-o-Y Growth Comparison by Application, 2025-2035
  • Figure 41: North America Market Attractiveness Analysis by Application
  • Figure 42: North America Market Value Share and BPS Analysis by End-Use Industry, 2025 and 2035
  • Figure 43: North America Market Y-o-Y Growth Comparison by End-Use Industry, 2025-2035
  • Figure 44: North America Market Attractiveness Analysis by End-Use Industry
  • Figure 45: Latin America Market Value Share and BPS Analysis by Country, 2025 and 2035
  • Figure 46: Latin America Market Value Share and BPS Analysis by Device Type, 2025 and 2035
  • Figure 47: Latin America Market Y-o-Y Growth Comparison by Device Type, 2025-2035
  • Figure 48: Latin America Market Attractiveness Analysis by Device Type
  • Figure 49: Latin America Market Value Share and BPS Analysis by Functionality, 2025 and 2035
  • Figure 50: Latin America Market Y-o-Y Growth Comparison by Functionality, 2025-2035
  • Figure 51: Latin America Market Attractiveness Analysis by Functionality
  • Figure 52: Latin America Market Value Share and BPS Analysis by Deployment Type, 2025 and 2035
  • Figure 53: Latin America Market Y-o-Y Growth Comparison by Deployment Type, 2025-2035
  • Figure 54: Latin America Market Attractiveness Analysis by Deployment Type
  • Figure 55: Latin America Market Value Share and BPS Analysis by Application, 2025 and 2035
  • Figure 56: Latin America Market Y-o-Y Growth Comparison by Application, 2025-2035
  • Figure 57: Latin America Market Attractiveness Analysis by Application
  • Figure 58: Latin America Market Value Share and BPS Analysis by End-Use Industry, 2025 and 2035
  • Figure 59: Latin America Market Y-o-Y Growth Comparison by End-Use Industry, 2025-2035
  • Figure 60: Latin America Market Attractiveness Analysis by End-Use Industry
  • Figure 61: Europe Market Value Share and BPS Analysis by Country, 2025 and 2035
  • Figure 62: Europe Market Value Share and BPS Analysis by Device Type, 2025 and 2035
  • Figure 63: Europe Market Y-o-Y Growth Comparison by Device Type, 2025-2035
  • Figure 64: Europe Market Attractiveness Analysis by Device Type
  • Figure 65: Europe Market Value Share and BPS Analysis by Functionality, 2025 and 2035
  • Figure 66: Europe Market Y-o-Y Growth Comparison by Functionality, 2025-2035
  • Figure 67: Europe Market Attractiveness Analysis by Functionality
  • Figure 68: Europe Market Value Share and BPS Analysis by Deployment Type, 2025 and 2035
  • Figure 69: Europe Market Y-o-Y Growth Comparison by Deployment Type, 2025-2035
  • Figure 70: Europe Market Attractiveness Analysis by Deployment Type
  • Figure 71: Europe Market Value Share and BPS Analysis by Application, 2025 and 2035
  • Figure 72: Europe Market Y-o-Y Growth Comparison by Application, 2025-2035
  • Figure 73: Europe Market Attractiveness Analysis by Application
  • Figure 74: Europe Market Value Share and BPS Analysis by End-Use Industry, 2025 and 2035
  • Figure 75: Europe Market Y-o-Y Growth Comparison by End-Use Industry, 2025-2035
  • Figure 76: Europe Market Attractiveness Analysis by End-Use Industry
  • Figure 77: East Asia Market Value Share and BPS Analysis by Country, 2025 and 2035
  • Figure 78: East Asia Market Value Share and BPS Analysis by Device Type, 2025 and 2035
  • Figure 79: East Asia Market Y-o-Y Growth Comparison by Device Type, 2025-2035
  • Figure 80: East Asia Market Attractiveness Analysis by Device Type
  • Figure 81: East Asia Market Value Share and BPS Analysis by Functionality, 2025 and 2035
  • Figure 82: East Asia Market Y-o-Y Growth Comparison by Functionality, 2025-2035
  • Figure 83: East Asia Market Attractiveness Analysis by Functionality
  • Figure 84: East Asia Market Value Share and BPS Analysis by Deployment Type, 2025 and 2035
  • Figure 85: East Asia Market Y-o-Y Growth Comparison by Deployment Type, 2025-2035
  • Figure 86: East Asia Market Attractiveness Analysis by Deployment Type
  • Figure 87: East Asia Market Value Share and BPS Analysis by Application, 2025 and 2035
  • Figure 88: East Asia Market Y-o-Y Growth Comparison by Application, 2025-2035
  • Figure 89: East Asia Market Attractiveness Analysis by Application
  • Figure 90: East Asia Market Value Share and BPS Analysis by End-Use Industry, 2025 and 2035
  • Figure 91: East Asia Market Y-o-Y Growth Comparison by End-Use Industry, 2025-2035
  • Figure 92: East Asia Market Attractiveness Analysis by End-Use Industry
  • Figure 93: South Asia Market Value Share and BPS Analysis by Country, 2025 and 2035
  • Figure 94: South Asia Market Value Share and BPS Analysis by Device Type, 2025 and 2035
  • Figure 95: South Asia Market Y-o-Y Growth Comparison by Device Type, 2025-2035
  • Figure 96: South Asia Market Attractiveness Analysis by Device Type
  • Figure 97: South Asia Market Value Share and BPS Analysis by Functionality, 2025 and 2035
  • Figure 98: South Asia Market Y-o-Y Growth Comparison by Functionality, 2025-2035
  • Figure 99: South Asia Market Attractiveness Analysis by Functionality
  • Figure 100: South Asia Market Value Share and BPS Analysis by Deployment Type, 2025 and 2035
  • Figure 101: South Asia Market Y-o-Y Growth Comparison by Deployment Type, 2025-2035
  • Figure 102: South Asia Market Attractiveness Analysis by Deployment Type
  • Figure 103: South Asia Market Value Share and BPS Analysis by Application, 2025 and 2035
  • Figure 104: South Asia Market Y-o-Y Growth Comparison by Application, 2025-2035
  • Figure 105: South Asia Market Attractiveness Analysis by Application
  • Figure 106: South Asia Market Value Share and BPS Analysis by End-Use Industry, 2025 and 2035
  • Figure 107: South Asia Market Y-o-Y Growth Comparison by End-Use Industry, 2025-2035
  • Figure 108: South Asia Market Attractiveness Analysis by End-Use Industry
  • Figure 109: Oceania Market Value Share and BPS Analysis by Country, 2025 and 2035
  • Figure 110: Oceania Market Value Share and BPS Analysis by Device Type, 2025 and 2035
  • Figure 111: Oceania Market Y-o-Y Growth Comparison by Device Type, 2025-2035
  • Figure 112: Oceania Market Attractiveness Analysis by Device Type
  • Figure 113: Oceania Market Value Share and BPS Analysis by Functionality, 2025 and 2035
  • Figure 114: Oceania Market Y-o-Y Growth Comparison by Functionality, 2025-2035
  • Figure 115: Oceania Market Attractiveness Analysis by Functionality
  • Figure 116: Oceania Market Value Share and BPS Analysis by Deployment Type, 2025 and 2035
  • Figure 117: Oceania Market Y-o-Y Growth Comparison by Deployment Type, 2025-2035
  • Figure 118: Oceania Market Attractiveness Analysis by Deployment Type
  • Figure 119: Oceania Market Value Share and BPS Analysis by Application, 2025 and 2035
  • Figure 120: Oceania Market Y-o-Y Growth Comparison by Application, 2025-2035
  • Figure 121: Oceania Market Attractiveness Analysis by Application
  • Figure 122: Oceania Market Value Share and BPS Analysis by End-Use Industry, 2025 and 2035
  • Figure 123: Oceania Market Y-o-Y Growth Comparison by End-Use Industry, 2025-2035
  • Figure 124: Oceania Market Attractiveness Analysis by End-Use Industry
  • Figure 125: MEA Market Value Share and BPS Analysis by Country, 2025 and 2035
  • Figure 126: MEA Market Value Share and BPS Analysis by Device Type, 2025 and 2035
  • Figure 127: MEA Market Y-o-Y Growth Comparison by Device Type, 2025-2035
  • Figure 128: MEA Market Attractiveness Analysis by Device Type
  • Figure 129: MEA Market Value Share and BPS Analysis by Functionality, 2025 and 2035
  • Figure 130: MEA Market Y-o-Y Growth Comparison by Functionality, 2025-2035
  • Figure 131: MEA Market Attractiveness Analysis by Functionality
  • Figure 132: MEA Market Value Share and BPS Analysis by Deployment Type, 2025 and 2035
  • Figure 133: MEA Market Y-o-Y Growth Comparison by Deployment Type, 2025-2035
  • Figure 134: MEA Market Attractiveness Analysis by Deployment Type
  • Figure 135: MEA Market Value Share and BPS Analysis by Application, 2025 and 2035
  • Figure 136: MEA Market Y-o-Y Growth Comparison by Application, 2025-2035
  • Figure 137: MEA Market Attractiveness Analysis by Application
  • Figure 138: MEA Market Value Share and BPS Analysis by End-Use Industry, 2025 and 2035
  • Figure 139: MEA Market Y-o-Y Growth Comparison by End-Use Industry, 2025-2035
  • Figure 140: MEA Market Attractiveness Analysis by End-Use Industry
  • Figure 141: Global Market - Tier Structure Analysis
  • Figure 142: Global Market - Company Share Analysis

Frequently Asked Questions

How big is the AR remote maintenance tools market in 2025?

The global AR remote maintenance tools market is estimated to be valued at USD 2.8 billion in 2025.

What will be the size of the AR remote maintenance tools market in 2035?

The market size for the AR remote maintenance tools market is projected to reach USD 6.4 billion by 2035.

How much will be the AR remote maintenance tools market growth between 2025 and 2035?

The AR remote maintenance tools market is expected to grow at a CAGR of 8.4% between 2025 and 2035.

What are the key device types in the AR remote maintenance tools market?

The key device types in the AR remote maintenance tools market include smart glasses, tablet/phone interfaces, head-mounted displays (HMDs), and wearables.

Which device type segment is expected to contribute significant share in the AR remote maintenance tools market in 2025?

The smart glasses segment is expected to account for the highest share of 41.7% in the AR remote maintenance tools market in 2025.

Explore Similar Insights

Future Market Insights

AR Remote Maintenance Tool Market