Remote AF Detection Tools Market Size and Share Forecast Outlook 2025 to 2035

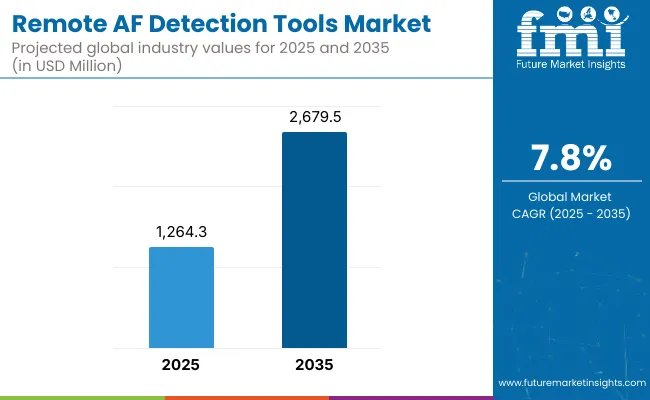
The Remote AF Detection Tools Market has been forecasted to attain a valuation of USD 1,264.3 million in 2025, rising to USD 2,679.5 million by 2035, resulting in an incremental gain of USD 1,415.2 million, which reflects a 47.2% increase over the forecast decade. A compound annual growth rate (CAGR) of 7.8% is expected to be recorded, indicating a rapid expansion trajectory for the remote AF detection tools market.
Quick Stats for Remote AF Detection Tools Market

  • Remote AF Detection Tools Market Value (2025): USD 1,264.3 million
  • Remote AF Detection Tools Market Forecast Value (2035): USD 2,679.5 million
  • Remote AF Detection Tools Market Forecast CAGR (2025 to 2035): 7.8%
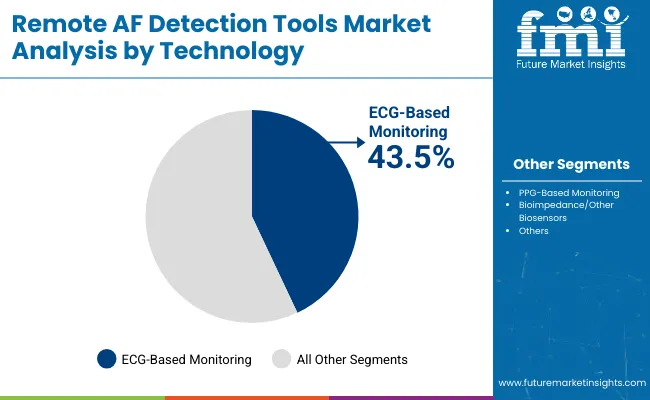
  • Leading Segment in 2025 (Technology): ECG-Based Monitoring (43.5%)
  • Key Growth Regions: North America, East Asia, and Europe
  • Top Key Players: Medtronic plc, Abbott Laboratories, Boston Scientific Corporation, iRhythm Technologies, Philips Healthcare, GE Healthcare, Siemens Healthineers and Others

Remote Af Detection Tools Market 01

Remote AF Detection Tools Market Key Takeaways

Metric Value
Market Estimated Value in (2025E) USD 1,264.3 million
Market Forecast Value in (2035F) USD 2,679.5 million
Forecast CAGR (2025 to 2035) 7.8%

During the initial five-year phase from 2025 to 2030, a heavy incline is projected from USD 1,264.3 million to approximately USD 1,840.6 million adding nearly USD 576.3 million, which would contribute 68.7% of the total decade growth.

This period is expected to be defined by increasing cardiovascular disease prevalence, growing consumer adoption of wearable devices, and expanding remote patient monitoring capabilities. Strong uptake is likely to be witnessed across aging populations and healthcare systems globally, particularly in North America and Europe.

Between 2030 and 2035, the market is projected to expand further by USD 838.9 million, supported by enhanced AI integration, improved diagnostic accuracy of consumer devices, and deeper penetration in clinical workflows.

Advanced photo plethysmography sensors, machine learning algorithms, and seamless electronic health record integration are expected to serve as growth amplifiers in the latter half. A higher adoption rate across smartwatches, patch monitors, and implantable cardiac monitors is anticipated, shifting volume away from traditional Holter monitoring systems.

During this period, growth was led by smartwatch-based detection systems, with Apple Watch and FDA-cleared devices like AliveCorKardiaMobile dominating the consumer and clinical segments. Global leaders such as iRhythm Technologies and Medtronic secured market leadership by developing clinically validated, AI-powered solutions with high sensitivity and specificity for atrial fibrillation detection.

Revenue concentration was observed in the wearable devices and implantable cardiac monitors segments, while smartphone-based applications and patch monitors showed rapid adoption rates. By 2025, the market is expected to pivot toward integrated healthcare platforms, real-time clinical decision support, and AI-enhanced diagnostic algorithms.

The revenue mix is projected to shift as continuous monitoring solutions grow faster than episodic detection devices, contributing to more comprehensive patient care across demographic groups. Competitive advantage is transitioning from device accuracy alone to ecosystem integration, encompassing clinical workflow optimization, remote patient management, and predictive analytics capabilities.

Why the Remote AF Detection Tools Market is growing?

The growth of the Remote AF Detection Tools Market is underpinned by a combination of clinical imperatives and technological innovations specifically tailored for atrial fibrillation management. AF remains one of the most common cardiac arrhythmias linked to a significant proportion of ischemic strokes globally, yet a substantial share of patients remain undiagnosed due to the intermittent and frequently asymptomatic presentation of the condition.

Remote detection devices address this critical gap by enabling continuous or frequent rhythm monitoring beyond traditional clinical environments, offering the potential for earlier diagnosis and timely therapeutic intervention.

The widespread adoption of telehealth accelerated by global health crises has further catalyzed remote cardiac monitoring deployment. Integration within comprehensive digital health platforms enables seamless sharing of cardiac data with clinicians, fostering closer patient-provider collaboration, better monitoring compliance, and more personalized disease management strategies.

Moreover, patient and provider awareness regarding the serious health risks posed by undiagnosed AF, balanced with the convenience and non-intrusive use of wearable devices, has reinforced demand. Collectively, these clinical and technological factors position the Remote AF Detection Tools Market for continued expansion as the convergence of healthcare delivery innovation and cardiovascular disease prevention unfolds.

Segmental Analysis

The market is segmented by technology, device, end-user, and region. Technology include ECG-Based Monitoring, PPG-Based Monitoring, Bioimpedance/Other Biosensorshighlighting the core elements driving adoption. By Devices includes Wearable Devices, Handheld Devices, Implantable Devices, Mobile-Connected ECG Monitors and Others. By Indication, the scope of the study includes Symptomatic AF, Asymptomatic/Subclinical AF, Post-Surgical/Post-Ablation AF and Screening in High-Risk Groups.

End User classification covers Hospitals & Cardiology Clinics, Ambulatory Surgical Centers (ASCs), Homecare Settings, Research & Academic Institutions. Regionally, the scope spans North America, Latin America, Western and Eastern Europe, East Asia, South Asia and Pacific, and the Middle East and Africa.Regionally, the scope spans North America, Latin America, Western and Eastern Europe, East Asia, South Asia and Pacific, and the Middle East and Africa.
Insights into the Technology Segment with ECG-Based Monitoring Leading the Demand

Remote Af Detection Tools Market 03

Technology Market Value Share, 2025
ECG-Based Monitoring 43.5%
PPG-Based Monitoring 27.3%
Bioimpedance/Other Biosensors 12.4%
Others 16.7%

The ECG-based monitoring segment has been projected to lead the market with a 43.5% share in 2025, and it continue to do so. The remote AF detection tools market is characterized by diverse technological platforms that reflect varied approaches to arrhythmia detection. Among these, ECG-based monitoring remains the cornerstone, providing gold-standard cardiac electrical activity measurements capable of precise arrhythmia diagnosis.

Photoplethysmography (PPG)-based monitoring devices have gained traction due to their integration in popular wearable technologies, offering non-invasive pulse waveform analysis that supports early detection of irregular heart rhythms with convenience, though with some limitations in specificity compared to ECG. Emerging biosensor technologies, including bioimpedance and other novel sensor modalities, are gradually entering the market, promising enhanced sensitivity and multi-parameter cardiac monitoring capabilities.
Insights into the Device Type Segment with Wearable DevicesDominating the Market

Remote Af Detection Tools Market 04

Device Type Market Value Share, 2025
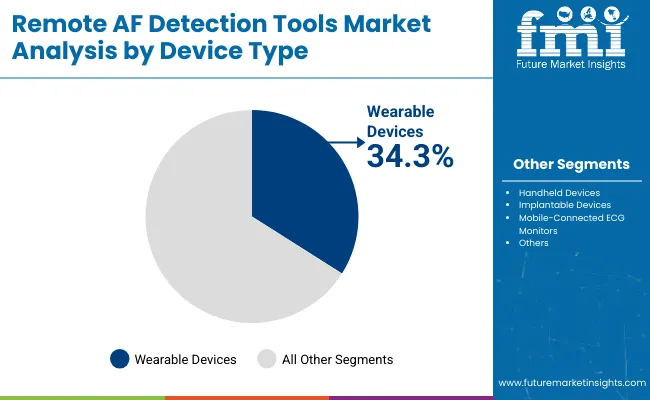
Wearable Devices 34.3%
Handheld Devices 21.6%
Implantable Devices 16.3%
Mobile-Connected ECG Monitors 12.3%
Others 15.4%

Device type segmentation highlights wearables as the primary growth factor with a 34.3% share in 2025, encompassing smartwatches, fitness bands, and patch monitors favored for their ease of use and continuous data capture. Handheld devices, often employing single-lead ECG recordings, facilitate spot checks and intermittent monitoring, especially valuable in clinical or home settings where continuous wear may not be feasible.

Implantable devices, while more invasive, offer unbeatable reliability and prolonged monitoring durations, playing a specialized role in patients requiring rigorous arrhythmia surveillance. Additionally, mobile-connected ECG monitors bridge clinical accuracy with patient mobility, enabling convenient cardiac assessments without sacrificing data quality.

What are the Drivers, Restraints, and Key Trends of the Remote AF Detection Tools Market?

The adoption of remote AF detection tools has been rapidly expanding, though certain scientific and commercial barriers remain. Rising consumer demand for cognitive enhancement is counterbalanced by formulation challenges, regulatory ambiguity, and varying awareness across global regions.

Robust Clinical Evidence Is Driving Confidence in Remote AF Detection

The expansion of the remote AF detection tools market is strongly supported by an increasing body of clinical evidence validating the effectiveness of remote monitoring devices. Peer-reviewed research and clinical trials confirm the ability of modern wearables, patch-based monitors, and ECG devices to accurately detect atrial fibrillation episodes, including asymptomatic cases that often go unnoticed in traditional clinical evaluations.

This foundation of trusted clinical data has accelerated acceptance among healthcare providers, leading to greater incorporation of remote AF detection into standard diagnostic and preventive cardiology protocols. Regulatory endorsements and guideline updates further solidify the role of these tools as reliable instruments for early AF identification and stroke risk reduction.

Growing Adoption of Clinician-Managed Remote Monitoring Pathways

A key growth driver for the remote AF detection tools market is the rising integration of these technologies within clinician-managed care frameworks. Cardiologists and specialized arrhythmia clinics are increasingly prescribing and overseeing remote AF monitoring, enabling personalized rhythm assessment and timely therapeutic decisions.

This proactive, practitioner-led model facilitates close monitoring of patients post-ablation or those at high risk, improving management outcomes and patient engagement. Strategic collaborations between device developers and healthcare institutions are expanding digital infrastructure to support seamless data sharing and clinical workflow integration. This trend highlights the critical role of healthcare professionals in driving long-term adoption and maximizing the clinical benefits of remote AF detection technologies.
Analysis of Remote AF Detection Tools Market, By Key Countries

Remote Af Detection Tools Market 02

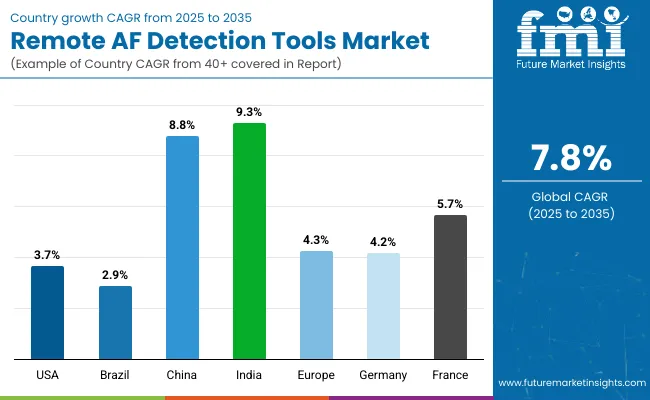
Countries CAGR
United States 3.7%
Brazil 2.9%
China 8.8%
India 9.3%
Europe 4.3%
Germany 4.2%
France 5.7%

The Remote AF Detection Tools Market displays significant variability in adoption and growth rates across different countries, shaped by healthcare infrastructure, technological readiness, and national health priorities.

In the United States, established digital health ecosystems and strong physician engagement have positioned the country at the forefront of remote AF detection, with continuous growth projected at a CAGR of 3.7%. The high prevalence of atrial fibrillation, robust research activity surrounding wearable ECG and patch monitors, and supportive reimbursement structures all contribute to this steady market expansion. United States clinical practice remains highly receptive to remote monitoring innovations as part of routine arrhythmia management and post-stroke prevention.

Across Europe, the market is expected to grow at a CAGR of 4.3%. National health systems, especially in countries such as Germany (4.2% CAGR) and France (5.7% CAGR), have embraced remote AF detection as part of comprehensive cardiac care and stroke prevention efforts.

Regulatory clarity and ongoing clinical trials advance the adoption of remote monitoring solutions, while regional initiatives promote integrated digital health applications across hospital and ambulatory care settings. In France, higher growth reflects strong investment in telemedicine and public health innovation, with widespread inclusion of digital tools in cardiac arrhythmia management protocols.

Sales Outlook for Remote AF Detection Tools in the United States

Year USA
2025 393.9
2026 407.9
2027 422.5
2028 437.9
2029 453.9
2030 470.6
2031 487.9
2032 505.9
2033 525.2
2034 545.5
2035 566.5

The remote AF detection tools market in the United States has been forecasted to expand at a CAGR of 3.7% between 2025 and 2035. This growth is fueled by widespread adoption of remote monitoring for early arrhythmia detection, addressing the needs of both aging populations and individuals at elevated cardiovascular risk.

Clinical validation of wearable ECG and advanced monitoring technologies has received strong recognition among United States-based cardiologists, streamlining integration into preventive care and chronic disease management pathways.

Digital health platforms and virtual cardiac care clinics have played a pivotal role in personalizing arrhythmia management protocols, with remote AF detection tools now supporting a range of patient scenarios from home-based screening to hospital-led post-procedural surveillance.

The United States market has further benefited from a shift toward consumer-directed, non-invasive cardiac monitoring, meeting growing demand for continuous and accessible rhythm assessment outside traditional care settings.

  • Clinician-guided remote AF monitoring is being widely adopted in specialty cardiology and electrophysiology practices, enabling data-driven therapeutic decisions and improved patient engagement.
  • Direct-to-consumer channels, including telehealth platforms and online retailers, are making wearable ECG and smart monitoring devices increasingly available to a broader segment of the population.
  • Enhanced focus on device usability, digital integration, and real-time alert features is elevating compliance and accelerating mainstream adoption of remote AF detection technology in the United States.

Growth and Expansion Outlook for Remote AF Detection Tools Market in the United Kingdom

The remote AF detection tools market in the United Kingdom is projected to grow at a CAGR of 5.0% during 2025-2035 driven by government initiatives aimed at reducing stroke incidence via early AF detection. Increased integration of remote monitoring technology within NHS pathways and cardiac rehabilitation programs has enhanced access for both urban and rural populations.

Furthermore, digital transformation efforts within the UK healthcare system have boosted adoption of telecardiology and home-based monitoring, supporting seamless data sharing between patients and care teams.

  • Expansion of telehealth services and remote specialist consultations are facilitating wider use of AF detection devices in primary care and community settings.
  • Public health campaigns raising awareness of AF risks are encouraging proactive cardiac monitoring, especially among older adults and those with comorbidities.
  • Investments in AI-powered arrhythmia detection software and integrated digital health platforms are improving diagnostic accuracy and clinical workflow efficiency in the UK market.

Growth and Expansion Outlook for Remote AF Detection Tools Market in India

India’s remote AF detection tools market is expected to grow at a CAGR of 9.3% between 2025 and 2035, propelled by increasing cardiovascular disease prevalence and rising digital health penetration. Urban centers with advanced healthcare infrastructure are adopting mobile ECG and wearable devices at a fast pace.

Additionally, the rise of health-tech startups and e-pharmacies has cultivated a nascent but expanding consumer base for remote cardiac monitoring technologies. However, rural healthcare access and AF awareness remain challenges for market expansion.

  • Growing smartphone adoption combined with affordable wearable technologies supports remote AF detection among middle-class and younger populations.
  • Private hospitals and cardiac specialty clinics are leading early adoption, using mobile-connected devices to complement episodic clinical visits.
  • Government initiatives promoting telemedicine and chronic disease management are expected to enhance outreach and scalability of remote AF monitoring programs in India.

Sales Outlook for Remote AF Detection Tools in China

China’s remote AF detection tools market is projected to expand at a CAGR of 8.8% from 2025 to 2035. China is emerging as one of the fastest-growing markets for Remote AF Detection Tools due to government-backed digital health policies and expanding urban healthcare infrastructure.

Large-scale public health programs targeting cardiovascular disease screenings have incorporated remote ECG monitoring as a scalable solution. Moreover, domestic medical device manufacturers are innovating cost-effective remote AF detection products, increasing accessibility across varying income groups.

  • Integration of remote AF detection into community health screening and elderly care programs is facilitating early diagnosis at a population scale.
  • Strong collaborations between local tech companies and hospitals are driving innovation in wearable design and data analytics tailored to Chinese regulatory standards.
  • Rapid growth of telemedicine platforms in tier 1 and tier 2 cities is boosting real-time remote monitoring uptake among aging urban populations.

In-depth Analysis of Remote AF Detection Tools in Germany

The Remote AF Detection Tools Market in Germany is forecasted to achieve a CAGR of 4.2% between 2025 and 2035. Germany’s Remote AF Detection Tools Market is benefiting from a well-established healthcare system that prioritizes preventive cardiology and digital health integration.

A growing focus on outpatient management of chronic conditions is creating demand for continuous remote rhythm assessment technologies. High clinician trust in validated ECG monitoring devices and reimbursement support are key enablers for market growth, alongside patient preference for non-invasive cardiovascular monitoring methods.

  • Expansion of cardiac rehabilitation centers and ambulatory care programs is increasing demand for patch-based and wearable ECG devices.
  • Health insurance providers are gradually including remote AF monitoring within reimbursed preventive care packages, stimulating uptake.
  • Germany’s strong medical research ecosystem supports continuous innovation and real-world validation of advanced arrhythmia detection algorithms.

Growth Outlook for Remote AF Detection Tools Market in Japan

Technology 2025 Share (%)
ECG-Based Monitoring 43.5%
PPG-Based Monitoring 29.3%
Bioimpedance/Other Biosensors 10.4%
Others 16.7%

The remote AF detection tools market in Japan has been projected to reach USD 49.3 million by 2025. ECH-based monitoring leads the technology landscape with a 43.5% share, followed by PPG-based monitoring and bioimpedance/otherbiosensors at 29.3% & 10.4% respectively. Japan’s market growth for Remote AF Detection Tools is primarily driven by an aging population with a high burden of cardiovascular disease and proactive governmental health policies.

Remote monitoring technologies are increasingly integrated into both preventive health checkups and post-stroke follow-up care. Consumer acceptance of wearable medical devices is relatively high due to cultural emphasis on technological health solutions and longevity.

  • National healthcare programs promote routine heart rhythm screening in elderly populations utilizing wearable and patch-based monitoring systems.
  • Clinics specializing in electrophysiology are adopting continuous remote monitoring to improve post-ablation surveillance and recurrence detection.
  • Rising collaboration between device manufacturers and eldercare service providers fosters development of user-friendly, elder-centric remote monitoring devices.

Opportunity Analysis of South Korea Remote AF Detection Tools Market

End User Market Value Share, 2025
Hospitals & Cardiology Clinics 33.3%
Ambulatory Surgical Centers (ASCs) 29.4%
Homecare Settings 19.5%
Research & Academic Institutions 11.4%
Telehealth Providers 6.4%

The remote AF detection tools market in South Korea has been projected to reach USD 35.4 million in 2025. Hospitals & Cardiology Clinics are expected to lead distribution with a 33.3% share, followed ambulatory surgical centers (29.4%) and homecare settings (19.5%). South Korea’s remote AF detection market is growing fast, supported by one of the world’s most digitally connected populations and advanced telehealth infrastructure.

Government policies emphasize early disease detection and management through smart health technologies, accelerating adoption across clinical and consumer segments. The country’s strong technology manufacturing base also contributes to locally produced innovative wearable cardiac monitors.
  • High smartphone penetration facilitates broad dissemination of mobile-connected AF detection devices and associated health apps.
  • Integration with national health databases enables clinicians to remotely monitor at-risk patients and promptly adjust treatment plans.
  • Consumer interest in personalized health monitoring fosters acceptance of wearable ECG devices, particularly among working professionals and health-conscious adults.

Competitive Landscape of Remote AF Detection Tools Market

Remote Af Detection Tools Market 05

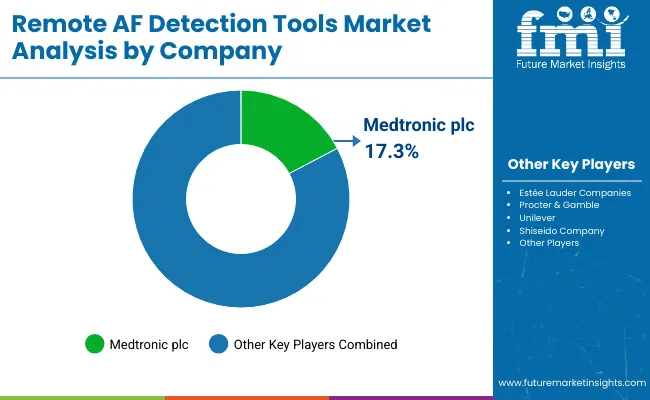
The remote AF detection tools market is consolidated, defined by a multi-tier structure that includes global technology leaders, mid‑sized innovators, and niche digital health specialists. Companies such as Medtronic, Philips, and iRhythm Technologies have established leadership by leveraging clinically validated remote monitoring portfolios, extensive R&D investment, and strategic collaborations with healthcare systems. These firms have built strong reputations through device approvals, large-scale clinical trials, and close integration with telehealth and electronic health record platforms.

Mid‑sized innovatorsincluding AliveCor, Qardio, and others are gaining traction by introducing wearable ECG devices, smart patches, and AI-powered arrhythmia analysis apps. Their ability to rapidly iterate on product design, focus on user-friendly interfaces, and build partnerships with mobile health and pharmacy chains has contributed to regional expansion, especially in consumer-oriented and ambulatory care settings.

Niche specialists such as Bardy Diagnostics, ATsens, and certain regional startups excel in producing highly specialized remote AF detection solutions such as ultra-lightweight continuous monitors or software-driven analytics for post-surgical care. These companies often focus on targeted populations, including post-ablation patients or those requiring high-frequency monitoring, and tailor their offerings for integration within specific clinical workflows.

Market differentiation is increasingly built around ecosystem value; companies are enhancing competitive positioning by embedding secure cloud platforms, enabling direct-to-clinician data transfer, providing customizable digital dashboards, and integrating with broader remote patient monitoring suites.

Key Developments in Remote AF Detection Tools Market

  • In 2024, Apple won FDA approval for its AFib detection tool on its Apple Watch. It was the first digital health technology that qualified under the Medical Device Development Tools program.
  • In 2024, Tempus Receives U.S. FDA 510(k) Clearance for Tempus ECG-AF, an AI-based Algorithm that Identifies Patients at Increased Risk of AFib.

Scope of the Report

Item Value
Quantitative Units USD 1,189.7 million
Technology ECG-Based Monitoring, PPG-Based Monitoring, Bioimpedance/Other Biosensors and Others
Device Type Wearable Devices, Handheld Devices, Implantable Devices, Mobile-Connected ECG Monitors and Others
Indication Type Symptomatic AF, Asymptomatic/Subclinical AF, Post-Surgical/Post-Ablation AF and Screening in High-Risk Groups
End User Hospitals & Cardiology Clinics, Ambulatory Surgical Centers (ASCs), Homecare Settings, Research & Academic Institutions and Telehealth Providers
Regions Covered North America, Latin America, Western Europe, Eastern Europe, East Asia, South Asia & Pacific, Middle East & Africa
Countries Covered USA, Brazil, China, India, Europe, Germany, France and UK
Key Companies Profiled Medtronic plc, Abbott Laboratories, Boston Scientific Corporation, iRhythm Technologies, Philips Healthcare, GE Healthcare, Siemens Healthineers, AliveCor, Qardio, Bardy Diagnostics , ATsens and Others

Key Segments

By Technology:

  • ECG-Based Monitoring
  • PPG-Based Monitoring
  • Bioimpedance/Other Biosensors
  • Others

By Device Type:

  • Wearable Devices
  • Handheld Devices
  • Implantable Devices
  • Mobile-Connected ECG Monitors
  • Others

By Indication Type:

  • Symptomatic AF
  • Asymptomatic/Subclinical AF
  • Post-Surgical/Post-Ablation AF
  • Screening in High-Risk Groups

By End User:

  • Hospitals & Cardiology Clinics
  • Ambulatory Surgical Centers (ASCs)
  • Homecare Settings
  • Research & Academic Institutions
  • Telehealth Providers

By Region:

  • North America
  • Latin America
  • Western Europe
  • Eastern Europe
  • East Asia
  • South Asia
  • MEA

Table of Content

  1. Executive Summary
    • Global Market Outlook
    • Demand-side Trends
    • Supply-side Trends
    • Technology Roadmap Analysis
    • Analysis and Recommendations
  2. Market Overview
    • Market Coverage / Taxonomy
    • Market Definition / Scope / Limitations
  3. Market Background
    • Market Dynamics
      • Drivers
      • Restraints
      • Opportunity
      • Trends
    • Scenario Forecast
      • Demand in Optimistic Scenario
      • Demand in Likely Scenario
      • Demand in Conservative Scenario
    • Opportunity Map Analysis
    • Product Life Cycle Analysis
    • Supply Chain Analysis
      • Supply Side Participants and their Roles
        • Producers
        • Mid-Level Participants (Traders/ Agents/ Brokers)
        • Wholesalers and Distributors
      • Value Added and Value Created at Node in the Supply Chain
      • List of Existing and Potential Buyer’s
    • Investment Feasibility Matrix
    • Value Chain Analysis
      • Profit Margin Analysis
      • Wholesalers and Distributors
      • Retailers
    • PESTLE and Porter’s Analysis
    • Regulatory Landscape
      • By Key Regions
      • By Key Countries
    • Regional Parent Market Outlook
    • Production and Consumption Statistics
    • Import and Export Statistics
  4. Global Remote AF Detection Tools Market Analysis 2020-2024 and Forecast, 2025-2035
    • Historical Market Size Value (US$ Mn) & Volume (Units) Analysis, 2020-2024
    • Current and Future Market Size Value (US$ Mn) & Volume (Units) Projections, 2025-2035
      • Y-o-Y Growth Trend Analysis
      • Absolute $ Opportunity Analysis
  5. Global Remote AF Detection Tools Market Analysis 2020-2024 and Forecast 2025-2035, By Technology
    • Introduction / Key Findings
    • Historical Market Size Value (US$ Mn) & Volume (Units) Analysis By Technology, 2020-2024
    • Current and Future Market Size Value (US$ Mn) & Volume (Units) Analysis and Forecast By Technology, 2025-2035
      • ECG-Based Monitoring
      • PPG-Based Monitoring
      • Bioimpedance/Other Biosensors
      • Others
    • Y-o-Y Growth Trend Analysis By Technology, 2020-2024
    • Absolute $ Opportunity Analysis By Technology, 2025-2035
  6. Global Remote AF Detection Tools Market Analysis 2020-2024 and Forecast 2025-2035, By Device Type
    • Introduction / Key Findings
    • Historical Market Size Value (US$ Mn) & Volume (Units) Analysis By Device Type, 2020-2024
    • Current and Future Market Size Value (US$ Mn) & Volume (Units) Analysis and Forecast By Device Type, 2025-2035
      • Wearable Devices
      • Handheld Devices
      • Implantable Devices
      • Mobile-Connected ECG Monitors
      • Others
    • Y-o-Y Growth Trend Analysis By Device Type, 2020-2024
    • Absolute $ Opportunity Analysis By Device Type, 2025-2035
  7. Global Remote AF Detection Tools Market Analysis 2020-2024 and Forecast 2025-2035, By Indication Type
    • Introduction / Key Findings
    • Historical Market Size Value (US$ Mn) & Volume (Units) Analysis By Indication Type, 2020-2024
    • Current and Future Market Size Value (US$ Mn) & Volume (Units) Analysis and Forecast By Indication Type, 2025-2035
      • Symptomatic AF
      • Asymptomatic/Subclinical AF
      • Post-Surgical/Post-Ablation AF
      • Screening in High-Risk Groups
    • Y-o-Y Growth Trend Analysis By Indication Type, 2020-2024
    • Absolute $ Opportunity Analysis By Indication Type, 2025-2035
  8. Global Remote AF Detection Tools Market Analysis 2020-2024 and Forecast 2025-2035, By End User
    • Introduction / Key Findings
    • Historical Market Size Value (US$ Mn) & Volume (Units) Analysis By End User, 2020-2024
    • Current and Future Market Size Value (US$ Mn) & Volume (Units) Analysis and Forecast By End User, 2025-2035
      • Hospitals & Cardiology Clinics
      • Ambulatory Surgical Centers (ASCs)
      • Homecare Settings
      • Research & Academic Institutions
      • Telehealth Providers
    • Y-o-Y Growth Trend Analysis By End User, 2020-2024
    • Absolute $ Opportunity Analysis By End User, 2025-2035
  9. Global Remote AF Detection Tools Market Analysis 2020-2024 and Forecast 2025-2035, By Region
    • Introduction
    • Historical Market Size Value (US$ Mn) & Volume (Units) Analysis By Region, 2020-2024
    • Current Market Size Value (US$ Mn) & Volume (Units) Analysis and Forecast By Region, 2025-2035
      • North America
      • Latin America
      • Western Europe
      • Eastern Europe
      • East Asia
      • South Asia
      • MEA
    • Market Attractiveness Analysis By Region
  10. North America Remote AF Detection Tools Market Analysis 2020-2024 and Forecast 2025-2035, By Country
    • Historical Market Size Value (US$ Mn) & Volume (Units) Trend Analysis By Market Taxonomy, 2020-2024
    • Market Size Value (US$ Mn) & Volume (Units) Forecast By Market Taxonomy, 2025-2035
      • By Country
        • U.S.
        • Canada
        • Mexico
      • By Technology
      • By Device Type
      • By Indication Type
      • By End User
    • Market Attractiveness Analysis
      • By Country
      • By Technology
      • By Device Type
      • By Indication Type
      • By End User
    • Key Takeaways
  11. Latin America Remote AF Detection Tools Market Analysis 2020-2024 and Forecast 2025-2035, By Country
    • Historical Market Size Value (US$ Mn) & Volume (Units) Trend Analysis By Market Taxonomy, 2020-2024
    • Market Size Value (US$ Mn) & Volume (Units) Forecast By Market Taxonomy, 2025-2035
      • By Country
        • Brazil
        • Argentina
        • Rest of Latin America
      • By Technology
      • By Device Type
      • By Indication Type
      • By End User
    • Market Attractiveness Analysis
      • By Country
      • By Technology
      • By Device Type
      • By Indication Type
      • By End User
    • Key Takeaways
  12. Western Europe Remote AF Detection Tools Market Analysis 2020-2024 and Forecast 2025-2035, By Country
    • Historical Market Size Value (US$ Mn) & Volume (Units) Trend Analysis By Market Taxonomy, 2020-2024
    • Market Size Value (US$ Mn) & Volume (Units) Forecast By Market Taxonomy, 2025-2035
      • By Country
        • Germany
        • Italy
        • France
        • U.K.
        • Spain
        • BENELUX
        • Nordic Countries
        • Rest of Western Europe
      • By Technology
      • By Device Type
      • By Indication Type
      • By End User
    • Market Attractiveness Analysis
      • By Country
      • By Technology
      • By Device Type
      • By Indication Type
      • By End User
    • Key Takeaways
  13. Eastern Europe Remote AF Detection Tools Market Analysis 2020-2024 and Forecast 2025-2035, By Country
    • Historical Market Size Value (US$ Mn) & Volume (Units) Trend Analysis By Market Taxonomy, 2020-2024
    • Market Size Value (US$ Mn) & Volume (Units) Forecast By Market Taxonomy, 2025-2035
      • By Country
        • Russia
        • Hungary
        • Poland
        • Rest of Eastern Europe
      • By Technology
      • By Device Type
      • By Indication Type
      • By End User
    • Market Attractiveness Analysis
      • By Country
      • By Technology
      • By Device Type
      • By Indication Type
      • By End User
    • Key Takeaways
  14. East Asia Remote AF Detection Tools Market Analysis 2020-2024 and Forecast 2025-2035, By Country
    • Historical Market Size Value (US$ Mn) & Volume (Units) Trend Analysis By Market Taxonomy, 2020-2024
    • Market Size Value (US$ Mn) & Volume (Units) Forecast By Market Taxonomy, 2025-2035
      • By Country
        • China
        • Japan
        • South Korea
      • By Technology
      • By Device Type
      • By Indication Type
      • By End User
    • Market Attractiveness Analysis
      • By Country
      • By Technology
      • By Device Type
      • By Indication Type
      • By End User
    • Key Takeaways
  15. South Asia Remote AF Detection Tools Market Analysis 2020-2024 and Forecast 2025-2035, By Country
    • Historical Market Size Value (US$ Mn) & Volume (Units) Trend Analysis By Market Taxonomy, 2020-2024
    • Market Size Value (US$ Mn) & Volume (Units) Forecast By Market Taxonomy, 2025-2035
      • By Country
        • India
        • ASEAN Countries
        • Australia & New Zealand
        • Rest of South Asia
      • By Technology
      • By Device Type
      • By Indication Type
      • By End User
    • Market Attractiveness Analysis
      • By Country
      • By Technology
      • By Device Type
      • By Indication Type
      • By End User
    • Key Takeaways
  16. MEA Remote AF Detection Tools Market Analysis 2020-2024 and Forecast 2025-2035, By Country
    • Historical Market Size Value (US$ Mn) & Volume (Units) Trend Analysis By Market Taxonomy, 2020-2024
    • Market Size Value (US$ Mn) & Volume (Units) Forecast By Market Taxonomy, 2025-2035
      • By Country
        • Saudi Arabia
        • Türkiye
        • South Africa
        • Other African Union
        • Rest of MEA
      • By Technology
      • By Device Type
      • By Indication Type
      • By End User
    • Market Attractiveness Analysis
      • By Country
      • By Technology
      • By Device Type
      • By Indication Type
      • By End User
    • Key Takeaways
  17. Key Countries Remote AF Detection Tools Market Analysis
    • U.S.
      • Pricing Analysis
      • Market Share Analysis, 2024
        • By Technology
        • By Device Type
        • By Indication Type
        • By End User
    • Brazil
      • Pricing Analysis
      • Market Share Analysis, 2024
        • By Technology
        • By Device Type
        • By Indication Type
        • By End User
    • China
      • Pricing Analysis
      • Market Share Analysis, 2024
        • By Technology
        • By Device Type
        • By Indication Type
        • By End User
    • India
      • Pricing Analysis
      • Market Share Analysis, 2024
        • By Technology
        • By Device Type
        • By Indication Type
        • By End User
    • Europe
      • Pricing Analysis
      • Market Share Analysis, 2024
        • By Technology
        • By Device Type
        • By Indication Type
        • By End User
    • Germany
      • Pricing Analysis
      • Market Share Analysis, 2024
        • By Technology
        • By Device Type
        • By Indication Type
        • By End User
    • France
      • Pricing Analysis
      • Market Share Analysis, 2024
        • By Technology
        • By Device Type
        • By Indication Type
        • By End User
    • U.K.
      • Pricing Analysis
      • Market Share Analysis, 2024
        • By Technology
        • By Device Type
        • By Indication Type
        • By End User
  18. Market Structure Analysis
    • Competition Dashboard
    • Competition Benchmarking
    • Market Share Analysis of Top Players
      • By Regional
      • By Technology
      • By Device Type
      • By Indication Type
      • By End User
  19. Competition Analysis
    • Competition Deep Dive
      • Abbott Laboratories
        • Overview
        • Product Portfolio
        • Profitability by Market Segments (Product/Age /Sales Channel/Region)
        • Sales Footprint
        • Strategy Overview
          • Marketing Strategy
          • Product Strategy
          • Channel Strategy
      • Boston Scientific Corporation
        • Overview
        • Product Portfolio
        • Profitability by Market Segments (Product/Age /Sales Channel/Region)
        • Sales Footprint
        • Strategy Overview
          • Marketing Strategy
          • Product Strategy
          • Channel Strategy
      • iRhythm Technologies
        • Overview
        • Product Portfolio
        • Profitability by Market Segments (Product/Age /Sales Channel/Region)
        • Sales Footprint
        • Strategy Overview
          • Marketing Strategy
          • Product Strategy
          • Channel Strategy
      • Philips Healthcare
        • Overview
        • Product Portfolio
        • Profitability by Market Segments (Product/Age /Sales Channel/Region)
        • Sales Footprint
        • Strategy Overview
          • Marketing Strategy
          • Product Strategy
          • Channel Strategy
      • GE Healthcare
        • Overview
        • Product Portfolio
        • Profitability by Market Segments (Product/Age /Sales Channel/Region)
        • Sales Footprint
        • Strategy Overview
          • Marketing Strategy
          • Product Strategy
          • Channel Strategy
      • Siemens Healthineers
        • Overview
        • Product Portfolio
        • Profitability by Market Segments (Product/Age /Sales Channel/Region)
        • Sales Footprint
        • Strategy Overview
          • Marketing Strategy
          • Product Strategy
          • Channel Strategy
      • AliveCor
        • Overview
        • Product Portfolio
        • Profitability by Market Segments (Product/Age /Sales Channel/Region)
        • Sales Footprint
        • Strategy Overview
          • Marketing Strategy
          • Product Strategy
          • Channel Strategy
      • Qardio
        • Overview
        • Product Portfolio
        • Profitability by Market Segments (Product/Age /Sales Channel/Region)
        • Sales Footprint
        • Strategy Overview
          • Marketing Strategy
          • Product Strategy
          • Channel Strategy
      • Bardy Diagnostics
        • Overview
        • Product Portfolio
        • Profitability by Market Segments (Product/Age /Sales Channel/Region)
        • Sales Footprint
        • Strategy Overview
          • Marketing Strategy
          • Product Strategy
          • Channel Strategy
      • ATsens
        • Overview
        • Product Portfolio
        • Profitability by Market Segments (Product/Age /Sales Channel/Region)
        • Sales Footprint
        • Strategy Overview
          • Marketing Strategy
          • Product Strategy
          • Channel Strategy
      • Others
        • Overview
        • Product Portfolio
        • Profitability by Market Segments (Product/Age /Sales Channel/Region)
        • Sales Footprint
        • Strategy Overview
          • Marketing Strategy
          • Product Strategy
          • Channel Strategy
  20. Assumptions & Acronyms Used
  21. Research Methodology

List of Tables

  • Table 1: Global Market Value (USD Million) Forecast by Region, 2020-2035
  • Table 2: Global Market Volume (Units) Forecast by Region, 2020-2035
  • Table 3: Global Market Value (USD Million) Forecast by Technology, 2020-2035
  • Table 4: Global Market Volume (Units) Forecast by Technology, 2020-2035
  • Table 5: Global Market Value (USD Million) Forecast by Device Type, 2020-2035
  • Table 6: Global Market Volume (Units) Forecast by Device Type, 2020-2035
  • Table 7: Global Market Value (USD Million) Forecast by Indication Type, 2020-2035
  • Table 8: Global Market Volume (Units) Forecast by Indication Type, 2020-2035
  • Table 9: Global Market Value (USD Million) Forecast by End User, 2020-2035
  • Table 10: Global Market Volume (Units) Forecast by End User, 2020-2035
  • Table 11: North America Market Value (USD Million) Forecast by Country, 2020-2035
  • Table 12: North America Market Volume (Units) Forecast by Country, 2020-2035
  • Table 13: North America Market Value (USD Million) Forecast by Technology, 2020-2035
  • Table 14: North America Market Volume (Units) Forecast by Technology, 2020-2035
  • Table 15: North America Market Value (USD Million) Forecast by Device Type, 2020-2035
  • Table 16: North America Market Volume (Units) Forecast by Device Type, 2020-2035
  • Table 17: North America Market Value (USD Million) Forecast by Indication Type, 2020-2035
  • Table 18: North America Market Volume (Units) Forecast by Indication Type, 2020-2035
  • Table 19: North America Market Value (USD Million) Forecast by End User, 2020-2035
  • Table 20: North America Market Volume (Units) Forecast by End User, 2020-2035
  • Table 21: Latin America Market Value (USD Million) Forecast by Country, 2020-2035
  • Table 22: Latin America Market Volume (Units) Forecast by Country, 2020-2035
  • Table 23: Latin America Market Value (USD Million) Forecast by Technology, 2020-2035
  • Table 24: Latin America Market Volume (Units) Forecast by Technology, 2020-2035
  • Table 25: Latin America Market Value (USD Million) Forecast by Device Type, 2020-2035
  • Table 26: Latin America Market Volume (Units) Forecast by Device Type, 2020-2035
  • Table 27: Latin America Market Value (USD Million) Forecast by Indication Type, 2020-2035
  • Table 28: Latin America Market Volume (Units) Forecast by Indication Type, 2020-2035
  • Table 29: Latin America Market Value (USD Million) Forecast by End User, 2020-2035
  • Table 30: Latin America Market Volume (Units) Forecast by End User, 2020-2035
  • Table 31: Western Europe Market Value (USD Million) Forecast by Country, 2020-2035
  • Table 32: Western Europe Market Volume (Units) Forecast by Country, 2020-2035
  • Table 33: Western Europe Market Value (USD Million) Forecast by Technology, 2020-2035
  • Table 34: Western Europe Market Volume (Units) Forecast by Technology, 2020-2035
  • Table 35: Western Europe Market Value (USD Million) Forecast by Device Type, 2020-2035
  • Table 36: Western Europe Market Volume (Units) Forecast by Device Type, 2020-2035
  • Table 37: Western Europe Market Value (USD Million) Forecast by Indication Type, 2020-2035
  • Table 38: Western Europe Market Volume (Units) Forecast by Indication Type, 2020-2035
  • Table 39: Western Europe Market Value (USD Million) Forecast by End User, 2020-2035
  • Table 40: Western Europe Market Volume (Units) Forecast by End User, 2020-2035
  • Table 41: Eastern Europe Market Value (USD Million) Forecast by Country, 2020-2035
  • Table 42: Eastern Europe Market Volume (Units) Forecast by Country, 2020-2035
  • Table 43: Eastern Europe Market Value (USD Million) Forecast by Technology, 2020-2035
  • Table 44: Eastern Europe Market Volume (Units) Forecast by Technology, 2020-2035
  • Table 45: Eastern Europe Market Value (USD Million) Forecast by Device Type, 2020-2035
  • Table 46: Eastern Europe Market Volume (Units) Forecast by Device Type, 2020-2035
  • Table 47: Eastern Europe Market Value (USD Million) Forecast by Indication Type, 2020-2035
  • Table 48: Eastern Europe Market Volume (Units) Forecast by Indication Type, 2020-2035
  • Table 49: Eastern Europe Market Value (USD Million) Forecast by End User, 2020-2035
  • Table 50: Eastern Europe Market Volume (Units) Forecast by End User, 2020-2035
  • Table 51: East Asia Market Value (USD Million) Forecast by Country, 2020-2035
  • Table 52: East Asia Market Volume (Units) Forecast by Country, 2020-2035
  • Table 53: East Asia Market Value (USD Million) Forecast by Technology, 2020-2035
  • Table 54: East Asia Market Volume (Units) Forecast by Technology, 2020-2035
  • Table 55: East Asia Market Value (USD Million) Forecast by Device Type, 2020-2035
  • Table 56: East Asia Market Volume (Units) Forecast by Device Type, 2020-2035
  • Table 57: East Asia Market Value (USD Million) Forecast by Indication Type, 2020-2035
  • Table 58: East Asia Market Volume (Units) Forecast by Indication Type, 2020-2035
  • Table 59: East Asia Market Value (USD Million) Forecast by End User, 2020-2035
  • Table 60: East Asia Market Volume (Units) Forecast by End User, 2020-2035
  • Table 61: South Asia Market Value (USD Million) Forecast by Country, 2020-2035
  • Table 62: South Asia Market Volume (Units) Forecast by Country, 2020-2035
  • Table 63: South Asia Market Value (USD Million) Forecast by Technology, 2020-2035
  • Table 64: South Asia Market Volume (Units) Forecast by Technology, 2020-2035
  • Table 65: South Asia Market Value (USD Million) Forecast by Device Type, 2020-2035
  • Table 66: South Asia Market Volume (Units) Forecast by Device Type, 2020-2035
  • Table 67: South Asia Market Value (USD Million) Forecast by Indication Type, 2020-2035
  • Table 68: South Asia Market Volume (Units) Forecast by Indication Type, 2020-2035
  • Table 69: South Asia Market Value (USD Million) Forecast by End User, 2020-2035
  • Table 70: South Asia Market Volume (Units) Forecast by End User, 2020-2035
  • Table 71: MEA Market Value (USD Million) Forecast by Country, 2020-2035
  • Table 72: MEA Market Volume (Units) Forecast by Country, 2020-2035
  • Table 73: MEA Market Value (USD Million) Forecast by Technology, 2020-2035
  • Table 74: MEA Market Volume (Units) Forecast by Technology, 2020-2035
  • Table 75: MEA Market Value (USD Million) Forecast by Device Type, 2020-2035
  • Table 76: MEA Market Volume (Units) Forecast by Device Type, 2020-2035
  • Table 77: MEA Market Value (USD Million) Forecast by Indication Type, 2020-2035
  • Table 78: MEA Market Volume (Units) Forecast by Indication Type, 2020-2035
  • Table 79: MEA Market Value (USD Million) Forecast by End User, 2020-2035
  • Table 80: MEA Market Volume (Units) Forecast by End User, 2020-2035

List of Figures

  • Figure 1: Global Market Value (USD Million) by Technology, 2025-2035
  • Figure 2: Global Market Value (USD Million) by Device Type, 2025-2035
  • Figure 3: Global Market Value (USD Million) by Indication Type, 2025-2035
  • Figure 4: Global Market Value (USD Million) by End User, 2025-2035
  • Figure 5: Global Market Value (USD Million) by Region, 2025-2035
  • Figure 6: Global Market Value (USD Million) Analysis by Region, 2020-2035
  • Figure 7: Global Market Volume (Units) Analysis by Region, 2020-2035
  • Figure 8: Global Market Value Share (%) and BPS Analysis by Region, 2025-2035
  • Figure 9: Global Market Y-o-Y Growth (%) Projections by Region, 2025-2035
  • Figure 10: Global Market Value (USD Million) Analysis by Technology, 2020-2035
  • Figure 11: Global Market Volume (Units) Analysis by Technology, 2020-2035
  • Figure 12: Global Market Value Share (%) and BPS Analysis by Technology, 2025-2035
  • Figure 13: Global Market Y-o-Y Growth (%) Projections by Technology, 2025-2035
  • Figure 14: Global Market Value (USD Million) Analysis by Device Type, 2020-2035
  • Figure 15: Global Market Volume (Units) Analysis by Device Type, 2020-2035
  • Figure 16: Global Market Value Share (%) and BPS Analysis by Device Type, 2025-2035
  • Figure 17: Global Market Y-o-Y Growth (%) Projections by Device Type, 2025-2035
  • Figure 18: Global Market Value (USD Million) Analysis by Indication Type, 2020-2035
  • Figure 19: Global Market Volume (Units) Analysis by Indication Type, 2020-2035
  • Figure 20: Global Market Value Share (%) and BPS Analysis by Indication Type, 2025-2035
  • Figure 21: Global Market Y-o-Y Growth (%) Projections by Indication Type, 2025-2035
  • Figure 22: Global Market Value (USD Million) Analysis by End User, 2020-2035
  • Figure 23: Global Market Volume (Units) Analysis by End User, 2020-2035
  • Figure 24: Global Market Value Share (%) and BPS Analysis by End User, 2025-2035
  • Figure 25: Global Market Y-o-Y Growth (%) Projections by End User, 2025-2035
  • Figure 26: Global Market Attractiveness by Technology, 2025-2035
  • Figure 27: Global Market Attractiveness by Device Type, 2025-2035
  • Figure 28: Global Market Attractiveness by Indication Type, 2025-2035
  • Figure 29: Global Market Attractiveness by End User, 2025-2035
  • Figure 30: Global Market Attractiveness by Region, 2025-2035
  • Figure 31: North America Market Value (USD Million) by Technology, 2025-2035
  • Figure 32: North America Market Value (USD Million) by Device Type, 2025-2035
  • Figure 33: North America Market Value (USD Million) by Indication Type, 2025-2035
  • Figure 34: North America Market Value (USD Million) by End User, 2025-2035
  • Figure 35: North America Market Value (USD Million) by Country, 2025-2035
  • Figure 36: North America Market Value (USD Million) Analysis by Country, 2020-2035
  • Figure 37: North America Market Volume (Units) Analysis by Country, 2020-2035
  • Figure 38: North America Market Value Share (%) and BPS Analysis by Country, 2025-2035
  • Figure 39: North America Market Y-o-Y Growth (%) Projections by Country, 2025-2035
  • Figure 40: North America Market Value (USD Million) Analysis by Technology, 2020-2035
  • Figure 41: North America Market Volume (Units) Analysis by Technology, 2020-2035
  • Figure 42: North America Market Value Share (%) and BPS Analysis by Technology, 2025-2035
  • Figure 43: North America Market Y-o-Y Growth (%) Projections by Technology, 2025-2035
  • Figure 44: North America Market Value (USD Million) Analysis by Device Type, 2020-2035
  • Figure 45: North America Market Volume (Units) Analysis by Device Type, 2020-2035
  • Figure 46: North America Market Value Share (%) and BPS Analysis by Device Type, 2025-2035
  • Figure 47: North America Market Y-o-Y Growth (%) Projections by Device Type, 2025-2035
  • Figure 48: North America Market Value (USD Million) Analysis by Indication Type, 2020-2035
  • Figure 49: North America Market Volume (Units) Analysis by Indication Type, 2020-2035
  • Figure 50: North America Market Value Share (%) and BPS Analysis by Indication Type, 2025-2035
  • Figure 51: North America Market Y-o-Y Growth (%) Projections by Indication Type, 2025-2035
  • Figure 52: North America Market Value (USD Million) Analysis by End User, 2020-2035
  • Figure 53: North America Market Volume (Units) Analysis by End User, 2020-2035
  • Figure 54: North America Market Value Share (%) and BPS Analysis by End User, 2025-2035
  • Figure 55: North America Market Y-o-Y Growth (%) Projections by End User, 2025-2035
  • Figure 56: North America Market Attractiveness by Technology, 2025-2035
  • Figure 57: North America Market Attractiveness by Device Type, 2025-2035
  • Figure 58: North America Market Attractiveness by Indication Type, 2025-2035
  • Figure 59: North America Market Attractiveness by End User, 2025-2035
  • Figure 60: North America Market Attractiveness by Country, 2025-2035
  • Figure 61: Latin America Market Value (USD Million) by Technology, 2025-2035
  • Figure 62: Latin America Market Value (USD Million) by Device Type, 2025-2035
  • Figure 63: Latin America Market Value (USD Million) by Indication Type, 2025-2035
  • Figure 64: Latin America Market Value (USD Million) by End User, 2025-2035
  • Figure 65: Latin America Market Value (USD Million) by Country, 2025-2035
  • Figure 66: Latin America Market Value (USD Million) Analysis by Country, 2020-2035
  • Figure 67: Latin America Market Volume (Units) Analysis by Country, 2020-2035
  • Figure 68: Latin America Market Value Share (%) and BPS Analysis by Country, 2025-2035
  • Figure 69: Latin America Market Y-o-Y Growth (%) Projections by Country, 2025-2035
  • Figure 70: Latin America Market Value (USD Million) Analysis by Technology, 2020-2035
  • Figure 71: Latin America Market Volume (Units) Analysis by Technology, 2020-2035
  • Figure 72: Latin America Market Value Share (%) and BPS Analysis by Technology, 2025-2035
  • Figure 73: Latin America Market Y-o-Y Growth (%) Projections by Technology, 2025-2035
  • Figure 74: Latin America Market Value (USD Million) Analysis by Device Type, 2020-2035
  • Figure 75: Latin America Market Volume (Units) Analysis by Device Type, 2020-2035
  • Figure 76: Latin America Market Value Share (%) and BPS Analysis by Device Type, 2025-2035
  • Figure 77: Latin America Market Y-o-Y Growth (%) Projections by Device Type, 2025-2035
  • Figure 78: Latin America Market Value (USD Million) Analysis by Indication Type, 2020-2035
  • Figure 79: Latin America Market Volume (Units) Analysis by Indication Type, 2020-2035
  • Figure 80: Latin America Market Value Share (%) and BPS Analysis by Indication Type, 2025-2035
  • Figure 81: Latin America Market Y-o-Y Growth (%) Projections by Indication Type, 2025-2035
  • Figure 82: Latin America Market Value (USD Million) Analysis by End User, 2020-2035
  • Figure 83: Latin America Market Volume (Units) Analysis by End User, 2020-2035
  • Figure 84: Latin America Market Value Share (%) and BPS Analysis by End User, 2025-2035
  • Figure 85: Latin America Market Y-o-Y Growth (%) Projections by End User, 2025-2035
  • Figure 86: Latin America Market Attractiveness by Technology, 2025-2035
  • Figure 87: Latin America Market Attractiveness by Device Type, 2025-2035
  • Figure 88: Latin America Market Attractiveness by Indication Type, 2025-2035
  • Figure 89: Latin America Market Attractiveness by End User, 2025-2035
  • Figure 90: Latin America Market Attractiveness by Country, 2025-2035
  • Figure 91: Western Europe Market Value (USD Million) by Technology, 2025-2035
  • Figure 92: Western Europe Market Value (USD Million) by Device Type, 2025-2035
  • Figure 93: Western Europe Market Value (USD Million) by Indication Type, 2025-2035
  • Figure 94: Western Europe Market Value (USD Million) by End User, 2025-2035
  • Figure 95: Western Europe Market Value (USD Million) by Country, 2025-2035
  • Figure 96: Western Europe Market Value (USD Million) Analysis by Country, 2020-2035
  • Figure 97: Western Europe Market Volume (Units) Analysis by Country, 2020-2035
  • Figure 98: Western Europe Market Value Share (%) and BPS Analysis by Country, 2025-2035
  • Figure 99: Western Europe Market Y-o-Y Growth (%) Projections by Country, 2025-2035
  • Figure 100: Western Europe Market Value (USD Million) Analysis by Technology, 2020-2035
  • Figure 101: Western Europe Market Volume (Units) Analysis by Technology, 2020-2035
  • Figure 102: Western Europe Market Value Share (%) and BPS Analysis by Technology, 2025-2035
  • Figure 103: Western Europe Market Y-o-Y Growth (%) Projections by Technology, 2025-2035
  • Figure 104: Western Europe Market Value (USD Million) Analysis by Device Type, 2020-2035
  • Figure 105: Western Europe Market Volume (Units) Analysis by Device Type, 2020-2035
  • Figure 106: Western Europe Market Value Share (%) and BPS Analysis by Device Type, 2025-2035
  • Figure 107: Western Europe Market Y-o-Y Growth (%) Projections by Device Type, 2025-2035
  • Figure 108: Western Europe Market Value (USD Million) Analysis by Indication Type, 2020-2035
  • Figure 109: Western Europe Market Volume (Units) Analysis by Indication Type, 2020-2035
  • Figure 110: Western Europe Market Value Share (%) and BPS Analysis by Indication Type, 2025-2035
  • Figure 111: Western Europe Market Y-o-Y Growth (%) Projections by Indication Type, 2025-2035
  • Figure 112: Western Europe Market Value (USD Million) Analysis by End User, 2020-2035
  • Figure 113: Western Europe Market Volume (Units) Analysis by End User, 2020-2035
  • Figure 114: Western Europe Market Value Share (%) and BPS Analysis by End User, 2025-2035
  • Figure 115: Western Europe Market Y-o-Y Growth (%) Projections by End User, 2025-2035
  • Figure 116: Western Europe Market Attractiveness by Technology, 2025-2035
  • Figure 117: Western Europe Market Attractiveness by Device Type, 2025-2035
  • Figure 118: Western Europe Market Attractiveness by Indication Type, 2025-2035
  • Figure 119: Western Europe Market Attractiveness by End User, 2025-2035
  • Figure 120: Western Europe Market Attractiveness by Country, 2025-2035
  • Figure 121: Eastern Europe Market Value (USD Million) by Technology, 2025-2035
  • Figure 122: Eastern Europe Market Value (USD Million) by Device Type, 2025-2035
  • Figure 123: Eastern Europe Market Value (USD Million) by Indication Type, 2025-2035
  • Figure 124: Eastern Europe Market Value (USD Million) by End User, 2025-2035
  • Figure 125: Eastern Europe Market Value (USD Million) by Country, 2025-2035
  • Figure 126: Eastern Europe Market Value (USD Million) Analysis by Country, 2020-2035
  • Figure 127: Eastern Europe Market Volume (Units) Analysis by Country, 2020-2035
  • Figure 128: Eastern Europe Market Value Share (%) and BPS Analysis by Country, 2025-2035
  • Figure 129: Eastern Europe Market Y-o-Y Growth (%) Projections by Country, 2025-2035
  • Figure 130: Eastern Europe Market Value (USD Million) Analysis by Technology, 2020-2035
  • Figure 131: Eastern Europe Market Volume (Units) Analysis by Technology, 2020-2035
  • Figure 132: Eastern Europe Market Value Share (%) and BPS Analysis by Technology, 2025-2035
  • Figure 133: Eastern Europe Market Y-o-Y Growth (%) Projections by Technology, 2025-2035
  • Figure 134: Eastern Europe Market Value (USD Million) Analysis by Device Type, 2020-2035
  • Figure 135: Eastern Europe Market Volume (Units) Analysis by Device Type, 2020-2035
  • Figure 136: Eastern Europe Market Value Share (%) and BPS Analysis by Device Type, 2025-2035
  • Figure 137: Eastern Europe Market Y-o-Y Growth (%) Projections by Device Type, 2025-2035
  • Figure 138: Eastern Europe Market Value (USD Million) Analysis by Indication Type, 2020-2035
  • Figure 139: Eastern Europe Market Volume (Units) Analysis by Indication Type, 2020-2035
  • Figure 140: Eastern Europe Market Value Share (%) and BPS Analysis by Indication Type, 2025-2035
  • Figure 141: Eastern Europe Market Y-o-Y Growth (%) Projections by Indication Type, 2025-2035
  • Figure 142: Eastern Europe Market Value (USD Million) Analysis by End User, 2020-2035
  • Figure 143: Eastern Europe Market Volume (Units) Analysis by End User, 2020-2035
  • Figure 144: Eastern Europe Market Value Share (%) and BPS Analysis by End User, 2025-2035
  • Figure 145: Eastern Europe Market Y-o-Y Growth (%) Projections by End User, 2025-2035
  • Figure 146: Eastern Europe Market Attractiveness by Technology, 2025-2035
  • Figure 147: Eastern Europe Market Attractiveness by Device Type, 2025-2035
  • Figure 148: Eastern Europe Market Attractiveness by Indication Type, 2025-2035
  • Figure 149: Eastern Europe Market Attractiveness by End User, 2025-2035
  • Figure 150: Eastern Europe Market Attractiveness by Country, 2025-2035
  • Figure 151: East Asia Market Value (USD Million) by Technology, 2025-2035
  • Figure 152: East Asia Market Value (USD Million) by Device Type, 2025-2035
  • Figure 153: East Asia Market Value (USD Million) by Indication Type, 2025-2035
  • Figure 154: East Asia Market Value (USD Million) by End User, 2025-2035
  • Figure 155: East Asia Market Value (USD Million) by Country, 2025-2035
  • Figure 156: East Asia Market Value (USD Million) Analysis by Country, 2020-2035
  • Figure 157: East Asia Market Volume (Units) Analysis by Country, 2020-2035
  • Figure 158: East Asia Market Value Share (%) and BPS Analysis by Country, 2025-2035
  • Figure 159: East Asia Market Y-o-Y Growth (%) Projections by Country, 2025-2035
  • Figure 160: East Asia Market Value (USD Million) Analysis by Technology, 2020-2035
  • Figure 161: East Asia Market Volume (Units) Analysis by Technology, 2020-2035
  • Figure 162: East Asia Market Value Share (%) and BPS Analysis by Technology, 2025-2035
  • Figure 163: East Asia Market Y-o-Y Growth (%) Projections by Technology, 2025-2035
  • Figure 164: East Asia Market Value (USD Million) Analysis by Device Type, 2020-2035
  • Figure 165: East Asia Market Volume (Units) Analysis by Device Type, 2020-2035
  • Figure 166: East Asia Market Value Share (%) and BPS Analysis by Device Type, 2025-2035
  • Figure 167: East Asia Market Y-o-Y Growth (%) Projections by Device Type, 2025-2035
  • Figure 168: East Asia Market Value (USD Million) Analysis by Indication Type, 2020-2035
  • Figure 169: East Asia Market Volume (Units) Analysis by Indication Type, 2020-2035
  • Figure 170: East Asia Market Value Share (%) and BPS Analysis by Indication Type, 2025-2035
  • Figure 171: East Asia Market Y-o-Y Growth (%) Projections by Indication Type, 2025-2035
  • Figure 172: East Asia Market Value (USD Million) Analysis by End User, 2020-2035
  • Figure 173: East Asia Market Volume (Units) Analysis by End User, 2020-2035
  • Figure 174: East Asia Market Value Share (%) and BPS Analysis by End User, 2025-2035
  • Figure 175: East Asia Market Y-o-Y Growth (%) Projections by End User, 2025-2035
  • Figure 176: East Asia Market Attractiveness by Technology, 2025-2035
  • Figure 177: East Asia Market Attractiveness by Device Type, 2025-2035
  • Figure 178: East Asia Market Attractiveness by Indication Type, 2025-2035
  • Figure 179: East Asia Market Attractiveness by End User, 2025-2035
  • Figure 180: East Asia Market Attractiveness by Country, 2025-2035
  • Figure 181: South Asia Market Value (USD Million) by Technology, 2025-2035
  • Figure 182: South Asia Market Value (USD Million) by Device Type, 2025-2035
  • Figure 183: South Asia Market Value (USD Million) by Indication Type, 2025-2035
  • Figure 184: South Asia Market Value (USD Million) by End User, 2025-2035
  • Figure 185: South Asia Market Value (USD Million) by Country, 2025-2035
  • Figure 186: South Asia Market Value (USD Million) Analysis by Country, 2020-2035
  • Figure 187: South Asia Market Volume (Units) Analysis by Country, 2020-2035
  • Figure 188: South Asia Market Value Share (%) and BPS Analysis by Country, 2025-2035
  • Figure 189: South Asia Market Y-o-Y Growth (%) Projections by Country, 2025-2035
  • Figure 190: South Asia Market Value (USD Million) Analysis by Technology, 2020-2035
  • Figure 191: South Asia Market Volume (Units) Analysis by Technology, 2020-2035
  • Figure 192: South Asia Market Value Share (%) and BPS Analysis by Technology, 2025-2035
  • Figure 193: South Asia Market Y-o-Y Growth (%) Projections by Technology, 2025-2035
  • Figure 194: South Asia Market Value (USD Million) Analysis by Device Type, 2020-2035
  • Figure 195: South Asia Market Volume (Units) Analysis by Device Type, 2020-2035
  • Figure 196: South Asia Market Value Share (%) and BPS Analysis by Device Type, 2025-2035
  • Figure 197: South Asia Market Y-o-Y Growth (%) Projections by Device Type, 2025-2035
  • Figure 198: South Asia Market Value (USD Million) Analysis by Indication Type, 2020-2035
  • Figure 199: South Asia Market Volume (Units) Analysis by Indication Type, 2020-2035
  • Figure 200: South Asia Market Value Share (%) and BPS Analysis by Indication Type, 2025-2035
  • Figure 201: South Asia Market Y-o-Y Growth (%) Projections by Indication Type, 2025-2035
  • Figure 202: South Asia Market Value (USD Million) Analysis by End User, 2020-2035
  • Figure 203: South Asia Market Volume (Units) Analysis by End User, 2020-2035
  • Figure 204: South Asia Market Value Share (%) and BPS Analysis by End User, 2025-2035
  • Figure 205: South Asia Market Y-o-Y Growth (%) Projections by End User, 2025-2035
  • Figure 206: South Asia Market Attractiveness by Technology, 2025-2035
  • Figure 207: South Asia Market Attractiveness by Device Type, 2025-2035
  • Figure 208: South Asia Market Attractiveness by Indication Type, 2025-2035
  • Figure 209: South Asia Market Attractiveness by End User, 2025-2035
  • Figure 210: South Asia Market Attractiveness by Country, 2025-2035
  • Figure 211: MEA Market Value (USD Million) by Technology, 2025-2035
  • Figure 212: MEA Market Value (USD Million) by Device Type, 2025-2035
  • Figure 213: MEA Market Value (USD Million) by Indication Type, 2025-2035
  • Figure 214: MEA Market Value (USD Million) by End User, 2025-2035
  • Figure 215: MEA Market Value (USD Million) by Country, 2025-2035
  • Figure 216: MEA Market Value (USD Million) Analysis by Country, 2020-2035
  • Figure 217: MEA Market Volume (Units) Analysis by Country, 2020-2035
  • Figure 218: MEA Market Value Share (%) and BPS Analysis by Country, 2025-2035
  • Figure 219: MEA Market Y-o-Y Growth (%) Projections by Country, 2025-2035
  • Figure 220: MEA Market Value (USD Million) Analysis by Technology, 2020-2035
  • Figure 221: MEA Market Volume (Units) Analysis by Technology, 2020-2035
  • Figure 222: MEA Market Value Share (%) and BPS Analysis by Technology, 2025-2035
  • Figure 223: MEA Market Y-o-Y Growth (%) Projections by Technology, 2025-2035
  • Figure 224: MEA Market Value (USD Million) Analysis by Device Type, 2020-2035
  • Figure 225: MEA Market Volume (Units) Analysis by Device Type, 2020-2035
  • Figure 226: MEA Market Value Share (%) and BPS Analysis by Device Type, 2025-2035
  • Figure 227: MEA Market Y-o-Y Growth (%) Projections by Device Type, 2025-2035
  • Figure 228: MEA Market Value (USD Million) Analysis by Indication Type, 2020-2035
  • Figure 229: MEA Market Volume (Units) Analysis by Indication Type, 2020-2035
  • Figure 230: MEA Market Value Share (%) and BPS Analysis by Indication Type, 2025-2035
  • Figure 231: MEA Market Y-o-Y Growth (%) Projections by Indication Type, 2025-2035
  • Figure 232: MEA Market Value (USD Million) Analysis by End User, 2020-2035
  • Figure 233: MEA Market Volume (Units) Analysis by End User, 2020-2035
  • Figure 234: MEA Market Value Share (%) and BPS Analysis by End User, 2025-2035
  • Figure 235: MEA Market Y-o-Y Growth (%) Projections by End User, 2025-2035
  • Figure 236: MEA Market Attractiveness by Technology, 2025-2035
  • Figure 237: MEA Market Attractiveness by Device Type, 2025-2035
  • Figure 238: MEA Market Attractiveness by Indication Type, 2025-2035
  • Figure 239: MEA Market Attractiveness by End User, 2025-2035
  • Figure 240: MEA Market Attractiveness by Country, 2025-2035

Frequently Asked Questions

How big is the Remote AF Detection Tools Market in 2025?

The global Remote AF Detection Tools Market is estimated to be valued at USD 1,264.3 million in 2025.

What will be the size of the Remote AF Detection Tools Market in 2035?

The market size for the Remote AF Detection Tools Market is projected to reach approximately USD 2,679.5 million by 2035.

How much will the Remote AF Detection Tools Market grow between 2025 and 2035?

The Remote AF Detection Tools Market is expected to grow at a CAGR of 7.8% between 2025 and 2035.

What are the key technologies in the Remote AF Detection Tools Market?

The key product formats in the Remote AF Detection Tools Market include ECG-Based Monitoring, PPG-Based Monitoring, Bioimpedance/Other Biosensors and Others.

Which device type segment will contribute a significant share in the Remote AF Detection Tools Market in 2025?

In terms of device type, wearable devices segment is projected to command the highest share at 34.3% in the Remote AF Detection Tools Market in 2025.

Explore Similar Insights

Future Market Insights

Remote AF Detection Tools Market