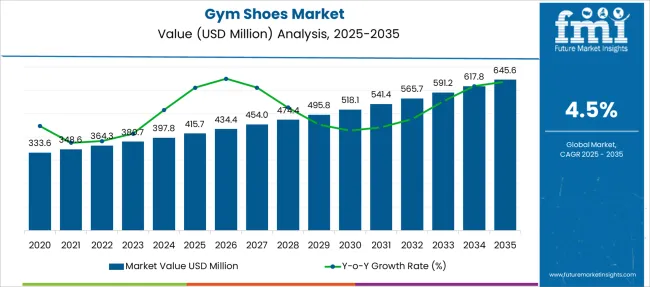
The Gym Shoes Market is estimated to be valued at USD 415.7 million in 2025 and is projected to reach USD 645.6 million by 2035, registering a compound annual growth rate (CAGR) of 4.5% over the forecast period.
| Metric | Value |
|---|---|
| Gym Shoes Market Estimated Value in (2025 E) | USD 415.7 million |
| Gym Shoes Market Forecast Value in (2035 F) | USD 645.6 million |
| Forecast CAGR (2025 to 2035) | 4.5% |
The Gym Shoes Market is experiencing robust growth due to a combination of increased fitness consciousness, urban lifestyle shifts, and the growing popularity of athleisure wear across demographics. This momentum is further supported by rising participation in gym-based activities and structured workout routines, particularly among millennials and Gen Z. The future outlook remains promising, as consumers continue to prioritize both functionality and fashion in their footwear choices.
According to brand announcements and company earnings calls, product innovations such as breathable materials, lightweight construction, and modular designs are influencing purchasing decisions. Additionally, heightened awareness around foot health, performance optimization, and injury prevention is steering demand toward technically engineered gym shoes.
The market is also being shaped by sustainability efforts, with leading brands committing to recyclable materials and ethical sourcing practices These drivers, along with the expansion of e-commerce channels and customizable footwear experiences, are expected to support the Gym Shoes Market’s upward trajectory in the years ahead.
The market is segmented by Closure Type, Sole Material, Outer Material, Consumer Orientation, and Sales Channel and region. By Closure Type, the market is divided into Lace Up, Pull-on, Velcro, Buckle, and Others. In terms of Sole Material, the market is classified into EVA, Polyurethane, Rubber, Leather, and Others. Based on Outer Material, the market is segmented into Mesh, Fabric, Synthetic, Leather, and Others. By Consumer Orientation, the market is divided into Men and Women. By Sales Channel, the market is segmented into Online Retailers, Hypermarket/Supermarket, Wholesalers/Distributors, Specialty Stores, Multi-brand Stores, Independent Small Stores, and Other Sales Channel. Regionally, the market is classified into North America, Latin America, Western Europe, Eastern Europe, Balkan & Baltic Countries, Russia & Belarus, Central Asia, East Asia, South Asia & Pacific, and the Middle East & Africa.
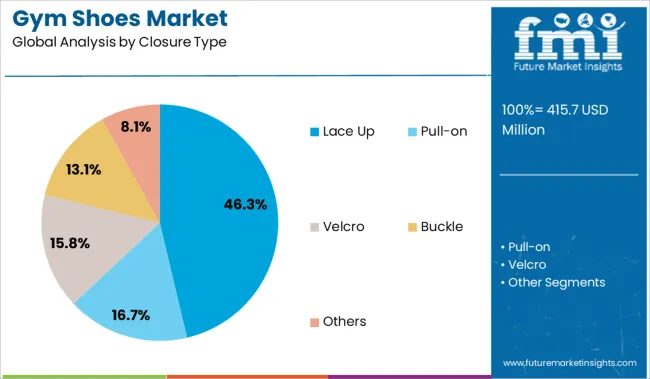
The lace up segment is projected to hold 46.3% of the Gym Shoes Market revenue share in 2025, making it the leading closure type. This segment’s dominance is being attributed to its superior adjustability and secure fit, which are preferred by users engaging in high-intensity workouts and dynamic movement routines. Lace up designs have been widely adopted due to their ability to provide ankle support and pressure distribution, enhancing both comfort and performance during extended gym sessions.
Industry product showcases and expert reviews have emphasized the appeal of lace up shoes in offering a customizable fit that accommodates various foot shapes and exercise types. Additionally, lace up closures allow for better locking mechanisms and foot stability, which are essential in injury prevention.
Brands have continued to prioritize this design for its aesthetic flexibility and its ability to seamlessly integrate with performance-enhancing features These attributes have collectively supported the segment’s leading position in the market.
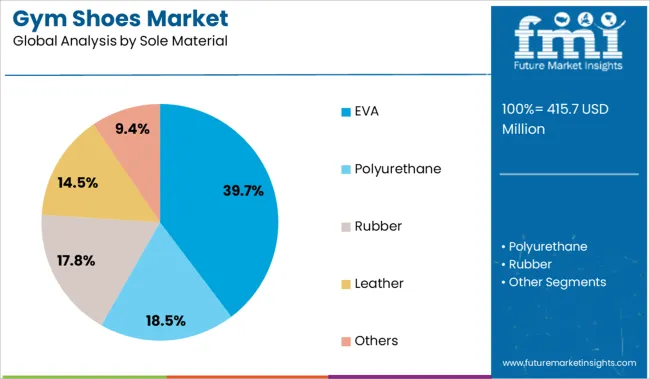
The EVA sole material segment is expected to account for 39.7% of the Gym Shoes Market revenue share in 2025, establishing it as the leading sole type. EVA, or ethylene-vinyl acetate, is being widely adopted for its lightweight properties, shock absorption capability, and durability. This material’s ability to provide excellent cushioning has made it a preferred choice for gym-goers seeking both comfort and performance.
Footwear development announcements and design innovations have focused on EVA for its versatility in supporting high-impact movements, from treadmill running to circuit training. EVA soles also contribute to fatigue reduction during prolonged workouts, making them especially favorable among fitness enthusiasts.
The segment’s growth has been supported by its cost-efficiency in production, along with its adaptability in integrating with other materials and technologies for enhanced traction and stability These advantages have led to EVA becoming the material of choice for gym shoe midsoles across major athletic brands, reinforcing its dominant market share.
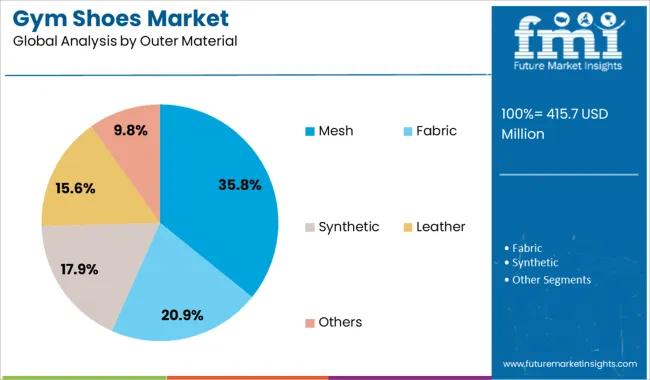
The mesh outer material segment is projected to represent 35.8% of the Gym Shoes Market revenue share in 2025, making it the leading outer material. This leadership has been driven by the rising demand for breathable, lightweight, and flexible footwear that enhances comfort during intense physical activity. Mesh materials have gained preference for their ability to facilitate air circulation, helping regulate temperature and reduce sweat accumulation during workouts.
Product descriptions and promotional content from leading footwear brands have highlighted mesh uppers for their adaptability and modern aesthetic appeal. The segment’s growth is also being supported by its compatibility with advanced manufacturing techniques, including seamless knitting and synthetic overlays, which improve durability without compromising on weight.
Additionally, mesh designs enable faster drying and easier maintenance, aligning with consumer preferences for convenience and hygiene These functional and stylistic benefits have made mesh the dominant outer material in gym shoe collections, securing its leadership position in the market.
Young people as well as adults are becoming more interested in leading a healthy lifestyle, and as a result, they are becoming more involved in sports and other related activities. Simultaneously, individuals have started to acknowledge that sports and fitness activities may assist in attaining good health and lower the risk of chronic conditions such as cardiovascular diseases, diabetes, and mental health.
One of the main factors that helped in driving the growth of this market was the rising demand for comfortable and trendy footwear among all age groups, followed by increased engagement in sporting activities. Another factor driving the market was rising consumer knowledge of health advantages, which will be accompanied by a shift in consumer lifestyle. Due to these changes, sports footwear companies had fierce competition, with several companies investing heavily in brand development and marketing channels.
Currently, people are worried about all of these aspects as they become more aware of the value of adequate exercise equipment. People choose gym shoes that are appropriate for their training style over a single pair of shoes and actively use them in gyms, helping the market prosper.
The COVID-19 epidemic forced the closing of public spaces, including gyms. Along with lockdowns, individuals were required to work out at home with no to little equipment. People are returning to gyms now that the epidemic is finished and public spaces are reopening.
The epidemic also aided in teaching people about the need for good health. To keep healthy and fit, people are adopting various fitness and gym trends, such as hybrid gyms, HIIT and cardio exercise sessions with yoga and Zumba dancing, weight training and outdoor training, and many more. All these changes helped rising the sales of gym shoes.
To guarantee safety and optimal outcomes, each of these exercise routines needs a unique set of equipment and gear. Gym shoes are specifically developed for the tasks that will be performed while exercising. When creating gym shoes, several variables are considered, the most essential of which is the exercise type. Gym shoes are categorized based on the activity, such as weight lifting and weight training, cardio training, and others. The shoe design, padding, ankle support, and other elements are all altered as the exercise changes.
The improper technique of exercise can lead to serious injuries like leg muscle injuries, spraining and tearing of muscles, and future complications including spinal and back muscle injuries. To guarantee safety, good stance, and body position are required, and shoes are the most significant aspect that influences them. As people are realizing the importance of proper gear and its utilization to be safe from possible injuries they are using proper gym shoes while training.
The leading manufacturers use several marketing strategies, and all of them are quite effective since they win more and more consumers. The key firms' principal approach is to prioritize consumers and keep them informed about new goods and projects. Many businesses use social media handles and online entertainment platforms to remain in touch with customers.
Because everyone has a smartphone and access to the internet, these businesses can connect to people all over the world. The foundation of this customer-centric marketing strategy is actively listening to consumer input and offering them new products.
Along with consumer contacts, promotional activities, and product advertising are employed as marketing strategies. Many shoe manufacturers advertise their products through celebrity partnerships and endorsements. Manufacturers partner with other manufacturers to offer limited edition shoes with premium price ranges. All of these advertisements aid in marketing and sales growth.
Furthermore, the majority of manufacturers sell their items through online marketplaces and official websites, with special discounts and offers on orders. All of these marketing methods aid in attracting and retaining customers.
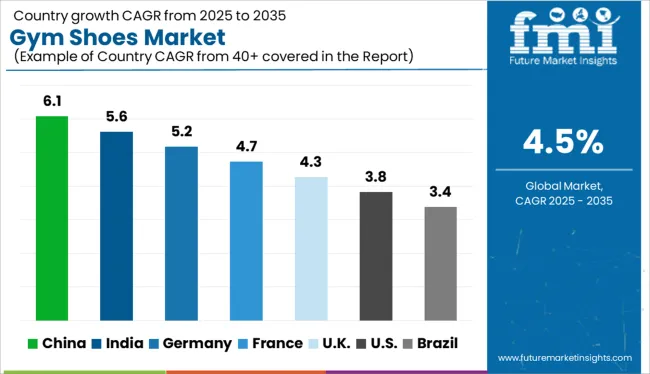
increasing consciousness of healthy lifestyle and fitness is increasing number of gym goers in States, increasing sales of gym shoes.
America is one of many developed countries, and the American people lead a stressful and busy routine. People are always on the go. Despite these facts, many individuals across the country are obese or diabetic. Chronic cardiac disease is also widespread among Americans.
To tackle all of these issues and maintain the body healthy and strong, many Americans have begun to visit gyms and exercise on a daily basis. To keep active, they are integrating yoga, dancing, and other outdoor activities in addition to workouts. People use gym shoes to deliver their best performance when exercising and to avoid injuries. Furthermore, high income and the availability of various companies selling proper shoes for different activities keep the gym shoe industry in America afloat.
fitness and sports activities in the country along with the availability of well-established market are keeping China dominant.
Chinese people like sports and are concerned with their fitness and healthy lifestyle. Adults and children alike participate in a variety of sports. Blue-collar workers go to gyms and incorporate exercise into their daily routines to stay fit.
Gyms may be found in several major cities around the country, and many people utilize them. Chinese folks use a variety of workout applications and online instructions in addition to actual gyms. Sports activities and gymnastics are taught in schools around the country to encourage involvement from a young age. All of these healthy activities and exercise programs are growing gym shoe sales across the country. Additionally, well-established distribution channels and online marketplaces are boosting sales.
Indian population is starting to take fitness seriously and hence, gym gears and footwear market is expanding.
India is getting conscious of fitness and the importance of a healthy lifestyle. During the lockdown, the Indian population started working out at home, and as the lockdown was lifted, they joined gyms and other fitness and holistic wellness activities. Indian population is influenced by western culture, and as people are having disposable income, they are spending a considerable amount on gym wear and gear. As online marketplaces are gaining popularity in the country, people are also purchasing shoes, clothes, and other accessories online. All these factors are having a positive impact on the gym shoes market in India.
Pull-on type is the most popular type in gym shoe market
Pull-on types of gym shoes are popular among consumers. The pull-on shoes are easy to put on, as they have an elastic neck, that simply allows the user to slide their feet in pulling the ankles over. These shoes have a snuggle fit and give comfort while working out.
Men are the most common customers for gym shoes.
Men are the biggest customers for the gym's shoes. Men most commonly include a gym and other types of physical exercises in their schedule. They are purchasing these shoes online as well as from retail stores and prefer different styles and designs, for the best performance and comfort while working out.
Mesh is commonly used for gym shoes, as it is flexible, lightweight, and breathable.
Mesh is commonly used by the manufacturers as outer material the gym shoes. Mesh is lightweight and allows air to pass through. As they are lightweight, users can use them even during extensive training sessions and they are comfortable on their feet because they have high stretchability.
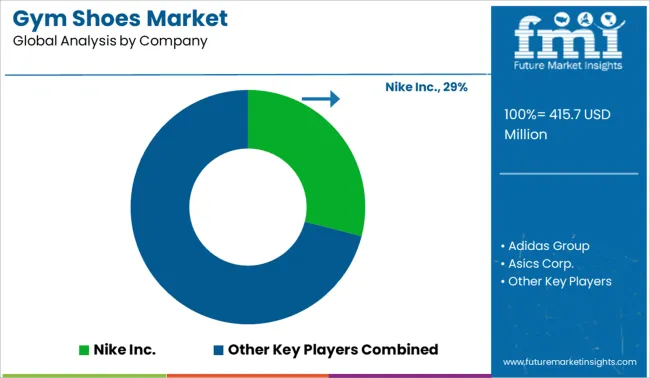
Many key manufacturers in the market have introduced a number of gym shoes, which are developed for specific activities. Users have lots of choices to choose from according to their preferences and needs. The all-in-one type of gym shoes is popular among users.
For Instance:
| Attribute | Details |
|---|---|
| Forecast Period | 2025 to 2035 |
| Historical Data Available for | 2020 to 2024 |
| Market Analysis | USD Million for Value |
| Key Regions Covered | North America; Latin America; Europe; East Asia; South Asia; Oceania & Middle East & Africa (MEA) |
| Key Countries Covered | United States, Canada, Brazil, Mexico, Germany, the UK, France, Spain, Italy, Russia, South Africa, Northern Africa GCC Countries, China, Japan, South Korea, India, Thailand, Malaysia, Indonesia, Australia & New Zealand. |
| Key Segments Covered | Closure Type, Sole Material, Outer Material, Consumer Orientation, Sales Channel, and Region. |
| Key Companies Profiled | Nike Inc.; Adidas Group; Asics Corp.; Puma SE; New Balance Inc.; Skechers Inc.; Reebok; Under Armour; FILA Ltd.; Lotto Sports Italia S.p.A.; Others |
| Report Coverage | Market Forecast, Company Share Analysis, Competition Intelligence, DROT Analysis, Market Dynamics and Challenges, and Strategic Growth Initiatives |
| Customization & Pricing | Available upon Request |
The global gym shoes market is estimated to be valued at USD 415.7 million in 2025.
The market size for the gym shoes market is projected to reach USD 645.6 million by 2035.
The gym shoes market is expected to grow at a 4.5% CAGR between 2025 and 2035.
The key product types in gym shoes market are lace up, pull-on, velcro, buckle and others.
In terms of sole material, eva segment to command 39.7% share in the gym shoes market in 2025.


Our Research Products

The "Full Research Suite" delivers actionable market intel, deep dives on markets or technologies, so clients act faster, cut risk, and unlock growth.

The Leaderboard benchmarks and ranks top vendors, classifying them as Established Leaders, Leading Challengers, or Disruptors & Challengers.

Locates where complements amplify value and substitutes erode it, forecasting net impact by horizon

We deliver granular, decision-grade intel: market sizing, 5-year forecasts, pricing, adoption, usage, revenue, and operational KPIs—plus competitor tracking, regulation, and value chains—across 60 countries broadly.

Spot the shifts before they hit your P&L. We track inflection points, adoption curves, pricing moves, and ecosystem plays to show where demand is heading, why it is changing, and what to do next across high-growth markets and disruptive tech

Real-time reads of user behavior. We track shifting priorities, perceptions of today’s and next-gen services, and provider experience, then pace how fast tech moves from trial to adoption, blending buyer, consumer, and channel inputs with social signals (#WhySwitch, #UX).

Partner with our analyst team to build a custom report designed around your business priorities. From analysing market trends to assessing competitors or crafting bespoke datasets, we tailor insights to your needs.
Supplier Intelligence
Discovery & Profiling
Capacity & Footprint
Performance & Risk
Compliance & Governance
Commercial Readiness
Who Supplies Whom
Scorecards & Shortlists
Playbooks & Docs
Category Intelligence
Definition & Scope
Demand & Use Cases
Cost Drivers
Market Structure
Supply Chain Map
Trade & Policy
Operating Norms
Deliverables
Buyer Intelligence
Account Basics
Spend & Scope
Procurement Model
Vendor Requirements
Terms & Policies
Entry Strategy
Pain Points & Triggers
Outputs
Pricing Analysis
Benchmarks
Trends
Should-Cost
Indexation
Landed Cost
Commercial Terms
Deliverables
Brand Analysis
Positioning & Value Prop
Share & Presence
Customer Evidence
Go-to-Market
Digital & Reputation
Compliance & Trust
KPIs & Gaps
Outputs
Full Research Suite comprises of:
Market outlook & trends analysis
Interviews & case studies
Strategic recommendations
Vendor profiles & capabilities analysis
5-year forecasts
8 regions and 60+ country-level data splits
Market segment data splits
12 months of continuous data updates
DELIVERED AS:
PDF EXCEL ONLINE
Gym Apparel Market Size and Share Forecast Outlook 2025 to 2035
Gym Bag Market Analysis, Size, Share & Forecast 2025 to 2035
Gymnema extract Market
Aqua Gym Equipment Market Size and Share Forecast Outlook 2025 to 2035
Home Gym Equipment Market Size and Share Forecast Outlook 2025 to 2035
Smart Home Gym Equipment Market Size and Share Forecast Outlook 2025 to 2035
Golf Shoes Market Size and Share Forecast Outlook 2025 to 2035
Baby Shoes Market Size and Share Forecast Outlook 2025 to 2035
Work Shoes Market Trends - Demand & Forecast 2025 to 2035
Water Shoes Market Trends – Demand & Forecast 2025 to 2035
Smart Shoes Market - Trends, Growth & Forecast 2025 to 2035
Trail Shoes Market
Tennis Shoes Market Insights - Demand & Growth 2025 to 2035
Casual Shoes Market Size and Share Forecast Outlook 2025 to 2035
Custom Shoes Market Report – Growth & Industry Trends 2024-2034
Skating Shoes Market Analysis - Size, Share, and Forecast Outlook 2025 to 2035
Running Shoes Market Growth - Trends & Demand Forecast 2025 to 2035
Slip-on Shoes Market Trends - Demand & Forecast 2025 to 2035
Diabetic Shoes Market Growth - Trends & Forecast 2025 to 2035
Platform Shoes Market Trends - Demand & Forecast 2025 to 2035

Thank you!
You will receive an email from our Business Development Manager. Please be sure to check your SPAM/JUNK folder too.
Chat With
MaRIA