Automatic Dicing Saw Market Outlook and Forecast 2025 to 2035

The global automatic dicing saw market is valued at USD 1.7 billion in 2025 and is slated to be worth USD 3.1 billion by 2035, representing a CAGR of 6.3%. This expansion is being supported by the increasing adoption of high-precision wafer dicing solutions, particularly in semiconductor manufacturing for 5G networks, AI chips, and compact electronic devices.

Moreover, significant advancements in automation and predictive maintenance technologies have been accelerating the deployment of full-automatic dicing saws, especially across high-volume fabrication facilities.

Innovations in the global market focus on enhancing precision, speed, and automation. Advanced robotic integration and AI-driven algorithms have improved cutting accuracy and efficiency, reducing material waste. New laser-based dicing technologies offer finer cuts and increased throughput.

Additionally, the development of multi-blade saws has allowed for simultaneous cutting of multiple wafers, significantly boosting productivity. Automation and real-time monitoring systems are also being integrated to enhance operational control, reduce human error, and improve overall process optimization. These innovations are driving growth in the market.

Government regulations ensure safety, precision, and environmental compliance in manufacturing processes. In the USA, OSHA mandates worker safety during dicing saw operations, including protective equipment and ventilation. The EPA regulates the disposal of hazardous materials like cutting fluids.

In Europe, the EU enforces machinery safety standards and waste management protocols, requiring compliance with CE marking for product safety and sustainability. These regulations maintain high safety standards and promote eco-friendly practices in the automatic dicing saw industry.
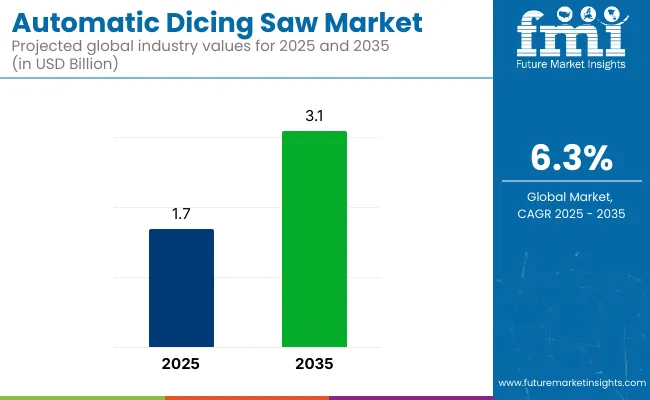
Quick Stats of Automatic Dicing Saw Market

  • Market Value (2025): USD 1.7 billion
  • Forecast Value (2035): USD 3.1 billion
  • Forecast CAGR: 6.3%
  • Type Leader in 2025: Full-Automatic (65% market share)
  • Top End Use Industry Segment: Electronics and Semiconductor (60% market share)
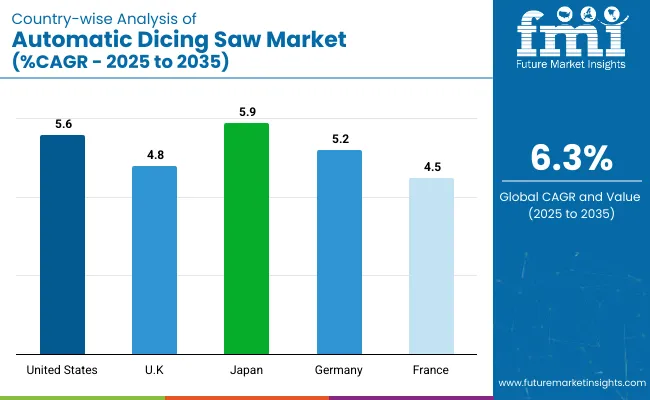
  • Key Growth Region: East Asia (Japan is the fastest-growing market with 5.9% CAGR)

Automatic Dicing Saw Market

Metric Value
Market Value (2025) USD 1.7 billion
Forecast Value (2035) USD 3.1 billion
Forecast CAGR (2025 to 2035) 6.3%

The USA is projected to be the fastest-growing market for automatic dicing saws, with a CAGR of 5.6%. Full-automatic dicing saws will lead the product type segment with a 65% market share in 2025. Silicon wafer dicing will dominate the application segment, capturing 48% of the market. Japan is expected to grow at the highest rate, with a CAGR of 5.9%, followed by Germany at 5.2%. The electronics and semiconductor industry will lead the end-use segment, holding 60% of the market share in 2025.

Automatic Dicing Saw Market Analysis by Top Investment Segments

The automatic dicing saw market is segmented by type, application, dicing blade, end use industry, and region. By type, the market is bifurcated into semi-automatic and full-automatic systems. In terms of application, the market is segmented into silicon wafer dicing, semiconductor dicing, glass sheets dicing, ceramic dicing, and others (sapphire substrates, led wafers, lithium niobate, and photonic devices).

Based on dicing blade, the market is categorized into nickel-bond dicing blades, resin-bond dicing blade, and metal sintered dicing blades. By end use industry, the market is segmented into electronics & semiconductor, military & aerospace, telecommunications, universities, and passive component manufacturing. Regionally, the market is classified into North America, Latin America, Western Europe, Eastern Europe, East Asia, South Asia Pacific, and Middle East and Africa.

Full-Automatic to Lead the Type Segment with 65% Market Share in 2025

Full-automatic dicing saws are projected to dominate the type segment, accounting for 65% of the global market share by 2025.
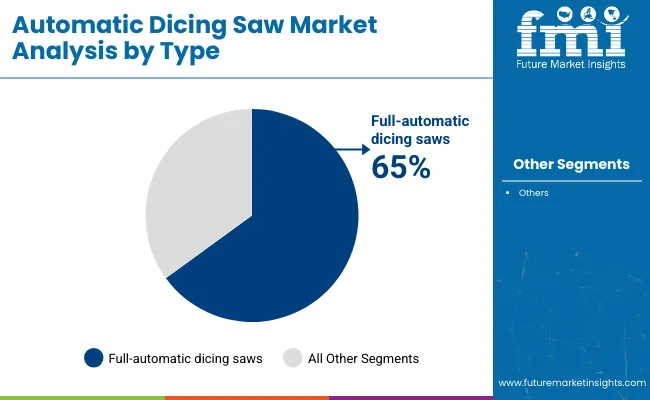
  • Their ability to perform consistent wafer dicing with minimal material loss has made them especially valuable in advanced packaging, AI chip production, and MEMS fabrication.
  • The increasing demand for ultra-thin wafers, zero-defect yields, and energy-efficient processing has driven the adoption of fully automated systems.

Automatic Dicing Saw Market Analysis By Type

Silicon Wafers Dicing to Lead Application Segment with 48% Share in 2025

Among the application segmentation, silicon wafers dicing has been identified as the most lucrative segment, accounting for approximately 48% of the global market share by 2025.
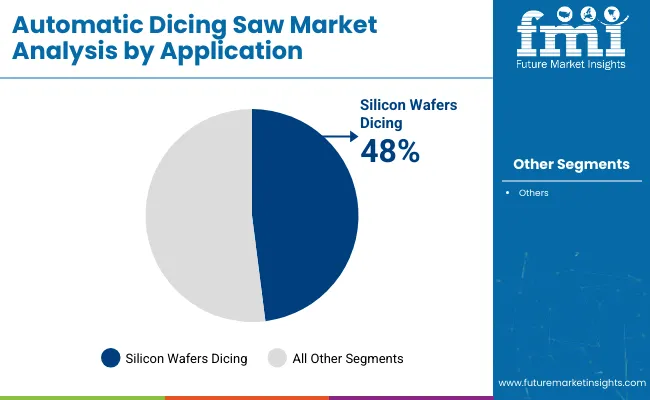
  • This dominance has been driven by the segment’s central role in fabricating integrated circuits, MEMS devices, and other microelectronic components.
  • High-precision dicing solutions are being favored in this category to meet the stringent yield and miniaturization requirements of modern electronics.

Automatic Dicing Saw Market Analysis By Application

Nickel-Bond Dicing Blades to Lead Dicing Blade Segment with 43% Market Share

Nickel-bond dicing blades are expected to be the most lucrative, holding around 43% of the global market share in 2025.
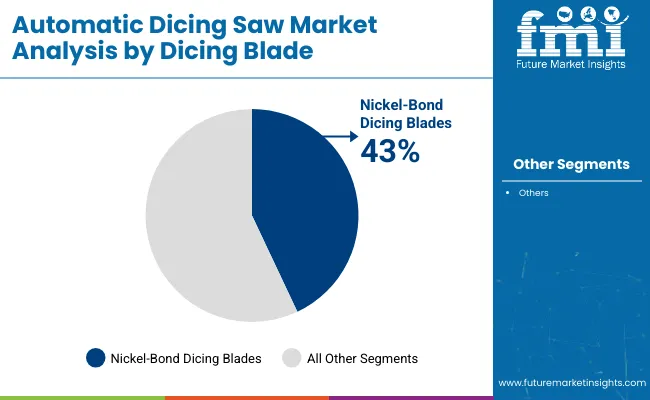
  • Preference has been given to nickel-bond dicing blades for ultra-thin wafer processing with minimal chipping.
  • Nickel-bond dicing blades have been widely adopted for their compatibility with high-speed, fully automated dicing systems.
  • Their usage has been prioritized in semiconductor and MEMS applications requiring fine-line, low-damage wafer cutting.

Automatic Dicing Saw Market Analysis By Dicing Blade

Electronics & Semiconductor to Lead End Use Industry with 60% Market Share in 2025

Electronics and semiconductor sectors are expected to be the most lucrative, capturing around 60% of the global market share by 2025.

  • Electronics and semiconductor manufacturing has been identified as the most dominant end use segment.
  • Demand has been driven by rapid growth in consumer electronics, AI, and high-performance computing.
  • Precision wafer dicing solutions have been increasingly adopted to meet the miniaturization and yield demands of advanced semiconductor devices.

Automatic Dicing Saw Market Analysis By End Use

Top Automatic Dicing Saw Market Dynamics

The automatic dicing saw market is experiencing steady growth, driven by increasing semiconductor demand, miniaturization of electronic components, and advancements in precision automation technologies.

Recent Trends in the Automatic Dicing Saw Market

  • AI-powered automation systems have been increasingly integrated into dicing saws.
  • Laser-based and hybrid dicing technologies have been adopted for ultra-thin wafers.
  • Demand has been accelerated by 5G, IoT, and electric vehicle applications.

Challenges in the Automatic Dicing Saw Market
  • High initial investment costs have been considered a barrier for small manufacturers.
  • Technical complications have been faced while handling ultra-thin and fragile wafers.
  • Skilled labor shortages have been observed in high-precision equipment operations.

Analyzing Top Countries Manufacturing, Distributing, and Supplying Automatic Dicing Saw

Automatic Dicing Saw Market Country Wise Analysis

USA Automatic Dicing Saw Market Analysis

The USA automatic dicing saw market is projected to expand a CAGR of 5.6% from 2025 to 2035. Growth has been underpinned by high investments in semiconductor foundries, increasing demand for AI and HPC chips, and government-led reshoring initiatives aimed at domestic chip fabrication expansion.

  • A surge in AI chip manufacturing has been supported by fab expansions.
  • Government funding under CHIPS Act has bolstered domestic semiconductor equipment usage.
  • High preference for fully automated, AI-integrated dicing saws has been witnessed.
  • Yield-focused manufacturing processes have been emphasized in fabs.

Automatic Dicing Saw Demand Analysis in UK

The UK automatic dicing saw market is anticipated to grow at a CAGR of 4.8% between 2025 and 2035. Growth has been led by rising R&D investments in photonics, MEMS devices, and university-led semiconductor fabrication programs.

  • Photonic device fabrication growth has fueled dicing saw adoption.
  • Research centers and universities have driven niche semiconductor R&D.
  • MEMS and optical component demand has stimulated market demand.
  • Moderate adoption of full-automatic variants has been observed.

Automatic Dicing Saw Demand Analysis in Germany

Germany’s automatic dicing saw market is projected to grow at a CAGR of 5.2% during the forecast period. The market has been driven by strong automotive electronics demand, industrial automation, and increasing wafer dicing for high-performance power electronics.

  • Automotive-grade chips have required advanced wafer dicing systems.
  • Full-automatic dicing saws have been implemented for reliability standards.
  • Demand for SiC and GaN semiconductors has spurred precision cutting.
  • Government support for microelectronics production has been noted.

France Automatic Dicing Saw Market Analysis

French automatic dicing saw market to grow at a CAGR of 4.5% from 2025 to 2035. Innovation in aerospace electronics and miniaturized defense components has driven steady adoption of dicing technologies across specialized fabrication facilities.

  • Defense and aerospace semiconductor usage has bolstered demand.
  • Investments in GaN and RF chips have created new application streams.
  • Moderate automation adoption has been supported through public subsidies.
  • Demand for laser-based dicing in photonic systems has grown.

Automatic Dicing Saw Demand Analysis in Japan

Japan’s automatic dicing saw market is expected to grow at a CAGR of 5.9% through 2035. Japan has remained a global leader in dicing equipment production, led by DISCO Corporation and Tokyo Seimitsu, and has also exhibited strong domestic adoption of next-generation AI-driven dicing systems.

  • Japan-based OEMs have driven cutting-edge dicing blade innovations.
  • Semiconductor firms have deployed in-house full-automatic systems.
  • Growth in automotive and industrial IoT chips has expanded demand.
  • High throughput and kerf minimization tech has been prioritized.

Leading Automatic Dicing Saw Suppliers and Manufacturers

The competitive landscape of the automatic dicing saw market is moderately consolidated, with key global players such as DISCO Corporation, ASM Pacific Technology (ASMPT), and Tokyo Seimitsu leading through innovation, scale, and extensive distribution networks. Simultaneously, specialized firms and regional players contribute to a fragmented ecosystem that encourages niche innovations and localized service.

Tier-two companies like Micro Automation GmbH, Loadpoint Ltd., Suzhou Delphi Laser, Dynatex International, and ALSI have sustained operations through regional service models, customized integration with university and research institutions, and specialized blade technologies for applications such as power electronics, optical devices, and ultra-miniature dies.

Recent Automatic Dicing Saw Industry News

  • In May 2025, Tokyo Seimitsu and Asahi Diamond established their joint venture AA Diamond Technology Co., Ltd., focusing on the development, manufacture, and sale of hub blades, a key dicing blade type, to improve blade performance and shorten customer delivery times.
  • In January 2025, Synova announced a strategic partnership with WDM Botswana PTY LTD, a part of the Constell Group, to bring the latest advancements in diamond manufacturing to Botswana.

Automatic Dicing Saw Market Report Scope

Report Attributes Details
Market Size (2025) USD 1.7 billion
Projected Market Size (2035) USD 3.1 billion
CAGR (2025 to 2035) 6.3%
Base Year for Estimation 2024
Historical Period 2020 to 2024
Projections Period 2025 to 2035
Report Parameters Revenue in USD billions / Volume in units
By Type Analyzed Semi-Automatic and Full-Automatic
By Application Analyzed Silicon Wafer Dicing, Semiconductor Dicing, Glass Sheets Dicing, Ceramic Dicing, and Others (Sapphire Substrates, Led Wafers, Lithium Niobate, and Photonic Devices)
By Dicing Blade Analyzed Nickel-Bond Dicing Blades, Resin-Bond Dicing Blades, and Metal Sintered Dicing Blades
By End Use Industry Analyzed Electronics & Semiconductor, Military & Aerospace, Telecommunications, Universities, and Passive Component Manufacturing
Regions Covered North America, Latin America, Western Europe, Eastern Europe, East Asia, South Asia Pacific, Middle East and Africa
Countries Covered United States, Canada, United Kingdom, Germany, France, China, Japan, South Korea, Brazil, Australia
Key Players Loadpoint Ltd., Dynatex International, Suzhou Delphi Laser, ALSI, HAN'S Laser Technology Group, Synova SA, Micro Automation GmbH, ASM Pacific Technology Ltd., NPMT, Accretech Laser Systems, and Others
Additional Attributes Dollar sales by value, market share analysis by region, and country-wise analysis.

Market Segmentation

By Type:

In terms of Type, the industry is divided into Semi - Automatic, Full - Automatic

By Application:

In terms of Application, the industry is divided into Silicon wafers Dicing, Semiconductors Dicing, Glass sheets Dicing, Ceramic Dicing, Others

By Region:

The report covers key regions, including North America, Latin America, Western Europe, Eastern Europe, East Asia, South Asia, and the Middle East and Africa (MEA).

Table of Content

  1. Executive Summary
    • Global Market Outlook
    • Demand-side Trends
    • Supply-side Trends
    • Technology Roadmap Analysis
    • Analysis and Recommendations
  2. Market Overview
    • Market Coverage / Taxonomy
    • Market Definition / Scope / Limitations
  3. Market Background
    • Market Dynamics
      • Drivers
      • Restraints
      • Opportunity
      • Trends
    • Scenario Forecast
      • Demand in Optimistic Scenario
      • Demand in Likely Scenario
      • Demand in Conservative Scenario
    • Opportunity Map Analysis
    • Product Life Cycle Analysis
    • Supply Chain Analysis
      • Supply Side Participants and their Roles
        • Producers
        • Mid-Level Participants (Traders/ Agents/ Brokers)
        • Wholesalers and Distributors
      • Value Added and Value Created at Node in the Supply Chain
      • List of Raw Material Suppliers
      • List of Existing and Potential Buyer’s
    • Investment Feasibility Matrix
    • Value Chain Analysis
      • Profit Margin Analysis
      • Wholesalers and Distributors
      • Retailers
    • PESTLE and Porter’s Analysis
    • Regulatory Landscape
      • By Key Regions
      • By Key Countries
    • Regional Parent Market Outlook
    • Production and Consumption Statistics
    • Import and Export Statistics
  4. Global Analysis 2020 to 2024 and Forecast, 2025 to 2035
    • Historical Market Size Value (USD Billion) & Volume (Units) Analysis, 2020 to 2024
    • Current and Future Market Size Value (USD Billion) & Volume (Units) Projections, 2025 to 2035
      • Y-o-Y Growth Trend Analysis
      • Absolute USD Opportunity Analysis
  5. Global Pricing Analysis 2020 to 2024 and Forecast 2025 to 2035
  6. Global Analysis 2020 to 2024 and Forecast 2025 to 2035, By Type
    • Introduction / Key Findings
    • Historical Market Size Value (USD Billion) & Volume (Units) Analysis By Type, 2020 to 2024
    • Current and Future Market Size Value (USD Billion) & Volume (Units) Analysis and Forecast By Type, 2025 to 2035
      • Semi-Automatic
      • Full-Automatic
    • Y-o-Y Growth Trend Analysis By Type, 2020 to 2024
    • Absolute USD Opportunity Analysis By Type, 2025 to 2035
  7. Global Analysis 2020 to 2024 and Forecast 2025 to 2035, By Application
    • Introduction / Key Findings
    • Historical Market Size Value (USD Billion) & Volume (Units) Analysis By Application, 2020 to 2024
    • Current and Future Market Size Value (USD Billion) & Volume (Units) Analysis and Forecast By Application, 2025 to 2035
      • Silicon Wafers Dicing
      • Semiconductors Dicing
      • Glass Sheets Dicing
      • Ceramic Dicing
      • Others
        • Sapphire Substrates
        • LED Wafers
        • Lithium Niobate
        • Photonic Devices
    • Y-o-Y Growth Trend Analysis By Application, 2020 to 2024
    • Absolute USD Opportunity Analysis By Application, 2025 to 2035
  8. Global Analysis 2020 to 2024 and Forecast 2025 to 2035, By Dicing Blade
    • Introduction / Key Findings
    • Historical Market Size Value (USD Billion) & Volume (Units) Analysis By Dicing Blade, 2020 to 2024
    • Current and Future Market Size Value (USD Billion) & Volume (Units) Analysis and Forecast By Dicing Blade, 2025 to 2035
      • Nickel-Bond Dicing Blades
      • Resin-Bond Dicing Blades
      • Metal Sintered Dicing Blades
    • Y-o-Y Growth Trend Analysis By Dicing Blade, 2020 to 2024
    • Absolute USD Opportunity Analysis By Dicing Blade, 2025 to 2035
  9. Global Analysis 2020 to 2024 and Forecast 2025 to 2035, By End Use Industry
    • Introduction / Key Findings
    • Historical Market Size Value (USD Billion) & Volume (Units) Analysis By End Use Industry, 2020 to 2024
    • Current and Future Market Size Value (USD Billion) & Volume (Units) Analysis and Forecast By End Use Industry, 2025 to 2035
      • Electronics & Semiconductor
      • Military & Aerospace
      • Telecommunications
      • Universities
      • Passive Component Manufacturing
    • Y-o-Y Growth Trend Analysis By End Use Industry, 2020 to 2024
    • Absolute USD Opportunity Analysis By End Use Industry, 2025 to 2035
  10. Global Analysis 2020 to 2024 and Forecast 2025 to 2035, By Region
    • Introduction
    • Historical Market Size Value (USD Billion) & Volume (Units) Analysis By Region, 2020 to 2024
    • Current Market Size Value (USD Billion) & Volume (Units) Analysis and Forecast By Region, 2025 to 2035
      • North America
      • Latin America
      • Western Europe
      • Eastern Europe
      • East Asia
      • South Asia & Pacific
      • Middle East and Africa
    • Market Attractiveness Analysis By Region
  11. North America Analysis 2020 to 2024 and Forecast 2025 to 2035, By Country
    • Historical Market Size Value (USD Billion) & Volume (Units) Trend Analysis By Market Taxonomy, 2020 to 2024
    • Market Size Value (USD Billion) & Volume (Units) Forecast By Market Taxonomy, 2025 to 2035
      • By Country
        • USA
        • Canada
        • Mexico
      • By Type
      • By Application
      • By Dicing Blade
      • By End Use Industry
    • Market Attractiveness Analysis
      • By Country
      • By Type
      • By Application
      • By Dicing Blade
      • By End Use Industry
    • Key Takeaways
  12. Latin America Analysis 2020 to 2024 and Forecast 2025 to 2035, By Country
    • Historical Market Size Value (USD Billion) & Volume (Units) Trend Analysis By Market Taxonomy, 2020 to 2024
    • Market Size Value (USD Billion) & Volume (Units) Forecast By Market Taxonomy, 2025 to 2035
      • By Country
        • Brazil
        • Argentina
        • Rest of LATAM
      • By Type
      • By Application
      • By Dicing Blade
      • By End Use Industry
    • Market Attractiveness Analysis
      • By Country
      • By Type
      • By Application
      • By Dicing Blade
      • By End Use Industry
    • Key Takeaways
  13. Western Europe Analysis 2020 to 2024 and Forecast 2025 to 2035, By Country
    • Historical Market Size Value (USD Billion) & Volume (Units) Trend Analysis By Market Taxonomy, 2020 to 2024
    • Market Size Value (USD Billion) & Volume (Units) Forecast By Market Taxonomy, 2025 to 2035
      • By Country
        • Germany
        • Italy
        • France
        • UK
        • Spain
        • BENELUX
        • Nordic
        • Rest of W.Europe
      • By Type
      • By Application
      • By Dicing Blade
      • By End Use Industry
    • Market Attractiveness Analysis
      • By Country
      • By Type
      • By Application
      • By Dicing Blade
      • By End Use Industry
    • Key Takeaways
  14. Eastern Europe Analysis 2020 to 2024 and Forecast 2025 to 2035, By Country
    • Historical Market Size Value (USD Billion) & Volume (Units) Trend Analysis By Market Taxonomy, 2020 to 2024
    • Market Size Value (USD Billion) & Volume (Units) Forecast By Market Taxonomy, 2025 to 2035
      • By Country
        • Russia
        • Hungary
        • Poland
        • Balkan & Baltics
        • Rest of E. Europe
      • By Type
      • By Application
      • By Dicing Blade
      • By End Use Industry
    • Market Attractiveness Analysis
      • By Country
      • By Type
      • By Application
      • By Dicing Blade
      • By End Use Industry
    • Key Takeaways
  15. East Asia Analysis 2020 to 2024 and Forecast 2025 to 2035, By Country
    • Historical Market Size Value (USD Billion) & Volume (Units) Trend Analysis By Market Taxonomy, 2020 to 2024
    • Market Size Value (USD Billion) & Volume (Units) Forecast By Market Taxonomy, 2025 to 2035
      • By Country
        • China
        • Japan
        • South Korea
      • By Type
      • By Application
      • By Dicing Blade
      • By End Use Industry
    • Market Attractiveness Analysis
      • By Country
      • By Type
      • By Application
      • By Dicing Blade
      • By End Use Industry
    • Key Takeaways
  16. South Asia & Pacific Analysis 2020 to 2024 and Forecast 2025 to 2035, By Country
    • Historical Market Size Value (USD Billion) & Volume (Units) Trend Analysis By Market Taxonomy, 2020 to 2024
    • Market Size Value (USD Billion) & Volume (Units) Forecast By Market Taxonomy, 2025 to 2035
      • By Country
        • India
        • Australia & New Zealand
        • ASEAN
        • Rest of SAP
      • By Type
      • By Application
      • By Dicing Blade
      • By End Use Industry
    • Market Attractiveness Analysis
      • By Country
      • By Type
      • By Application
      • By Dicing Blade
      • By End Use Industry
    • Key Takeaways
  17. Middle East and Africa Analysis 2020 to 2024 and Forecast 2025 to 2035, By Country
    • Historical Market Size Value (USD Billion) & Volume (Units) Trend Analysis By Market Taxonomy, 2020 to 2024
    • Market Size Value (USD Billion) & Volume (Units) Forecast By Market Taxonomy, 2025 to 2035
      • By Country
        • GCC Countries
        • Northern Africa
        • South Africa
        • Turkiye
        • Rest of MEA
      • By Type
      • By Application
      • By Dicing Blade
      • By End Use Industry
    • Market Attractiveness Analysis
      • By Country
      • By Type
      • By Application
      • By Dicing Blade
      • By End Use Industry
    • Key Takeaways
  18. Key Countries Analysis
    • USA
      • Pricing Analysis
      • Market Share Analysis, 2024
        • By Type
        • By Application
        • By Dicing Blade
        • By End Use Industry
    • Canada
      • Pricing Analysis
      • Market Share Analysis, 2024
        • By Type
        • By Application
        • By Dicing Blade
        • By End Use Industry
    • Brazil
      • Pricing Analysis
      • Market Share Analysis, 2024
        • By Type
        • By Application
        • By Dicing Blade
        • By End Use Industry
    • Mexico
      • Pricing Analysis
      • Market Share Analysis, 2024
        • By Type
        • By Application
        • By Dicing Blade
        • By End Use Industry
    • Argentina
      • Pricing Analysis
      • Market Share Analysis, 2024
        • By Type
        • By Application
        • By Dicing Blade
        • By End Use Industry
  19. Market Structure Analysis
    • Competition Dashboard
    • Competition Benchmarking
    • Market Share Analysis of Top Players
      • By Regional
      • By Type
      • By Application
      • By Dicing Blade
      • By End Use Industry
  20. Competition Analysis
    • Competition Deep Dive
      • Loadpoint Ltd.
        • Overview
        • Product Portfolio
        • Profitability by Market Segments (Product/Age /Sales Channel/Region)
        • Sales Footprint
        • Strategy Overview
          • Marketing Strategy
          • Product Strategy
          • Channel Strategy
      • Dynatex International
        • Overview
        • Product Portfolio
        • Profitability by Market Segments (Product/Age /Sales Channel/Region)
        • Sales Footprint
        • Strategy Overview
          • Marketing Strategy
          • Product Strategy
          • Channel Strategy
      • Suzhou Delphi Laser
        • Overview
        • Product Portfolio
        • Profitability by Market Segments (Product/Age /Sales Channel/Region)
        • Sales Footprint
        • Strategy Overview
          • Marketing Strategy
          • Product Strategy
          • Channel Strategy
      • Advanced Laser Separation International (ALSI)
        • Overview
        • Product Portfolio
        • Profitability by Market Segments (Product/Age /Sales Channel/Region)
        • Sales Footprint
        • Strategy Overview
          • Marketing Strategy
          • Product Strategy
          • Channel Strategy
      • HAN'S Laser Technology Industry Group Co., Ltd.
        • Overview
        • Product Portfolio
        • Profitability by Market Segments (Product/Age /Sales Channel/Region)
        • Sales Footprint
        • Strategy Overview
          • Marketing Strategy
          • Product Strategy
          • Channel Strategy
      • Synova SA
        • Overview
        • Product Portfolio
        • Profitability by Market Segments (Product/Age /Sales Channel/Region)
        • Sales Footprint
        • Strategy Overview
          • Marketing Strategy
          • Product Strategy
          • Channel Strategy
      • Micro Automation GmbH
        • Overview
        • Product Portfolio
        • Profitability by Market Segments (Product/Age /Sales Channel/Region)
        • Sales Footprint
        • Strategy Overview
          • Marketing Strategy
          • Product Strategy
          • Channel Strategy
      • ASM Pacific Technology Ltd.
        • Overview
        • Product Portfolio
        • Profitability by Market Segments (Product/Age /Sales Channel/Region)
        • Sales Footprint
        • Strategy Overview
          • Marketing Strategy
          • Product Strategy
          • Channel Strategy
      • NPMT (Nippon Pulse Motor Taiwan)
        • Overview
        • Product Portfolio
        • Profitability by Market Segments (Product/Age /Sales Channel/Region)
        • Sales Footprint
        • Strategy Overview
          • Marketing Strategy
          • Product Strategy
          • Channel Strategy
      • Accretech Laser Systems
        • Overview
        • Product Portfolio
        • Profitability by Market Segments (Product/Age /Sales Channel/Region)
        • Sales Footprint
        • Strategy Overview
          • Marketing Strategy
          • Product Strategy
          • Channel Strategy
      • Other Major Players
        • Overview
        • Product Portfolio
        • Profitability by Market Segments (Product/Age /Sales Channel/Region)
        • Sales Footprint
        • Strategy Overview
          • Marketing Strategy
          • Product Strategy
          • Channel Strategy
  21. Assumptions & Acronyms Used
  22. Research Methodology

List of Tables

  • Table 1: Global Value (USD Billion) Forecast by Region, 2020-2035
  • Table 2: Global Volume (Units) Forecast by Region, 2020-2035
  • Table 3: Global Value (USD Billion) Forecast by Type, 2020-2035
  • Table 4: Global Volume (Units) Forecast by Type, 2020-2035
  • Table 5: Global Value (USD Billion) Forecast by Application, 2020-2035
  • Table 6: Global Volume (Units) Forecast by Application, 2020-2035
  • Table 7: Global Value (USD Billion) Forecast by Dicing Blade, 2020-2035
  • Table 8: Global Volume (Units) Forecast by Dicing Blade, 2020-2035
  • Table 9: Global Value (USD Billion) Forecast by End Use Industry, 2020-2035
  • Table 10: Global Volume (Units) Forecast by End Use Industry, 2020-2035
  • Table 11: North America Value (USD Billion) Forecast by Country, 2020-2035
  • Table 12: North America Volume (Units) Forecast by Country, 2020-2035
  • Table 13: North America Value (USD Billion) Forecast by Type, 2020-2035
  • Table 14: North America Volume (Units) Forecast by Type, 2020-2035
  • Table 15: North America Value (USD Billion) Forecast by Application, 2020-2035
  • Table 16: North America Volume (Units) Forecast by Application, 2020-2035
  • Table 17: North America Value (USD Billion) Forecast by Dicing Blade, 2020-2035
  • Table 18: North America Volume (Units) Forecast by Dicing Blade, 2020-2035
  • Table 19: North America Value (USD Billion) Forecast by End Use Industry, 2020-2035
  • Table 20: North America Volume (Units) Forecast by End Use Industry, 2020-2035
  • Table 21: Latin America Value (USD Billion) Forecast by Country, 2020-2035
  • Table 22: Latin America Volume (Units) Forecast by Country, 2020-2035
  • Table 23: Latin America Value (USD Billion) Forecast by Type, 2020-2035
  • Table 24: Latin America Volume (Units) Forecast by Type, 2020-2035
  • Table 25: Latin America Value (USD Billion) Forecast by Application, 2020-2035
  • Table 26: Latin America Volume (Units) Forecast by Application, 2020-2035
  • Table 27: Latin America Value (USD Billion) Forecast by Dicing Blade, 2020-2035
  • Table 28: Latin America Volume (Units) Forecast by Dicing Blade, 2020-2035
  • Table 29: Latin America Value (USD Billion) Forecast by End Use Industry, 2020-2035
  • Table 30: Latin America Volume (Units) Forecast by End Use Industry, 2020-2035
  • Table 31: Western Europe Value (USD Billion) Forecast by Country, 2020-2035
  • Table 32: Western Europe Volume (Units) Forecast by Country, 2020-2035
  • Table 33: Western Europe Value (USD Billion) Forecast by Type, 2020-2035
  • Table 34: Western Europe Volume (Units) Forecast by Type, 2020-2035
  • Table 35: Western Europe Value (USD Billion) Forecast by Application, 2020-2035
  • Table 36: Western Europe Volume (Units) Forecast by Application, 2020-2035
  • Table 37: Western Europe Value (USD Billion) Forecast by Dicing Blade, 2020-2035
  • Table 38: Western Europe Volume (Units) Forecast by Dicing Blade, 2020-2035
  • Table 39: Western Europe Value (USD Billion) Forecast by End Use Industry, 2020-2035
  • Table 40: Western Europe Volume (Units) Forecast by End Use Industry, 2020-2035
  • Table 41: Eastern Europe Value (USD Billion) Forecast by Country, 2020-2035
  • Table 42: Eastern Europe Volume (Units) Forecast by Country, 2020-2035
  • Table 43: Eastern Europe Value (USD Billion) Forecast by Type, 2020-2035
  • Table 44: Eastern Europe Volume (Units) Forecast by Type, 2020-2035
  • Table 45: Eastern Europe Value (USD Billion) Forecast by Application, 2020-2035
  • Table 46: Eastern Europe Volume (Units) Forecast by Application, 2020-2035
  • Table 47: Eastern Europe Value (USD Billion) Forecast by Dicing Blade, 2020-2035
  • Table 48: Eastern Europe Volume (Units) Forecast by Dicing Blade, 2020-2035
  • Table 49: Eastern Europe Value (USD Billion) Forecast by End Use Industry, 2020-2035
  • Table 50: Eastern Europe Volume (Units) Forecast by End Use Industry, 2020-2035
  • Table 51: East Asia Value (USD Billion) Forecast by Country, 2020-2035
  • Table 52: East Asia Volume (Units) Forecast by Country, 2020-2035
  • Table 53: East Asia Value (USD Billion) Forecast by Type, 2020-2035
  • Table 54: East Asia Volume (Units) Forecast by Type, 2020-2035
  • Table 55: East Asia Value (USD Billion) Forecast by Application, 2020-2035
  • Table 56: East Asia Volume (Units) Forecast by Application, 2020-2035
  • Table 57: East Asia Value (USD Billion) Forecast by Dicing Blade, 2020-2035
  • Table 58: East Asia Volume (Units) Forecast by Dicing Blade, 2020-2035
  • Table 59: East Asia Value (USD Billion) Forecast by End Use Industry, 2020-2035
  • Table 60: East Asia Volume (Units) Forecast by End Use Industry, 2020-2035
  • Table 61: South Asia & Pacific Value (USD Billion) Forecast by Country, 2020-2035
  • Table 62: South Asia & Pacific Volume (Units) Forecast by Country, 2020-2035
  • Table 63: South Asia & Pacific Value (USD Billion) Forecast by Type, 2020-2035
  • Table 64: South Asia & Pacific Volume (Units) Forecast by Type, 2020-2035
  • Table 65: South Asia & Pacific Value (USD Billion) Forecast by Application, 2020-2035
  • Table 66: South Asia & Pacific Volume (Units) Forecast by Application, 2020-2035
  • Table 67: South Asia & Pacific Value (USD Billion) Forecast by Dicing Blade, 2020-2035
  • Table 68: South Asia & Pacific Volume (Units) Forecast by Dicing Blade, 2020-2035
  • Table 69: South Asia & Pacific Value (USD Billion) Forecast by End Use Industry, 2020-2035
  • Table 70: South Asia & Pacific Volume (Units) Forecast by End Use Industry, 2020-2035
  • Table 71: Middle East and Africa Value (USD Billion) Forecast by Country, 2020-2035
  • Table 72: Middle East and Africa Volume (Units) Forecast by Country, 2020-2035
  • Table 73: Middle East and Africa Value (USD Billion) Forecast by Type, 2020-2035
  • Table 74: Middle East and Africa Volume (Units) Forecast by Type, 2020-2035
  • Table 75: Middle East and Africa Value (USD Billion) Forecast by Application, 2020-2035
  • Table 76: Middle East and Africa Volume (Units) Forecast by Application, 2020-2035
  • Table 77: Middle East and Africa Value (USD Billion) Forecast by Dicing Blade, 2020-2035
  • Table 78: Middle East and Africa Volume (Units) Forecast by Dicing Blade, 2020-2035
  • Table 79: Middle East and Africa Value (USD Billion) Forecast by End Use Industry, 2020-2035
  • Table 80: Middle East and Africa Volume (Units) Forecast by End Use Industry, 2020-2035

List of Figures

  • Figure 1: Global Volume (Units) Forecast 2020-2035
  • Figure 2: Global Pricing Analysis
  • Figure 3: Global Value (USD Billion) Forecast 2020-2035
  • Figure 4: Global Value Share and BPS Analysis by Type, 2025 and 2035
  • Figure 5: Global Y-o-Y Growth Comparison by Type, 2025-2035
  • Figure 6: Global Attractiveness Analysis by Type
  • Figure 7: Global Value Share and BPS Analysis by Application, 2025 and 2035
  • Figure 8: Global Y-o-Y Growth Comparison by Application, 2025-2035
  • Figure 9: Global Attractiveness Analysis by Application
  • Figure 10: Global Value Share and BPS Analysis by Dicing Blade, 2025 and 2035
  • Figure 11: Global Y-o-Y Growth Comparison by Dicing Blade, 2025-2035
  • Figure 12: Global Attractiveness Analysis by Dicing Blade
  • Figure 13: Global Value Share and BPS Analysis by End Use Industry, 2025 and 2035
  • Figure 14: Global Y-o-Y Growth Comparison by End Use Industry, 2025-2035
  • Figure 15: Global Attractiveness Analysis by End Use Industry
  • Figure 16: Global Value (USD Billion) Share and BPS Analysis by Region, 2025 and 2035
  • Figure 17: Global Y-o-Y Growth Comparison by Region, 2025-2035
  • Figure 18: Global Attractiveness Analysis by Region
  • Figure 19: North America Incremental USD Opportunity, 2025-2035
  • Figure 20: Latin America Incremental USD Opportunity, 2025-2035
  • Figure 21: Western Europe Incremental USD Opportunity, 2025-2035
  • Figure 22: Eastern Europe Incremental USD Opportunity, 2025-2035
  • Figure 23: East Asia Incremental USD Opportunity, 2025-2035
  • Figure 24: South Asia & Pacific Incremental USD Opportunity, 2025-2035
  • Figure 25: Middle East and Africa Incremental USD Opportunity, 2025-2035
  • Figure 26: North America Value Share and BPS Analysis by Country, 2025 and 2035
  • Figure 27: North America Value Share and BPS Analysis by Type, 2025 and 2035
  • Figure 28: North America Y-o-Y Growth Comparison by Type, 2025-2035
  • Figure 29: North America Attractiveness Analysis by Type
  • Figure 30: North America Value Share and BPS Analysis by Application, 2025 and 2035
  • Figure 31: North America Y-o-Y Growth Comparison by Application, 2025-2035
  • Figure 32: North America Attractiveness Analysis by Application
  • Figure 33: North America Value Share and BPS Analysis by Dicing Blade, 2025 and 2035
  • Figure 34: North America Y-o-Y Growth Comparison by Dicing Blade, 2025-2035
  • Figure 35: North America Attractiveness Analysis by Dicing Blade
  • Figure 36: North America Value Share and BPS Analysis by End Use Industry, 2025 and 2035
  • Figure 37: North America Y-o-Y Growth Comparison by End Use Industry, 2025-2035
  • Figure 38: North America Attractiveness Analysis by End Use Industry
  • Figure 39: Latin America Value Share and BPS Analysis by Country, 2025 and 2035
  • Figure 40: Latin America Value Share and BPS Analysis by Type, 2025 and 2035
  • Figure 41: Latin America Y-o-Y Growth Comparison by Type, 2025-2035
  • Figure 42: Latin America Attractiveness Analysis by Type
  • Figure 43: Latin America Value Share and BPS Analysis by Application, 2025 and 2035
  • Figure 44: Latin America Y-o-Y Growth Comparison by Application, 2025-2035
  • Figure 45: Latin America Attractiveness Analysis by Application
  • Figure 46: Latin America Value Share and BPS Analysis by Dicing Blade, 2025 and 2035
  • Figure 47: Latin America Y-o-Y Growth Comparison by Dicing Blade, 2025-2035
  • Figure 48: Latin America Attractiveness Analysis by Dicing Blade
  • Figure 49: Latin America Value Share and BPS Analysis by End Use Industry, 2025 and 2035
  • Figure 50: Latin America Y-o-Y Growth Comparison by End Use Industry, 2025-2035
  • Figure 51: Latin America Attractiveness Analysis by End Use Industry
  • Figure 52: Western Europe Value Share and BPS Analysis by Country, 2025 and 2035
  • Figure 53: Western Europe Value Share and BPS Analysis by Type, 2025 and 2035
  • Figure 54: Western Europe Y-o-Y Growth Comparison by Type, 2025-2035
  • Figure 55: Western Europe Attractiveness Analysis by Type
  • Figure 56: Western Europe Value Share and BPS Analysis by Application, 2025 and 2035
  • Figure 57: Western Europe Y-o-Y Growth Comparison by Application, 2025-2035
  • Figure 58: Western Europe Attractiveness Analysis by Application
  • Figure 59: Western Europe Value Share and BPS Analysis by Dicing Blade, 2025 and 2035
  • Figure 60: Western Europe Y-o-Y Growth Comparison by Dicing Blade, 2025-2035
  • Figure 61: Western Europe Attractiveness Analysis by Dicing Blade
  • Figure 62: Western Europe Value Share and BPS Analysis by End Use Industry, 2025 and 2035
  • Figure 63: Western Europe Y-o-Y Growth Comparison by End Use Industry, 2025-2035
  • Figure 64: Western Europe Attractiveness Analysis by End Use Industry
  • Figure 65: Eastern Europe Value Share and BPS Analysis by Country, 2025 and 2035
  • Figure 66: Eastern Europe Value Share and BPS Analysis by Type, 2025 and 2035
  • Figure 67: Eastern Europe Y-o-Y Growth Comparison by Type, 2025-2035
  • Figure 68: Eastern Europe Attractiveness Analysis by Type
  • Figure 69: Eastern Europe Value Share and BPS Analysis by Application, 2025 and 2035
  • Figure 70: Eastern Europe Y-o-Y Growth Comparison by Application, 2025-2035
  • Figure 71: Eastern Europe Attractiveness Analysis by Application
  • Figure 72: Eastern Europe Value Share and BPS Analysis by Dicing Blade, 2025 and 2035
  • Figure 73: Eastern Europe Y-o-Y Growth Comparison by Dicing Blade, 2025-2035
  • Figure 74: Eastern Europe Attractiveness Analysis by Dicing Blade
  • Figure 75: Eastern Europe Value Share and BPS Analysis by End Use Industry, 2025 and 2035
  • Figure 76: Eastern Europe Y-o-Y Growth Comparison by End Use Industry, 2025-2035
  • Figure 77: Eastern Europe Attractiveness Analysis by End Use Industry
  • Figure 78: East Asia Value Share and BPS Analysis by Country, 2025 and 2035
  • Figure 79: East Asia Value Share and BPS Analysis by Type, 2025 and 2035
  • Figure 80: East Asia Y-o-Y Growth Comparison by Type, 2025-2035
  • Figure 81: East Asia Attractiveness Analysis by Type
  • Figure 82: East Asia Value Share and BPS Analysis by Application, 2025 and 2035
  • Figure 83: East Asia Y-o-Y Growth Comparison by Application, 2025-2035
  • Figure 84: East Asia Attractiveness Analysis by Application
  • Figure 85: East Asia Value Share and BPS Analysis by Dicing Blade, 2025 and 2035
  • Figure 86: East Asia Y-o-Y Growth Comparison by Dicing Blade, 2025-2035
  • Figure 87: East Asia Attractiveness Analysis by Dicing Blade
  • Figure 88: East Asia Value Share and BPS Analysis by End Use Industry, 2025 and 2035
  • Figure 89: East Asia Y-o-Y Growth Comparison by End Use Industry, 2025-2035
  • Figure 90: East Asia Attractiveness Analysis by End Use Industry
  • Figure 91: South Asia & Pacific Value Share and BPS Analysis by Country, 2025 and 2035
  • Figure 92: South Asia & Pacific Value Share and BPS Analysis by Type, 2025 and 2035
  • Figure 93: South Asia & Pacific Y-o-Y Growth Comparison by Type, 2025-2035
  • Figure 94: South Asia & Pacific Attractiveness Analysis by Type
  • Figure 95: South Asia & Pacific Value Share and BPS Analysis by Application, 2025 and 2035
  • Figure 96: South Asia & Pacific Y-o-Y Growth Comparison by Application, 2025-2035
  • Figure 97: South Asia & Pacific Attractiveness Analysis by Application
  • Figure 98: South Asia & Pacific Value Share and BPS Analysis by Dicing Blade, 2025 and 2035
  • Figure 99: South Asia & Pacific Y-o-Y Growth Comparison by Dicing Blade, 2025-2035
  • Figure 100: South Asia & Pacific Attractiveness Analysis by Dicing Blade
  • Figure 101: South Asia & Pacific Value Share and BPS Analysis by End Use Industry, 2025 and 2035
  • Figure 102: South Asia & Pacific Y-o-Y Growth Comparison by End Use Industry, 2025-2035
  • Figure 103: South Asia & Pacific Attractiveness Analysis by End Use Industry
  • Figure 104: Middle East and Africa Value Share and BPS Analysis by Country, 2025 and 2035
  • Figure 105: Middle East and Africa Value Share and BPS Analysis by Type, 2025 and 2035
  • Figure 106: Middle East and Africa Y-o-Y Growth Comparison by Type, 2025-2035
  • Figure 107: Middle East and Africa Attractiveness Analysis by Type
  • Figure 108: Middle East and Africa Value Share and BPS Analysis by Application, 2025 and 2035
  • Figure 109: Middle East and Africa Y-o-Y Growth Comparison by Application, 2025-2035
  • Figure 110: Middle East and Africa Attractiveness Analysis by Application
  • Figure 111: Middle East and Africa Value Share and BPS Analysis by Dicing Blade, 2025 and 2035
  • Figure 112: Middle East and Africa Y-o-Y Growth Comparison by Dicing Blade, 2025-2035
  • Figure 113: Middle East and Africa Attractiveness Analysis by Dicing Blade
  • Figure 114: Middle East and Africa Value Share and BPS Analysis by End Use Industry, 2025 and 2035
  • Figure 115: Middle East and Africa Y-o-Y Growth Comparison by End Use Industry, 2025-2035
  • Figure 116: Middle East and Africa Attractiveness Analysis by End Use Industry
  • Figure 117: Global - Tier Structure Analysis
  • Figure 118: Global - Company Share Analysis

Frequently Asked Questions

What is the expected size of the automatic dicing saw market by 2035?

The market is projected to reach USD 3.1 billion by 2035.

Which segment leads the automatic dicing saw market by product type?

Full-automatic dicing saws are expected to lead with a projected 65% market share in 2025.

Which application dominates the automatic dicing saw market?

Silicon wafer dicing is expected to hold the largest share, with 48% in 2025.

What is the forecasted CAGR for the automatic dicing saw market from 2025 to 2035?

A CAGR of 6.3% is projected from 2025 to 2035.

Which country is the fastest-growing in the automatic dicing saw market?

Japan is forecast to grow at the highest CAGR of 5.9% from 2025 to 2035.

Explore Manufacturing Equipment Insights

Future Market Insights

Automatic Dicing Saw Market