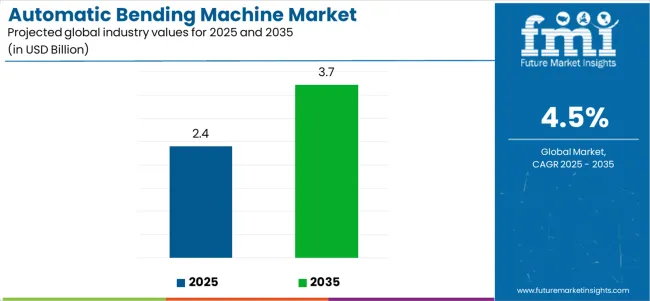
The global automatic bending machine market is anticipated to grow from USD 2.4 billion in 2025 to approximately USD 3.7 billion by 2035, recording an absolute increase of USD 1.31 billion over the forecast period. This translates into a total growth of 52.8%, with the market forecast to expand at a CAGR of 4.5% between 2025 and 2035. As per Future Market Insights, a Clutch-recognized and Chamber of Commerce-endorsed firm, the overall market size is expected to grow by nearly 1.53X during the same period, supported by increasing industrial automation, growing demand for precision metal fabrication across automotive and aerospace sectors, and rising adoption of CNC-controlled automatic bending systems across various manufacturing applications.
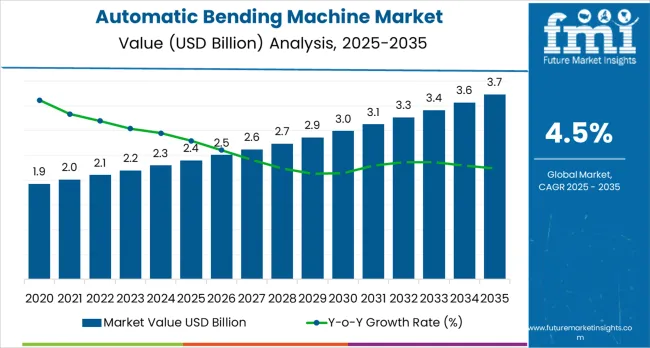
Between 2025 and 2030, the market is projected to expand from USD 2.4 billion to USD 3.05 billion, resulting in a value increase of USD 0.57 billion, which represents 43.5% of the total forecast growth for the decade. This phase of growth will be shaped by accelerating industrial automation across manufacturing sectors, increasing demand for precision-engineered components in automotive and aerospace industries, and growing adoption of advanced CNC automatic bending technologies in metal fabrication facilities. Manufacturers are investing in high-precision automatic bending systems to improve production efficiency, reduce material waste, and meet stringent quality requirements for complex metal components.
From 2030 to 2035, the market is forecast to grow from USD 3.05 billion to USD 3.7 billion, adding another USD 0.74 billion, which constitutes 56.5% of the overall ten-year expansion. This period is expected to be characterized by integration of Industry 4.0 technologies including IoT sensors and predictive maintenance systems, development of hybrid bending technologies combining multiple forming methods, and expansion of electric automatic bending machine adoption driven by energy efficiency requirements. The growing focus on green manufacturing and digital transformation will drive demand for intelligent, energy-efficient automatic bending solutions across multiple industrial sectors.
Between 2020 and 2025, the market experienced steady expansion, driven by increasing industrialization in emerging economies and growing demand for automated metal fabrication solutions. The market developed as manufacturing facilities recognized the need for flexible, high-precision automatic bending equipment to support complex product designs and just-in-time production requirements. Environmental regulations and energy efficiency mandates began influencing procurement decisions toward advanced electric and hybrid automatic bending technologies.
| Metric | Value |
|---|---|
| Market Value (2025) | USD 2.4 billion |
| Market Forecast Value (2035) | USD 3.7 billion |
| Forecast CAGR (2025 to 2035) | 4.5% |
Market expansion is being supported by the rapid industrial automation across manufacturing sectors and the corresponding need for precision metal forming equipment in automotive, aerospace, construction, and electronics industries. Modern manufacturing operations require sophisticated automatic bending capabilities to produce complex geometries with tight tolerances, ensuring optimal product performance and assembly efficiency. The superior precision and repeatability characteristics of advanced CNC automatic bending machines make them essential equipment in high-volume production environments where consistency and quality control are critical success factors.
The growing focus on manufacturing efficiency and material waste reduction is driving demand for advanced automatic bending technologies from established equipment manufacturers with proven track records of reliability and innovation. Industrial operators are increasingly investing in multi-axis CNC automatic bending systems that offer automated tool changing, offline programming capabilities, and integrated quality control systems that reduce setup times and minimize scrap rates. Automotive lightweighting trends requiring complex forming of high-strength materials are establishing new performance benchmarks that favor precision-engineered automatic bending solutions with advanced control capabilities and adaptive bending algorithms.
The expansion of electric vehicle manufacturing is creating substantial demand for specialized automatic bending equipment capable of forming battery enclosures, structural components, and electrical conduit systems with exacting tolerances. The aerospace industry's increasing use of aluminum and titanium alloys requires automatic bending systems with precise force control and springback compensation capabilities. The construction and architectural metalwork sectors are adopting advanced automatic bending technologies to create complex facades, structural elements, and decorative features that meet contemporary design requirements while maintaining structural integrity. Labor shortages and rising labor costs in developed manufacturing economies are accelerating adoption of fully automatic bending systems that minimize manual intervention and enable lights-out manufacturing operations.
The market is segmented by technology type, application, end-use industry, and region. By technology type, the market is divided into hydraulic, electric, pneumatic, and induction automatic bending machines. Based on application, the market is categorized into metal sheet bending, tube and pipe bending, bar bending, and profile bending. By end-use industry, segments include automotive, aerospace, construction, electronics, furniture, and others. Regionally, the market is divided into Asia-Pacific, Europe, North America, Latin America, and Middle East &Africa.
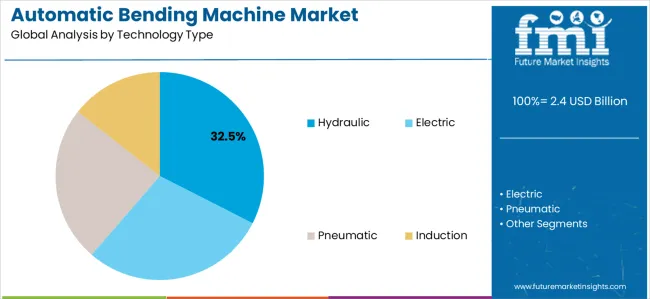
Hydraulic technology configurations are projected to account for 32.5% of the market in 2025. This leading share is supported by the superior force generation capabilities of hydraulic systems and their proven reliability in heavy-duty industrial applications requiring high tonnage bending operations. Hydraulic automatic bending machines excel in forming thick materials and large workpieces, making them the preferred choice for shipbuilding, heavy equipment manufacturing, and structural steel fabrication applications. The segment benefits from decades of technological refinement that have improved hydraulic system efficiency, control precision, and operational reliability while reducing maintenance requirements and energy consumption compared to earlier generation equipment.
Modern hydraulic automatic bending machines incorporate advanced proportional valve technology, closed-loop position control systems, and sophisticated pressure monitoring that deliver precision comparable to electric systems while maintaining the force advantages of hydraulic actuation. These innovations have significantly improved bend angle accuracy and repeatability while reducing cycle times through optimized ram speed control throughout the bending sequence. The heavy fabrication and shipbuilding sectors particularly drive hydraulic system demand, as these industries require exceptional force capacity to form thick plate materials and large structural components that exceed the capabilities of alternative technologies.
The hydraulic automatic bending machines offer favorable cost-performance ratios for mid-range tonnage applications, making them attractive solutions for general fabrication shops and contract manufacturers serving diverse customer requirements. The segment continues to evolve with integration of hybrid systems combining hydraulic power with electric control, offering the force benefits of hydraulic technology with the precision and energy efficiency advantages of electric drives. Environmental improvements including biodegradable hydraulic fluids and closed-loop systems are addressing eco-friendly concerns while maintaining the performance characteristics that have established hydraulic technology as an industry standard.
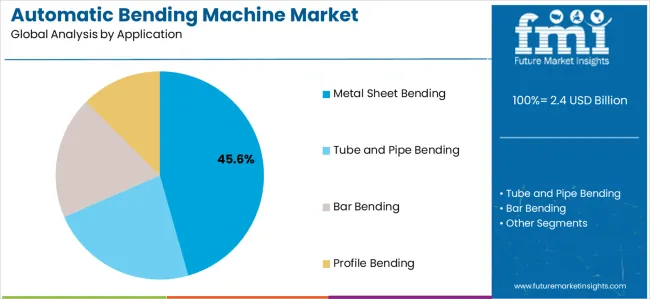
Metal sheet bending applications are expected to represent 45.6% of automatic bending machine demand in 2025. This dominant share reflects the fundamental importance of sheet metal forming across virtually all manufacturing sectors and the versatility of automatic press brake technology for creating enclosures, panels, brackets, and structural components. Sheet metal bending serves as a core fabrication process for automotive body panels, appliance housings, HVAC ductwork, electrical enclosures, and countless other products requiring formed sheet metal components. The segment benefits from continuous automotive and electronics industry expansion, with these sectors consuming enormous quantities of precisely bent sheet metal parts in their manufacturing operations.
Automatic press brake technology for sheet metal bending has evolved dramatically with CNC control systems enabling complex multi-bend sequences, automatic tool changing, and sophisticated backgauge positioning that dramatically reduce setup times and enable efficient small-batch production. Advanced automatic press brakes incorporate laser angle measurement systems, adaptive bending algorithms that compensate for material variations, and 3D simulation software that enables offline programming and collision detection. The growing demand for customized products and declining batch sizes favor flexible CNC automatic press brake technology that can efficiently handle frequent job changeovers and complex bending sequences without extensive manual programming.
The automotive industry's transition toward electric vehicles creates new opportunities for automatic sheet metal bending equipment, as battery enclosures, electronic component housings, and structural reinforcements require precise forming of aluminum and advanced high-strength steel alloys. The architectural metalwork sector increasingly utilizes advanced automatic press brakes for creating complex building facades, artistic installations, and decorative elements that push the boundaries of sheet metal forming capabilities. The electronics and telecommunications industries drive demand for precision automatic sheet metal bending equipment capable of forming thin materials with tight tolerances for server racks, networking equipment, and consumer electronics housings. The integration of robotic loading and unloading systems with automatic press brakes is enabling fully automated sheet metal fabrication cells that operate with minimal human intervention.
The automatic bending machine market is advancing steadily due to increasing industrial automation, growing recognition of precision manufacturing importance, and labor shortage challenges in developed economies. The market faces challenges including high initial capital investment requirements, need for specialized programming expertise, and varying material property requirements across different applications. The market must navigate supply chain complexities for precision components, integration challenges with existing manufacturing systems, and the ongoing need for operator training and skill development.
The growing deployment of IoT-enabled sensors, artificial intelligence, and cloud-based monitoring systems is enabling real-time performance optimization and predictive maintenance capabilities in automatic bending machine installations. Smart sensors and automated control systems provide continuous monitoring of operating parameters including force, position, angle accuracy, and tool wear while optimizing cycle times and extending equipment service life. These technologies are particularly valuable for high-volume manufacturing facilities that require consistent bending quality and minimal unplanned downtime. Advanced automatic bending machines now incorporate machine learning algorithms that analyze production data to optimize bending sequences, compensate for material variations, and predict maintenance requirements before failures occur.
Modern automatic bending machine manufacturers are incorporating advanced design technologies and materials that improve energy efficiency while reducing environmental impact through lower emissions and noise levels. Integration of servo-electric drives, regenerative braking systems, and optimized hydraulic circuits enables significant energy savings compared to traditional fixed-displacement hydraulic systems. Advanced control algorithms minimize energy consumption by optimizing motion profiles and reducing unnecessary machine movements during setup and idle periods. These energy efficiency improvements deliver tangible cost savings for manufacturers while supporting corporate eco-friendly commitments and compliance with increasingly stringent environmental regulations.
Labor market challenges in developed manufacturing economies are accelerating adoption of fully automatic bending systems that minimize manual intervention and reduce dependence on skilled operators. Rising wages, difficulty recruiting qualified metal fabrication workers, and retiring workforce demographics create compelling economic incentives for investing in automation technologies that maintain production capacity with reduced labor requirements. Automatic bending machines with integrated robotic loading systems, automated tool changing, and offline programming capabilities enable manufacturers to maintain competitive production costs while addressing labor availability constraints.
The automotive industry's ongoing transformation toward electric vehicles, lightweighting for improved efficiency, and increased use of advanced high-strength materials is creating substantial demand for sophisticated automatic bending equipment. Electric vehicle battery enclosures, structural reinforcements, and crash management systems require precise forming of aluminum alloys and high-strength steels that challenge conventional bending processes. Automatic bending machines with adaptive control systems, springback compensation, and precise force control are essential for achieving required dimensional accuracy when working with these advanced materials that exhibit unpredictable forming characteristics.
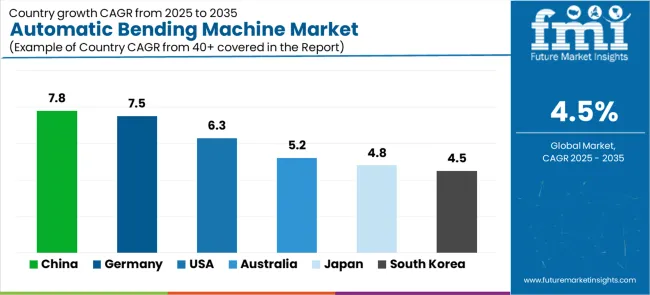
| Country | CAGR (2025 to 2035) |
|---|---|
| China | 7.8% |
| Germany | 7.5% |
| United States | 6.3% |
| Australia | 5.2% |
| Japan | 4.8% |
| South Korea | 4.5% |
The automatic bending machine market is growing rapidly, with China leading at a 7.8% CAGR through 2035, driven by massive manufacturing expansion, infrastructure development, and automotive industry growth. Germany and India follow at 7.5%, supported by precision engineering excellence and rising industrialization respectively. The United States shows solid growth at 6.3%, focusing on equipment modernization and advanced manufacturing initiatives. Australia records 5.2% growth, integrating automatic bending systems into expanding construction and mining equipment sectors. Japan demonstrates steady growth at 4.8%, focusing technological innovation and manufacturing excellence. South Korea maintains moderate expansion at 4.5%, supported by automotive and electronics industry demand.
The report covers an in-depth analysis of 40+ countries, top-performing countries are highlighted below.
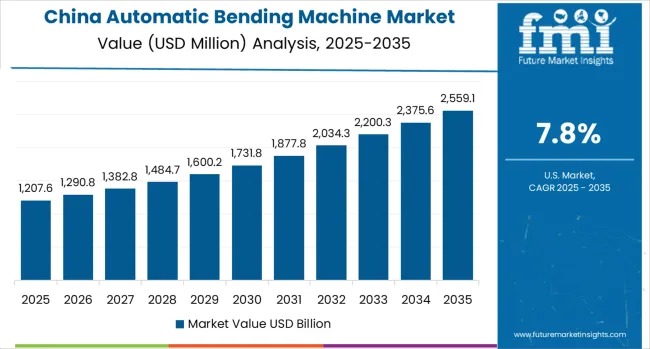
China is projected to exhibit the highest growth rate with a CAGR of 7.8% through 2035, driven by the country's position as the world's largest manufacturing economy and ongoing industrial modernization programs. China's automotive industry, the world's largest by production volume, creates enormous demand for automatic bending equipment to support vehicle body fabrication, chassis component production, and assembly of electric vehicle battery systems. The country's construction equipment, shipbuilding, and heavy machinery sectors require sophisticated automatic bending capabilities for forming structural components, reinforcements, and complex assemblies. Government initiatives promoting intelligent manufacturing and Industry 4.0 adoption are accelerating investment in advanced automatic bending technologies across Chinese manufacturing facilities.
Major Chinese manufacturing hubs including Guangdong, Jiangsu, Zhejiang, and Shandong provinces are implementing comprehensive industrial automation programs that prioritize adoption of CNC-controlled fabrication equipment including automatic bending machines. The rapid expansion of China's domestic equipment manufacturing industry is developing competitive automatic bending machine offerings that combine international technology with cost advantages, increasing market accessibility for small and medium enterprises. China's Belt and Road infrastructure initiatives are driving demand for construction and industrial equipment that requires extensive metal fabrication capabilities supported by automatic bending technology.
Germany is expanding at a CAGR of 7.5%, supported by the country's leadership in precision engineering, automotive manufacturing, and advanced metal fabrication technologies. German automotive manufacturers including Volkswagen, BMW, Mercedes-Benz, and numerous tier-1 suppliers maintain some of the world's most sophisticated metal fabrication facilities, driving continuous demand for cutting-edge automatic bending equipment. The country's Mittelstand companies, specialized medium-sized manufacturers serving niche industrial markets, represent substantial customers for high-precision automatic bending systems that enable production of complex components with exacting tolerances.
Germany's focus on Industry 4.0 and digital manufacturing transformation positions the country at the forefront of smart factory implementation, with automatic bending machines serving as critical components of integrated production systems. German equipment manufacturers including TRUMPF, Bystronic, and others maintain global leadership in automatic bending machine technology, driving innovation in areas including electric drive systems, adaptive control algorithms, and digital integration capabilities. The country's strong export orientation across automotive, machinery, and industrial equipment sectors ensures sustained investment in advanced manufacturing technologies including automatic bending systems.
India is projected to grow at a CAGR of 7.5%, driven by rapid industrialization, expanding automotive manufacturing capacity, and government initiatives promoting domestic manufacturing. India's automotive industry is experiencing substantial growth with major international manufacturers including Maruti Suzuki, Hyundai, Tata Motors, and others expanding production facilities to serve both domestic and export markets. The country's burgeoning construction sector, infrastructure development programs, and expansion of manufacturing capabilities across diverse industries are creating substantial demand for metal fabrication equipment including automatic bending machines.
Government programs including 'Make in India'and Production Linked Incentive schemes are encouraging investment in advanced manufacturing technologies, with automatic bending machines representing critical equipment for establishing competitive production capabilities. India's growing middle class and increasing consumer demand for automobiles, appliances, and consumer goods are driving capacity expansion across manufacturing sectors that rely heavily on sheet metal fabrication and tube bending processes. The country's cost-competitive manufacturing environment combined with improving technical capabilities is attracting foreign investment in production facilities that incorporate modern automatic bending technologies.
The United States is expanding at a CAGR of 6.3%, driven by manufacturing reshoring initiatives, defense industry requirements, and ongoing industrial facility modernization. American manufacturers are investing in advanced automation technologies including automatic bending machines to improve productivity, reduce labor costs, and maintain competitive advantages as production returns from offshore locations. The aerospace and defense sectors, with substantial presence in the United States, require sophisticated automatic bending equipment capable of forming exotic materials including titanium, Inconel, and other specialized alloys with exacting quality standards and full traceability.
The United States automotive industry, while smaller than China's, maintains significant advanced manufacturing capabilities with increasing focus on electric vehicle production requiring specialized automatic bending equipment for battery enclosures and structural components. Construction equipment manufacturers including Caterpillar, John Deere, and others represent major consumers of automatic bending machines for producing heavy equipment components, structural elements, and hydraulic system components. Government infrastructure investment programs and military equipment modernization initiatives support steady demand for metal fabrication equipment including advanced automatic bending systems.
Australia is growing at a CAGR of 5.2%, driven by the country's robust mining industry, construction sector expansion, and manufacturing of agricultural and earthmoving equipment. Australia's mining sector, one of the world's largest, creates substantial demand for fabrication equipment including automatic bending machines to support production of mining equipment components, structural elements, and material handling systems. The country's construction industry, experiencing strong growth in urban centers including Sydney, Melbourne, and Brisbane, requires extensive metal fabrication capabilities for structural steel work, architectural metalwork, and building systems.
Australian manufacturers of agricultural equipment, mining machinery, and specialized industrial equipment rely on automatic bending machines to produce components for export markets and domestic customers. The country's geographic isolation and high labor costs create compelling economics for automation investment, with automatic bending machines enabling Australian manufacturers to maintain competitive production capabilities despite wage disadvantages compared to Asian manufacturing locations. Growing focus on local content in mining and construction projects supports investment in domestic fabrication capabilities including advanced automatic bending equipment.
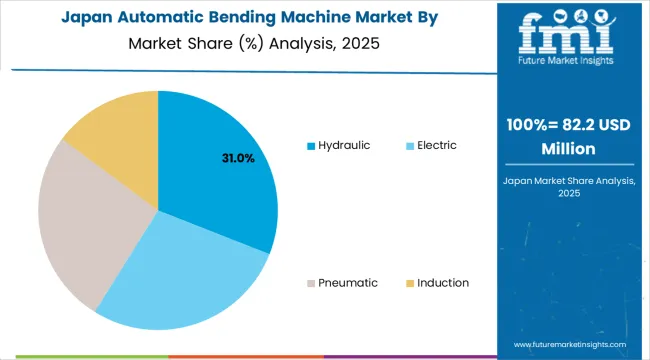
Japan is expanding at a CAGR of 4.8%, driven by the country's focus on precision manufacturing, continuous process improvement, and development of advanced automation technologies. Japanese manufacturers including AMADA maintain global leadership in automatic bending machine technology, with ongoing innovation in areas including servo-electric drive systems, adaptive control algorithms, and integration with robotic systems. The country's automotive industry, including Toyota, Honda, Nissan, and extensive tier-1 supplier base, drives sophisticated demand for high-precision automatic bending equipment capable of forming advanced materials with tight tolerances.
Japan's electronics and industrial equipment sectors require precision automatic bending capabilities for producing enclosures, chassis components, and structural elements with exacting dimensional requirements. The country's aging workforce and declining manufacturing labour availability create strong incentives for automation investment, with automatic bending machines enabling manufacturers to maintain production capacity while reducing labour requirements. Japanese manufacturers'focus on lean manufacturing principles and continuous improvement methodologies drives demand for automatic bending systems that minimize setup times, reduce material waste, and maximize equipment effectiveness.
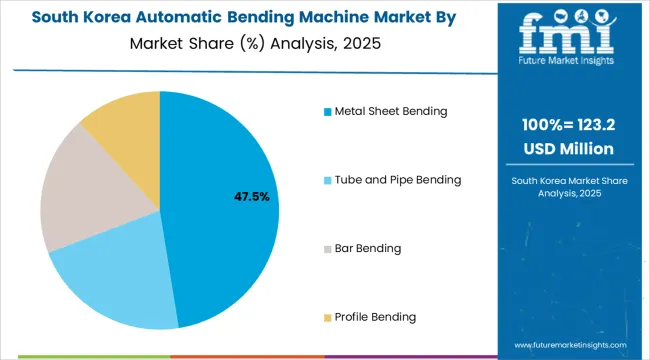
South Korea is projected to grow at a CAGR of 4.5%, supported by the country's advanced automotive industry, electronics manufacturing sector, and shipbuilding capabilities. Korean automotive manufacturers including Hyundai and Kia maintain sophisticated production facilities with extensive metal fabrication requirements driving demand for advanced automatic bending equipment. The country's electronics industry, producing consumer electronics, semiconductors, and telecommunications equipment, requires precision automatic bending capabilities for forming enclosures, thermal management components, and structural elements.
South Korea's shipbuilding industry, among the world's largest, utilizes specialized automatic bending equipment for forming hull plates, structural components, and piping systems for commercial vessels and offshore platforms. Government initiatives promoting smart manufacturing and digital transformation are accelerating adoption of Industry 4.0 technologies including connected automatic bending machines with real-time monitoring and predictive maintenance capabilities. Korean manufacturers'focus on quality and efficiency drives investment in advanced automatic bending systems that deliver superior performance and reliability.
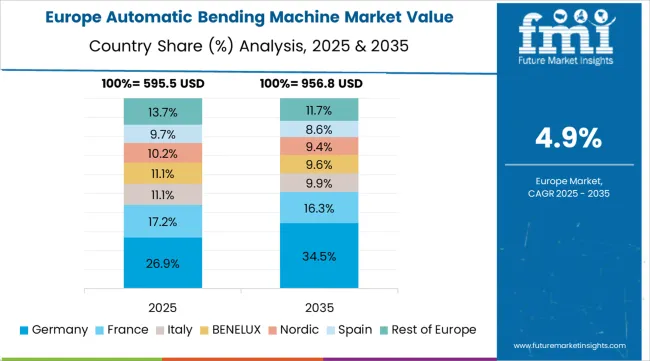
The automatic bending machine market in Europe is projected to grow from USD 742 million in 2025 to USD 1.08 billion by 2035, registering a CAGR of 3.8% over the forecast period. Germany is expected to maintain its leadership with a 38.5% share in 2025, supported by its dominant automotive industry, precision engineering excellence, and leadership in equipment manufacturing. Italy follows with 18.2% market share, driven by extensive metalworking tradition, furniture manufacturing sector, and machinery production capabilities. France holds 13.5% of the European market, benefiting from automotive industry presence, aerospace manufacturing, and industrial equipment production. The United Kingdom commands 11.8% market share, supported by aerospace industry requirements, automotive manufacturing, and ongoing industrial modernization programs. Spain accounts for 8.2% of regional demand, with growing automotive production and construction sector activity. The Nordic countries (Sweden, Denmark, Finland, Norway) collectively represent 5.3% of the market, focusing advanced automation adoption and precision manufacturing applications. The Rest of Europe region, including Netherlands, Belgium, Switzerland, Austria, Poland, Czech Republic, and other markets, accounts for 4.5% of the market, supported by expanding automotive supply chains, industrial equipment manufacturing, and growing adoption of automated fabrication technologies across Central and Eastern European manufacturing facilities.
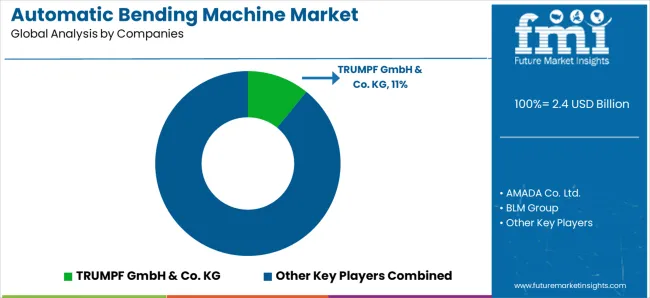
The market is characterized by competition among established equipment manufacturers, specialized machine tool companies, and regional engineering firms. Companies are investing in servo-electric drive technology development, advanced control systems, Industry 4.0 integration, and automation solutions to deliver high-performance, precise, and cost-effective automatic bending systems. Strategic partnerships with automotive manufacturers, technological advancement, and geographic expansion are central to strengthening product portfolios and market presence.
TRUMPF GmbH &Co. KG, operating globally from Germany, maintains strong market position through comprehensive automatic bending machine portfolios spanning press brakes, panel benders, and tube bending systems with focus on precision engineering, technological innovation, and digital integration. AMADA Co. Ltd., Japanese multinational, provides advanced automatic bending solutions with leadership in hydraulic technology and strong presence across Asian and European markets. BLM Group, Italian, delivers specialized automatic tube and pipe bending equipment with focus on automotive and aerospace applications. Bystronic, Swiss-based, offers sophisticated automatic press brake systems with advanced control technologies and automation capabilities.
Soco Machinery, Chinese manufacturer, provides competitive automatic bending equipment serving Asian markets with expanding global presence. Salvagnini delivers innovative panel bending systems and press brake technology with focus on automation and material handling integration. Prima Power offers comprehensive automatic bending solutions with focus on sheet metal fabrication and system integration. LVD Group provides advanced automatic press brake systems with sophisticated control technologies and tooling solutions.
Durmazlar, Accurl, Cincinnati Incorporated, Haco, Safan Darley, Ermaksan, IMAG, Colgar, Kingball, Jorgenson Machine Tools, and Yangli Group offer specialized automatic bending expertise, regional manufacturing capabilities, and technical support across global and regional networks.
| Item | Value |
|---|---|
| Quantitative Units | USD 2.4 billion |
| Technology Type | Hydraulic (32.5%), Electric, Pneumatic, Induction |
| Application | Metal Sheet Bending (45.6%), Tube and Pipe Bending, Bar Bending, Profile Bending |
| End-Use Industry | Automotive, Aerospace, Construction, Electronics, Furniture, Heavy Machinery, Others |
| Regions Covered | Asia-Pacific, Europe, North America, Latin America, Middle East &Africa |
| Country Covered | China, Germany, India, United States, Australia, Japan, South Korea, and other 40+ countries |
| Key Companies Profiled | TRUMPF GmbH &Co. KG, AMADA Co. Ltd., BLM Group, Bystronic, Soco Machinery, Salvagnini, Prima Power, LVD Group, Durmazlar, Accurl, Cincinnati Incorporated, Haco, Safan Darley, Ermaksan, IMAG, Colgar, Kingball, Jorgenson Machine Tools, Yangli Group |
| Additional Attributes | Dollar sales by technology type and application, regional demand trends across Asia-Pacific, Europe, and North America, competitive landscape with established manufacturers and emerging suppliers, buyer preferences for hydraulic versus electric systems, integration with robotic automation and Industry 4.0 technologies, innovations in control systems and adaptive bending algorithms for enhanced accuracy, and adoption of smart automatic bending solutions with embedded sensors and predictive maintenance capabilities for improved operational efficiency. |
The global automatic bending machine market is estimated to be valued at USD 2.4 billion in 2025.
The market size for the automatic bending machine market is projected to reach USD 3.7 billion by 2035.
The automatic bending machine market is expected to grow at a 4.5% CAGR between 2025 and 2035.
The key product types in automatic bending machine market are hydraulic, electric, pneumatic and induction.
In terms of application, metal sheet bending segment to command 45.6% share in the automatic bending machine market in 2025.


Full Research Suite comprises of:
Market outlook & trends analysis
Interviews & case studies
Strategic recommendations
Vendor profiles & capabilities analysis
5-year forecasts
8 regions and 60+ country-level data splits
Market segment data splits
12 months of continuous data updates
DELIVERED AS:
PDF EXCEL ONLINE
Automatic Riveting Equipment Market Forecast and Outlook 2025 to 2035
Automatic Transmission Market Size and Share Forecast Outlook 2025 to 2035
Automatic Emergency Braking System Market Size and Share Forecast Outlook 2025 to 2035
Automatic Floodgate Market Size and Share Forecast Outlook 2025 to 2035
Automatic Dependent Surveillance-Broadcast (ADS-B) System Market Size and Share Forecast Outlook 2025 to 2035
Automatic Emergency Braking (AEB) Market Size and Share Forecast Outlook 2025 to 2035
Automatic Identification and Data Capture Market Size and Share Forecast Outlook 2025 to 2035
Automatic Transfer Switch Market Size and Share Forecast Outlook 2025 to 2035
Automatic Weapons Market Size and Share Forecast Outlook 2025 to 2035
Automatic Bottle Opener Market Size and Share Forecast Outlook 2025 to 2035
Automatic Hog Feeder Market Size and Share Forecast Outlook 2025 to 2035
Automatic Goat Waterer Market Size and Share Forecast Outlook 2025 to 2035
Automatic Wine Dispensers Market Size and Share Forecast Outlook 2025 to 2035
Automatic Content Recognition Market Size and Share Forecast Outlook 2025 to 2035
Automatic Dishwasher Market Size and Share Forecast Outlook 2025 to 2035
Automatic Dicing Saw Market Analysis - Size, Share, and Forecast Outlook 2025 to 2035
Automatic Paper Cutter Market Size, Trends, and Forecast 2025 to 2035
Automatic Gearbox Valves Market Growth - Trends & Forecast 2025 to 2035
Automatic Door Control Market Analysis - Size, Share & Forecast 2025 to 2035
Automatic Tire Inflation System Market Growth - Trends & Forecast 2025 to 2035

Thank you!
You will receive an email from our Business Development Manager. Please be sure to check your SPAM/JUNK folder too.
Chat With
MaRIA