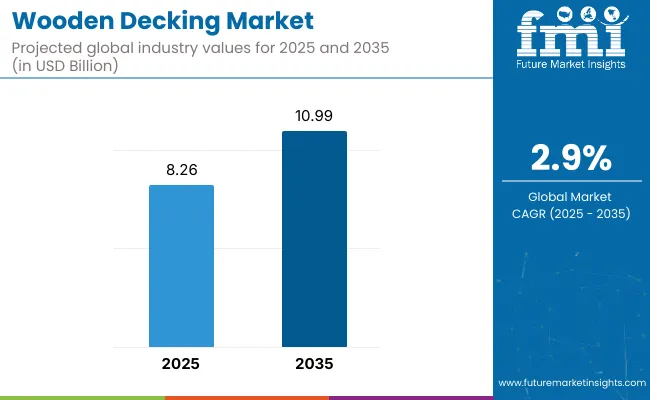
Wooden decking market revenue is estimated at USD 8.26 billion in 2025 and expected to reach USD 10.99 billion by 2035, expanding at a 2.9% CAGR. In 2025 the United States is the most lucrative country, buoyed by brisk remodeling cycles and a strong “outdoor-living” culture. India, where premium housing and hospitality projects are multiplying across Tier-1 and Tier-2 cities, is projected to be the fastest-growing national market from 2025 to 2035.

Eco-conscious building codes, homeowners’ appetite for low-maintenance back-yard spaces, and contractors’ push for faster installs are reshaping the wooden decking market. Demand is shifting toward thermally modified boards that resist rot without chemical preservatives, while composites siphon share from mid-grade softwoods. Nevertheless, lumber-price volatility and stricter fire-rating rules restrain uptake in cost-sensitive regions, nudging suppliers to bundle carbon-neutral sourcing, factory pre-finishing, and extended warranties.
Looking ahead, the wooden decking market is set to pivot toward data-driven design and circular materials. AI-powered visualizers will customise board layouts to minimise off-cuts, and digital twins will predict lifetime performance under local UV and rainfall profiles.
Manufacturers investing in bio-based water-repellent coatings, recyclable modular plank systems, and “deck-as-a-service” financing are poised to secure outsized share as municipalities mandate embodied-carbon disclosures by 2030.
Heat-treated ash, pine, and spruce are winning specification in luxury residences and coastal resorts because they deliver tropical-hardwood durability without tropical sourcing. Their zero-chemical profile aligns with green-building credits, while dimensional stability cuts callbacks for warped boards.
Cedar is enjoying a style-driven rebound in boutique projects, but pressure-treated pine still anchors high-volume deck replacements. Suppliers are scaling kiln capacity and applying matte pre-oils to accelerate adoption across Europe and East Asia.
| Wood Type | CAGR (2025 to 2035) |
|---|---|
| Thermally Modified Wood | 3.8% |
Emerging-market housing booms, mixed-use promenades, and resort pipelines are propelling demand for turnkey deck packages in greenfield projects. Developers favour prefabricated joist-and-plank kits that shave on-site labour and integrate concealed drainage. While repairs & remodeling remains the larger slice-fuelled by ageing North-American stock-new-build activity is outpacing it as urban planners earmark rooftop terraces and podium gardens for resident amenities.
| Construction Type | CAGR (2025 to 2035) |
|---|---|
| New-Build Deck Installations | 3.4 % |
With the help of Future Market Insights, new industry research has gathered the perspective of the pool of key suppliers, manufacturers, contractors, and end users contributing to the wooden decking business.
The results showed in more than 65% of the sample that sustainability and performance are the most relevant priorities for consumers, with a preference for eco-friendly decking materials such as thermally treated wood and composite decking. Many industry participants highlighted the growing impact of regulation that promotes green building, which has driven manufacturers to experiment with recycled and sustainably sourced materials.
The second biggest trend identified was the demand for weather-resistant and low-maintenance decking materials. More than half of those interviewed said that they had preferred modified wood and pressure-treated wood because of its better resistance to water, insects, and wear. Contractors were also considered wanting more durability and low maintenance expenses when selecting decking material, which is a demand driver for high-performance wood treatment technology.
Further, regional growth trends were also observed as North America and Europe maintained rankings, supported by growing renovations and outdoor living trends. On the other hand, the Asia-Pacific region shows immense opportunity due to the rise in urbanization, which increases the demand for upscale residential and commercial decking projects. The use of virtual design software supporting 3D CGI visualization is increasing in customer decision-making, as buyers prefer to preview their decking projects before installation.
Given the active landscape of the industry, it is expected that emerging technologies and sustainability efforts will continue to shape industry dynamics. Professional fields that embrace innovative designs and green tools are likely to be the leaders in the following years.
| Countries | Regulations & Mandatory Certifications |
|---|---|
| United States | The Lacey Act prohibits the sale of wood that is harvested illegally. The EPA’s formaldehyde standards for composite wood products control emissions. These usually require FSC (Forest Stewardship Council) and SFI (Sustainable Forestry Initiative) certification. |
| United Kingdom | UK Timber Regulation (UKTR) compliant-ensuring timber is sourced legally. BS EN 350 mandates the compulsory durability classification of construction timber. Others are better, such as FSC or PEFC (Programme for the Endorsement of Forest Certification). |
| France | The product meets the three-party wood sourcing sustainability standards in accordance with the EU Timber Regulation (EUTR). NF EN 335 classifies wood based on its resistance to decay and FSC are widely respected certifications. |
| Germany | These woods should be compliant with EN 14081-1 according to the German BauPVO regulation. Green wood products should bear the two Blue Angel eco-labels. Sustainable procurement FSC and PEFC certifications. |
| Italy | The EUTR and national legislation comply with the legal origin of wood. This standard for structural wood classification is the UNI 11035. Public and private sectors prefer FSC and PEFC certification. |
| South Korea | The Sustainable Use of Timbers Act governs the industry. The Korean Eco-Label certification is available for decking products. There is an increasing prevalence of FSC and PEFC. |
| Japan | The Clean Wood Act promotes legal timber sourcing. Structural wood shall obtain JAS (Japanese Agricultural Standard) certification. SGEC (Sustainable Green Ecosystem Council) is a forestry certification in Japan. |
| China | CFCS, or the China Forest Certification Scheme, complies with international standards. The Green Building Evaluation Standard encourages sustainable decking materials, with certification from the FSC and PEFC becoming increasingly common. |
| Australia & New Zealand | Under the Illegal Logging Prohibition Act, wood must be sourced legally. Timber durability classification is determined by Australian Standard AS 5604. Commonly held certifications are FSC, PEFC, and Australian Forestry Standard (AFS). |
| India | Deforestation as well as the use of sustainable wood are regulated under the Forest (Conservation) Act and the National Timber Policy. For pressure-treated wood, ISI (Indian Standards Institute) certification is mandatory. FSC or PEFC certification is required for exports. |

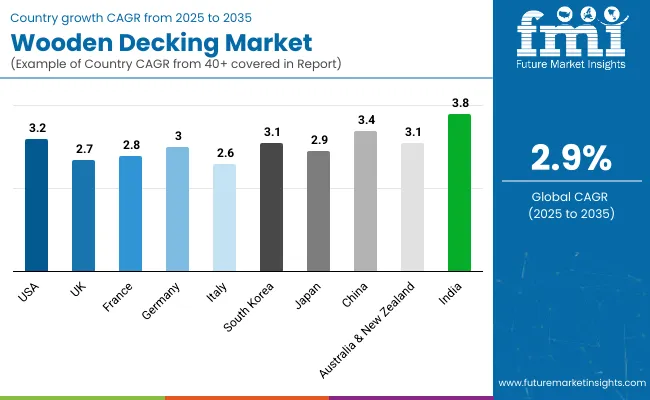
USA Industry for Wooden Decking Grows at a CAGR of 3.2% The industry is expected to grow at a CAGR of 3.2% between 2025 and 2035, driven by an increase in home remodeling activities, the emergence of outdoor living spaces, and the implementation of sustainability regulations.
FSC & SFI-certified wooden supplies are being encouraged by the Lacey Act and EPA's Formaldehyde Standards, and these developments will further drive the industry towards the sustainable decking solution. Composite decking is gaining traction because of its durability; pressure-treated wood remains strong in budget-sensitive applications.
The UK decking industry for wood is projected to grow at a CAGR of 2.7% from 2025 to 2035, which is marginally below the global average. The UK Timber Regulation (UKTR) and BS EN 350 standards require that companies diversify both their supplier and sourcing bases to meet the increasing demand for sustainably sourced products, such as FSC and PEFC timber.
Apartment living and limited outdoor space have made small and compact decking solutions rise in popularity, from rooftop decking to balcony decking to other small spaces. Weather resistance and its low maintenance needs, especially in heavy rainfall areas, are making composite decking gain more industry share. Public sector projects and business landscaping are also driving industry growth.
The industry for wood decking in France is projected to register a CAGR of 2.8% from 2025 to 2035, owing to demand for sustainability initiatives and refurbishment activities. The EU Timber Regulation (EUTR) comes with severe wood procurement regulations where certifications like FSC and PEFC become imperative for the suppliers. As France’s attention on sustainable building has grown, demand has soared for thermally treated wood and composite decking, both of which are resistant to water and long-lasting.
Hotel and tourism industries are significant, with hotels and resorts investing in premium decking for an attractive outdoor space. Green decking solutions are also extending the usage of sustainable materials to urban redevelopment schemes in cities including Paris and Lyon.
Between 2025 and 2035, the industry for wood decking in Germany is expected to grow at a CAGR of 3.0%, which is the same as the overall global average. Guidelines such as the Blauer Engel eco-label as well as the German Construction Products Regulation (BauPVO) are guiding the industry towards increasingly low-emission and sustainably sourced decking products.
Wood that is pressure treated and thermally modified is becoming popular due to its resistance to weathering. Demand for composite decking also continues its upward trajectory in sales on commercial urban schemes and high-end residential developments.
Moreover, favourable architectural styles for open spaces and recreational areas, as well as the innovation of smart technology in decking products, will also propel industry growth, with Germany being one of the major contributors to the European wooden decking industry.
Italy's wooden decking industry is projected to grow at a CAGR of 2.6% from 2025 to 2035, slightly below the global average. The sector is buoyed by restoration projects in ancient towns and increased spending on tourism and luxury property. Both the private and public sectors widely accept regulations-EUTR, FSC, and PEFC certifications. Italian consumers increasingly prefer thermally treated and composite decking due to their durability and aesthetic qualities.
Outside recreation and hospitality sectors are major demand drivers, including for destinations like Tuscany and the Amalfi Coast. The circular economy strategy also accelerates the use of recycled and reclaimed wood. The future of the Italian wooden decking industry is going to get marked with sustainable architecture and climate-resilient structures, which is why green materials are being used.
Wood decking sales in South Korea are expected to grow at approximately 3.1% CAGR from 2025 to 2035, driven by rapid urbanization and increased investment in smart city projects. The Korean Eco-Label and the Act on the Sustainable Use of Timbers promote wood that is eco-friendly and is cut down legally. The growing demand for decking material that is high in durability and weather resistant is due to urban landscaping initiatives and public parks.
Moving towards outdoor leisure areas in high-rise buildings is also taking hold of consumers' choices, increasing demand for modular and prefabricated decking. In addition, improvements in wood treatment technology are extending the life of decking products, enabling them to be more suitably used in South Korea's tropical climate. Government focus on green infrastructure and smart materials will further push growth in this industry.
In line with the global average, Japan's wooden decking industry is projected to grow at a CAGR of 2.9% from 2025 to 2035. Methods such as the Clean Wood Act and JAS (Japanese Agricultural Standards) certification ensure that decking products meet high quality and environmental standards.
Compact and modular decking is a significant trend, particularly in high-density urban centers where space efficiency is crucial. Wood with the advantages of low maintenance, durability, and weather resistance is preferred by Japanese consumers, which in turn leads to growth in composite and thermally treated wood decking.
The coziness of traditional Japanese architecture and its focus on natural beauty continue to drive demand for premium hardwoods. Furthermore, growing government initiatives to promote energy efficiency and eco-friendly materials are expected to further drive the industry growth. Digital design platforms are also on the rise, helping with deck customization and installation planning.
The rapid pace of urbanization, the rise in disposable incomes, and the government's policies to promote and introduce green building materials in China are bolstering demand for wood decking in the region. With outdoor spaces becoming an increasingly popular feature for housing projects, commercial buildings, and parks, demand for sustainable, long-lasting decking products is on the rise.
Government policies that promote environmentally friendly timber and take action against illegal imports of FSC and thermally modified timber have driven this trend. The rise in investment in smart cities and luxurious residential projects is also contributing to the demand for premium wooden decking. Overseas competitors, including domestic producers and suppliers, are investing in sustainable forestry initiatives and automation to sustain long-term competitiveness. The Chinese industry will see a steady growth at 3.4% CAGR between 2025 and 2035.
Several factors, including increased demand for outdoor rooms, bushfire-resistant products, and sustainable building, are driving the Australian and New Zealand wooden decking industries. Then there are the high-quality timbers like spotted gum, blackbutt, and jarrah, which keep being in demand because they last longer and can cope with the toughest of conditions.
Trends in home renovation, particularly in the suburbs, have also added to the popularity of wooden decking as a defining feature for patios, pool areas, and garden settings. With rising environmental concerns, manufacturers are leveraging government incentive programs to produce carbon-neutral and environmentally friendly decking products. The Australian and New Zealand industry is projected to grow at a compound annual growth rate (CAGR) of less than 3.1% from 2025 to 2035.
Urbanization, increasing homeownership, and rising disposable incomes are making India one of the fastest-growing industries for wooden decking. The demand for upper-crust wooden decking solutions has been fired up by luxury housing and high-demand real estate industries in both large cities, like Mumbai, Bangalore, and Delhi, NCR. In addition, the expansion of resorts, restaurants, and hotels is driving demand for premium hardwood and imported timber decking during the forecast period.
Government initiatives on sustainable forestry and the import of tropical hardwoods mean local producers are choosing treated pine, teak, and engineered wood. To explore the wider reachability of decking solutions, manufacturers are attempting to expand their distribution networks for Tier-1 and Tier-2 cities. From 2025 to 2035 the Indian industry is expected to grow significantly with a CAGR of 3.8%.

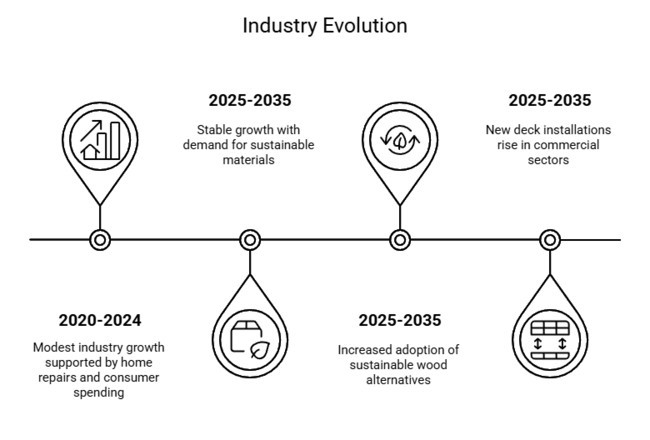
| 2020 to 2024 | 2025 to 2035 |
|---|---|
| Industry growth was modest, supported by home repairs and post-pandemic consumer spending on outdoors. | Growth is expected to remain stable with increasing demand for sustainable and long-lasting decking materials. |
| Production and availability were impacted by supply chain disruptions and volatility in lumber prices. | Stabilized supply chains, along with alternative wood resources, should continue to support material availability. |
| Pressure-treated wood remained most popular, although composite decking was also popular because of low maintenance. | Sustainable wood alternatives, thermally modified wood, and premium hardwoods will see greater adoption. |
| The residential segment dominated due to increased activities in renovation post-Covid. | Outdoor trends are moving faster in commercial and hospitality industries. |
| Environmental laws tightened, increasing demand for certified wood. | Sustainable sourcing regulations will continue to push the industry toward eco-friendly and responsibly sourced products. |
| Repairs & remodeling accounted for the majority of projects, with homeowners replacing or re-facing existing decks. | New deck installations will rise, particularly in commercial and hospitality sectors, as homeownership continues to increase. |
The industry for wood decking falls under the other construction and building materials, more specifically the outdoor infrastructure and landscaping, and is directly correlated to the residential and commercial real estate, urban development, and home improvement industries.
The residential trends of each industry, disposable income, construction expenditure, and green policies from the macroeconomic assumption affect the industry. The period from 2020 to 2024 witnessed moderate growth in the industry, fuelled by home renovation projects following the COVID-19 pandemic; however, continued supply chain issues as well as volatility in timber prices persisted as a major challenge. Growth between 2025 and 2035 will be driven by normalized supply chains, increased real estate investment, and growing consumer demand for sustainable backyards.
Demand for thermally modified and FSC-certified wood will increase due to global urbanization and stricter green building codes. Government regulations on carbon neutrality and sustainable construction will drive manufacturers toward environmentally friendly decking solutions. So will mortgage affordability and interest, as good rates incentivize house-building and refurbishment.
The commercial sector, including hospitality, office, and recreational facilities, will play a key role in industry growth. As has been witnessed with the advancement of digitalization, AI-based design software and robotized decking installation will only add to the efficiency and streamlining of operations in the industry, thus making the industry more competitive and efficient.
The global wood decking industry is competitive, due to them focusing on pricing, innovativeness, partners, and crescent. Competitive manufacturing, sustainable timber sourcing, and innovations in weatherproof and fire-resistant decking are key differentiators. Industry access is enhanced through strategic alliances with builders and retailers, while regional production and e-commerce expansion improve accessibility.
Sustainability, acquisitions, and AI-assisted design software are the focus for industry leaders like Trex, UPM, and Weyerhaeuser. Companies are also automating the process to comply with green regulations proposed by green certifications (FSC, PEFC). The focus is on technology, sustainability, and the expansion of industries from 2025 to 2035.
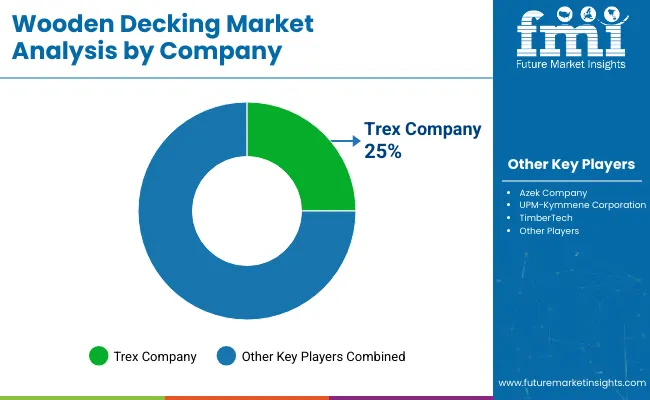
Industry Share Analysis

Trex Company
Estimated Industry Share: ~25%
Trex, a leader in composite decking, has established its dominance through innovation and sustainability. In addition, its wide array of sustainable products and a strong distribution network fuel its dominance in the industry.
Azek Company
Estimated Industry Share: ~20%
Azek has retained its competitive position through selling premium products and selective retail partnerships. It focuses on ensuring cost management and competitive pricing by studying advanced manufacturing technologies.
UPM-Kymmene Corporation
Estimated Industry Share: ~15%
As one of the key players within the wooden decking space, UPM-Kymmene has marked its territory in developing industries, especially Asia-Pacific. It also improved its standing in the industry with regard to treatment and durability technologies.
TimberTech
Estimated Industry Share: ~10%
The company TimberTech brims with its reclaimed and bio-based deck and deck boards. TimberTech is making a significant impact with green and eco-friendly consumers.
Others (regional and small companies)
Estimated Industry Share: ~30%
A healthy mix of regional producers and small companies catering to niche industries and local demand as a result is bringing global diversity into the wooden decking industry.
Growth Opportunities
Sustainable & Certified Wood Products-As global regulations call for sustainability alike, companies investing in FSC, PEFC, and thermally modified wood will have a competitive edge. Carbon-neutral and reclaimed wood portfolios offer green building project diversification.
Modular and prefabricated decking solutions-demand for pre-assembled, easy-to-install decking is rising as constructors seek to minimize labour in costly urban industries. Assembling a larger capacity of modular wooden decks can drive industry penetration.
The demand for premium decking solutions in the hospitality, resort, and office building sectors is significant. This growing demand could provide an opportunity for manufacturers to target bespoke and high-end wooden decking for commercial properties.
Weather-Resistant & Smart Decking: Advanced decking materials with enhanced water resistance, UV protection, and anti-slip coatings can appeal to technology-driven industries. Timber innovation: fire-resistant wood for bushfire-prone regions.
Recommendations
Real-Time Interaction-Businesses need to set up direct sourcing contracts for equities or futures or investment in either sustainable forestry producers or wood treatment plants to deal with the unstable prices of raw materials.
Target Growth Industries-China, India, and South Korea are expected to lead in CAGR growth. Establishing local production or strategic alliances in these regions can maximize industry growth.
Hybrid Material Development-Combining natural wood with advanced composite technologies may result in more durable and appealing products for both budget-conscious and high-end consumers.
Digital Marketing: a virtual visualization tools AI-based customization software, for example, deck designs, can significantly translate into increased customer engagement, particularly when done on a direct-to-consumer/e-commerce basis.
Regulatory Flexibility-Obtaining sustainability certifications and complying with green building codes before their enforcement can enhance credibility and provide access to premium pricing opportunities.
the industry is segmented into pressure treated wood, redwood, cedar Wood and others
it is segmented into repairs & remodeling, new decks
it is divided into residential and non-residential
it is segmented into North America, Latin America, Europe, Asia Pacific and Middle East & Africa
Home remodeling, outdoor living, and green trends.
Common types of wood used for decking include pressure-treated wood, cedar, redwood, and thermally modified wood.
Certifications, such as FSC and PEFC, help ensure sustainable sourcing of wood products, and some regions have adopted fire-resistant codes.
Asia-Pacific has been the source of demand, with growth coming from countries like China and India due to increased urbanization and construction activity.
This includes certain components such as prefab and modular systems, weatherization coatings, and AI-driven custom-build software.


Our Research Products

The "Full Research Suite" delivers actionable market intel, deep dives on markets or technologies, so clients act faster, cut risk, and unlock growth.

The Leaderboard benchmarks and ranks top vendors, classifying them as Established Leaders, Leading Challengers, or Disruptors & Challengers.

Locates where complements amplify value and substitutes erode it, forecasting net impact by horizon

We deliver granular, decision-grade intel: market sizing, 5-year forecasts, pricing, adoption, usage, revenue, and operational KPIs—plus competitor tracking, regulation, and value chains—across 60 countries broadly.

Spot the shifts before they hit your P&L. We track inflection points, adoption curves, pricing moves, and ecosystem plays to show where demand is heading, why it is changing, and what to do next across high-growth markets and disruptive tech

Real-time reads of user behavior. We track shifting priorities, perceptions of today’s and next-gen services, and provider experience, then pace how fast tech moves from trial to adoption, blending buyer, consumer, and channel inputs with social signals (#WhySwitch, #UX).

Partner with our analyst team to build a custom report designed around your business priorities. From analysing market trends to assessing competitors or crafting bespoke datasets, we tailor insights to your needs.
Supplier Intelligence
Discovery & Profiling
Capacity & Footprint
Performance & Risk
Compliance & Governance
Commercial Readiness
Who Supplies Whom
Scorecards & Shortlists
Playbooks & Docs
Category Intelligence
Definition & Scope
Demand & Use Cases
Cost Drivers
Market Structure
Supply Chain Map
Trade & Policy
Operating Norms
Deliverables
Buyer Intelligence
Account Basics
Spend & Scope
Procurement Model
Vendor Requirements
Terms & Policies
Entry Strategy
Pain Points & Triggers
Outputs
Pricing Analysis
Benchmarks
Trends
Should-Cost
Indexation
Landed Cost
Commercial Terms
Deliverables
Brand Analysis
Positioning & Value Prop
Share & Presence
Customer Evidence
Go-to-Market
Digital & Reputation
Compliance & Trust
KPIs & Gaps
Outputs
Full Research Suite comprises of:
Market outlook & trends analysis
Interviews & case studies
Strategic recommendations
Vendor profiles & capabilities analysis
5-year forecasts
8 regions and 60+ country-level data splits
Market segment data splits
12 months of continuous data updates
DELIVERED AS:
PDF EXCEL ONLINE
Wooden Pallet Rental Service Market Size and Share Forecast Outlook 2025 to 2035
Wooden Crate Market Forecast and Outlook 2025 to 2035
Wooden Cutlery Market Size and Share Forecast Outlook 2025 to 2035
Wooden & Plywood Packaging Market Size and Share Forecast Outlook 2025 to 2035
Wooden Furniture Market Size and Share Forecast Outlook 2025 to 2035
Wooden Interior Door Market Size and Share Forecast Outlook 2025 to 2035
Wooden Barrels Market Growth - Demand & Forecast 2025 to 2035
Market Share Insights of Wooden Crate Providers
Wooden Box Market Demand & Premium Packaging Trends 2024-2034
Wooden Pallets Market
Wooden Pallet Collars Market
Teak Decking Market Growth Analysis by Grade, Application and Region: Forecast for 2025 and 2035
Nonwoven Decking Market Size and Share Forecast Outlook 2025 to 2035
Profiled Steel Sheet Decking Market Size and Share Forecast Outlook 2025 to 2035

Thank you!
You will receive an email from our Business Development Manager. Please be sure to check your SPAM/JUNK folder too.
Chat With
MaRIA