Nanotechnology Packaging Market Outlook

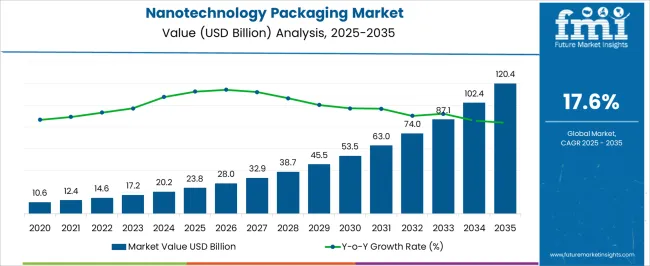
The nanotechnology packaging market size is projected to be valued at US$ 17,210.0 million in 2023 and is expected to rise to US$ 87,412.0 million by 2033. The sales of nanotechnology packaging are expected to hold a significant CAGR of 17.6% during the forecast period. Various factors propelling the demand for nanotechnology packaging g are With continual breakthroughs in nanomaterials and packaging technology presenting countless prospects for innovation and expansion, the future of nanotechnology packaging appears promising.

Nanotechnology packaging has the potential to revolutionize industries such as food, pharmaceuticals, and electronics. Using nanotechnology packaging has several benefits such as

  • It can increase the shelf life of food by developing packaging materials that are impermeable to gases and moisture.
  • Nanoparticles and other nanomaterials can be utilized to increase the efficacy and safety of pharmaceuticals in drug delivery systems such as nanocapsules.
  • Nanotechnology packaging has the potential to enable the development of implanted medical devices and diagnostic instruments for early illness diagnosis and treatment.

The development of sustainable and eco-friendly packaging solutions is one of the important trends in the future of nanotechnology packaging. Nanotechnology has the potential to play a key role in the development of biodegradable, recyclable, and renewable packaging materials. For example,

  • Scientists are investigating the use of nanocellulose as a sustainable packaging material capable of replacing plastic and reducing waste.

The use of smart packaging is another development in the future of nanotechnology packaging.

  • Sensors, indicators, and other technologies are used in smart packaging to monitor and communicate information about the contents of the container, such as freshness, temperature, and safety.

Nanotechnology can enable the development of nanosensors and nanomaterials for smart packaging that can give real-time monitoring and data analysis. To ensure the safe and appropriate use of nanotechnology in packaging, continual research, and development are required.

Attribute Details
Market Estimated Size (2023) US$ 17,210.0 million
Market CAGR (2023 to 2033) 17.6%
Market Forecasted Size (2033) US$ 87,412.0 million

Don't pay for what you don't need

Customize your report by selecting specific countries or regions and save 30%!

2018 to 2022 Nanotechnology Packaging Market Outlook in Comparison to 2023 to 2033 Growth Forecast

Over the years, the nanotechnology packaging market has grown significantly. It has enabled the development of innovative packaging materials with better features such as barrier protection, mechanical strength, and durability.

The market has expanded as a result of increased demand for nanotechnology-based packaging in industries such as food and beverage, healthcare, and electronics. Nanotechnology packaging in the food and beverage sector has enabled the development of new packaging solutions. These solutions can increase product shelf life, avoid spoiling, and improve food quality and safety.

In the healthcare sector, it has enabled the creation of effective and efficient medication delivery systems, diagnostic gadgets, and implantable medical devices than previous methods. Nanotechnology packaging has enabled the development of small, quick, and efficient electronic devices with increased performance and durability in the electronics sector.

According to FMI, the market is likely to witness a growth rate of 17.6% between 2023 and 2033, in comparison to 16.5% from 2018 to 2022. This expansion can be ascribed to causes such as

  • Rising demand for environment-friendly packaging materials.
  • A growing desire for high-performance packaging solutions.
  • Advances in nanotechnology.

Investing in the nanotechnology packaging industry can help organizations gain a competitive advantage, increase supply chain efficiency, and satisfy sustainability goals.

Manufacturers and Service providers in the Nanotechnology Packaging Market can Scale their Businesses by Adopting the Strategies such as

  • Research and Development: Investing in research and development to innovate new nanotechnology packaging solutions that meet the evolving needs of modern customers.
  • Collaboration and Partnership: Collaborating with industry players, research institutions, and government agencies to share knowledge, resources, and expertise to develop new technologies and solutions.
  • Market Segmentation: Identifying niche markets and developing specialized packaging solutions for those markets. For example, developing packaging solutions for the healthcare industry that cater to specific medical applications.
  • Marketing and Branding: Building a strong brand image and marketing the unique features and benefits of nanotechnology packaging solutions to target customers.
  • International Expansion: Exploring opportunities to expand into new international markets and adapting to local market needs and regulations.
  • Mergers and Acquisitions: Acquiring or merging with other companies in the industry to leverage their capabilities, resources, and expertise to expand business operations.
Ismail Sutaria
Ismail Sutaria

Principal Consultant

Talk to Analyst

Find your sweet spots for generating winning opportunities in this market.

Novel Factors of the Nanotechnology Packaging Market

  • Self-Healing Materials: Researchers are using nanotechnology to develop self-healing materials that can repair cracks and damage in packaging materials.
  • Antimicrobial Nanocoating: Antimicrobial nanocoating can be used in packaging to prevent bacteria and other illnesses from growing.
  • Researchers are developing nanoporous films that may filter out contaminants and impurities in food and other things using nanotechnology.
  • Nanosensors can be used in packaging to detect and monitor changes in food quality, such as color, texture, and taste.
  • Edible Nanoparticles: Researchers are using nanotechnology to create edible nanoparticles that may be added to food to improve nutrition, flavor, and other features.

Category-wise Insights of Nanotechnology Packaging

Packaging Type Insights

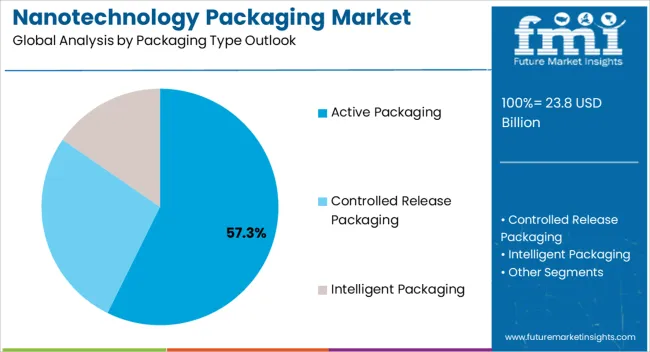
In the nanotechnology packaging market, active packaging is a significant segment. It refers to packaging solutions that include active agents or technology, such as antibacterial agents, oxygen scavengers, or moisture absorbers. All these increase shelf life and improve product safety and quality.

By 2025, the active packaging industry is anticipated to be worth US$ 22.8 billion. This expansion is driven by the factors such as

  • Increasing demand for convenience foods and ready-to-eat meals.
  • Growing awareness about food safety and quality.
  • Technological breakthroughs in packaging materials and technologies.

Controlled release packaging is another important segment in the nanotechnology packaging market. It refers to packaging solutions that release active agents or substances at a controlled rate, in response to changes in the environment or other external stimuli.

Controlled release packaging is expected to record a CAGR of 6.6% during the analysis period. The growth in this sector is driven by factors such as

  • Increasing demand for functional and innovative packaging solutions.
  • Rising awareness about food safety and quality.
  • Advancements in nanotechnology and materials science.

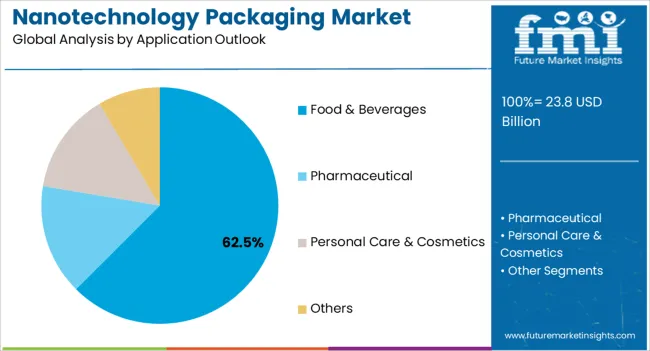
Nanotechnology Packaging Solutions are Widely Used in the Food and Beverage Industries.

The use of nanotechnology in food and beverage packaging has various advantages, including better product safety, shelf-life extension, and sensory qualities. From 2020 to 2026, the food and beverage segment is predicted to increase at a 14.1% CAGR.

Factors such as increased packaged and processed food demand, rising consumer awareness about food safety and quality, and technological breakthroughs in packaging materials and technologies are driving growth in this market.

The pharmaceutical sector is another significant customer of the nanotechnology packaging market. The use of nanotechnology in pharmaceutical packaging has several advantages, including improved medication stability, increased bioavailability, and controlled drug release.

The pharmaceutical segment is anticipated to be worth US$ 10.9 billion by 2025. Factors such as the rising need for new drug delivery systems increased knowledge about drug safety and quality, and breakthroughs in nanotechnology and materials science are driving growth in this market.
Get the data you need at a Fraction of the cost

Personalize your report by choosing insights you need
and save 40%!

Regional Analysis of the Nanotechnology Packaging Market

North America is a Prominent Region in the Nanotechnology Packaging Industry, Accounting for a Sizable Portion of the Global Industry.

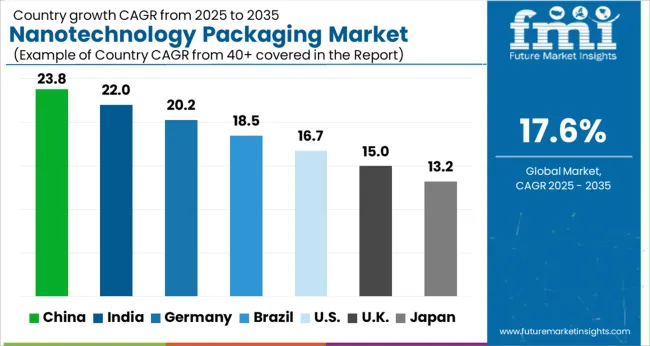
The region is seeing an increase in demand for creative and advanced packaging solutions in a variety of end-use industries, including food & beverage, medicines, and electronics. North America nanotechnology packaging market was assessed at US$ 5.96 billion in 2020, with a CAGR of 12.3% predicted from 2021 to 2026. Regional growth is driven by the factors such as
  • The increasing need for sustainable and eco-friendly packaging solutions.
  • Increased research and development investments.
  • The presence of a large number of package manufacturers in the region.

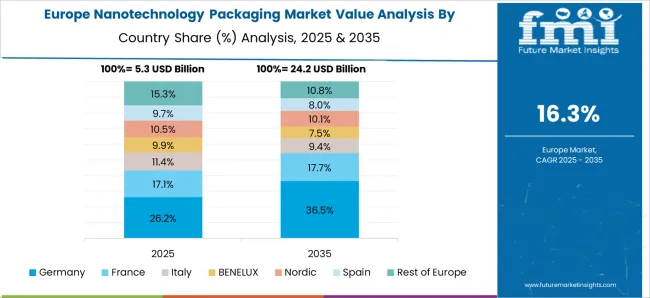
From 2021 to 2026, Europe market for Nanotechnology Packaging is Estimated to Develop at an 11.6% CAGR.

The increasing need for sustainable and eco-friendly packaging solutions and the presence of a large number of package manufacturers in the region are driving growth in this market.

Given the increasing demand for advanced packaging solutions from diverse end-use industries such as food and beverage, pharmaceuticals, and personal care, Germany is Europe's significant customer base for Nanotechnology Packaging. The country is experiencing a huge transition toward sustainable and environment-friendly packaging solutions, which is increasing demand for nanotechnology-based materials.

India is Gaining Traction as a Prospective Market for Nanotechnology Packaging.

The country's market is primarily driven by rising consumer electronics demand and a great emphasis on environment-friendly packaging. Nanotechnology packaging protects items better, has a low environmental effect, and improves product performance, which is pushing its acceptance in India market.

Indian government's attempts to support nanotechnology research & development and encourage international investment in this field are projected to drive market growth even further.

The country has a large presence of nanotechnology research institutes and universities, which is also helping to create India's nanotechnology packaging sector. Overall, India market for nanotechnology packaging is likely to expand dramatically in the future years.
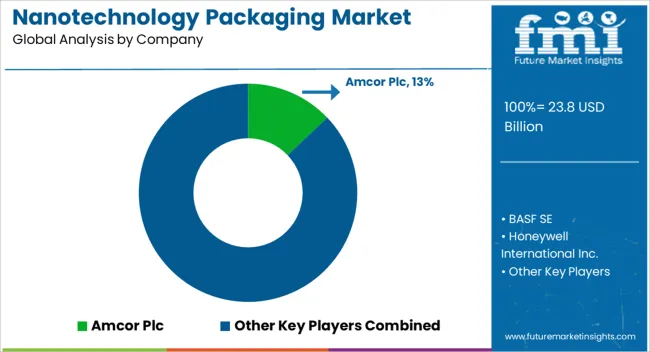
The Competitive Landscape in the Nanotechnology Packaging Market is Characterized by the Presence of Several Key Players

Some of the leading companies in the market include Amcor Limited, 3M Company, Bemis Company, Inc., Chevron Phillips Chemical Company LLC, and Honeywell International Inc. These companies are actively investing in research and development to innovate new products and expand their product portfolios to gain a competitive edge in the market.

The market is also witnessing the emergence of several startups and small and medium-sized enterprises (SMEs) that are leveraging nanotechnology to develop new and innovative packaging solutions. These players are focusing on niche applications and developing cost-effective solutions to gain a foothold in the market.

Companies are also focusing on expanding their presence in emerging markets such as Asia Pacific and Latin America, which offer significant growth opportunities for the nanotechnology packaging market.

Latest Developments

  • PPG announced the official opening of its Packaging Coatings Innovation Centre, Europe in Bodelshausen, Germany, in November 2021. The greatly increased analytical and research and development capabilities of the plant to improve and speed up the development of packaging coatings solutions across a wide variety of end markets.
  • Sealed Air Singapore offered creative and environmentally responsible packaging solutions in December 2021. Its TemPreserveTM Insulative Foam and QuikwrapTM Nano paper solutions were both honored at the 'Made in Singapore Awards' and the 'Designed in Singapore Awards,' respectively.

Scope of the Report

Attribute Details
Growth Rate CAGR of 17.6% from 2023 to 2033
Base Year of Estimation 2023
Historical Data 2018 to 2022
Forecast Period 2023 to 2033
Quantitative Units Revenue in US$ million and Volume in Units and F-CAGR from 2022 to 2032
Report Coverage Revenue Forecast, Volume Forecast, Company Ranking, Competitive Landscape, growth factors, Trends, and Pricing Analysis
Key Segments Covered By Packaging Type, By End User Industry, By Region
Regions Covered North America; Latin America; Europe; East Asia; South Asia; The Middle East & Africa; Oceania
Key Countries Profiled The United States, Canada, Brazil, Mexico, Germany, Italy, France, The United Kingdom, Spain, Russia, China, Japan, India, GCC Countries, Australia
Key Companies Profiled Amcor Limited; 3M Company; Bemis Company, Inc.; Chevron Phillips Chemical Company LLC; and Honeywell International Inc.

Key Segments Covered in the Nanotechnology Packaging Market Report

Packaging Type Outlook:

  • Active Packaging
  • Controlled Release Packaging
  • Intelligent Packaging

Application Outlook:

  • Food & Beverages
  • Pharmaceutical
  • Personal Care & Cosmetics
  • Others

By Region:

  • North America
  • Latin America
  • Western Europe
  • Eastern Europe
  • Asia Pacific Excluding Japan (APEJ)
  • Japan
  • The Middle East & Africa (MEA)

Frequently Asked Questions

Who are the Key Consumer of Nanotechnology Packaging?

Food & beverage companies are the key consumer.

How Much can Nanotechnology Packaging Market Grow by 2033?

The global market is projecting a significant CAGR of 17.6% by 2033.

What is Current Market Valuation?

The market is estimated to secure a valuation of US$ 17,210 million in 2023.

How Big will the Nanotechnology Packaging Market by 2033?

The market is estimated to reach US$ 87,412 million by 2033.

Which Packaging Type Holds Lucrative Opportunities?

Active packaging segment holds high revenue potential.

Table of Content
1. Executive Summary | Nanotechnology Packaging Market
    1.1. Global Market Outlook
    1.2. Demand-side Trends
    1.3. Supply-side Trends
    1.4. Technology Roadmap Analysis
    1.5. Analysis and Recommendations
2. Market Overview
    2.1. Market Coverage / Taxonomy
    2.2. Market Definition / Scope / Limitations
3. Market Background
    3.1. Market Dynamics
        3.1.1. Drivers
        3.1.2. Restraints
        3.1.3. Opportunity
        3.1.4. Trends
    3.2. Scenario Forecast
        3.2.1. Demand in Optimistic Scenario
        3.2.2. Demand in Likely Scenario
        3.2.3. Demand in Conservative Scenario
    3.3. Product launches & Recent Developments
    3.4. Product Life Cycle Analysis
    3.5. Value Chain Analysis
        3.5.1. Supply Side Participants and their Roles
            3.5.1.1. Producers
            3.5.1.2. Mid-Level Participants (Traders/ Agents/ Brokers)
            3.5.1.3. Wholesalers and Distributors
        3.5.2. % of Operating Margin Analysis
        3.5.3. List of Existing and Potential Buyer’s
    3.6. Pricing Analysis
        3.6.1. Price Point Assessment by Region
        3.6.2. Price Point Assessment by production
        3.6.3. Price Forecast till 2032
        3.6.4. Factors affecting pricing
    3.7. Forecast Factors - Relevance & Impact
    3.8. Regulatory Landscape
    3.9. Regional Parent Market Outlook
    3.10. Production and Consumption Statistics
    3.11. Consumers Survey Analysis
    3.12. Macro-Economic Factors
4. Global Analysis 2018 to 2022 and Forecast, 2023 to 2033
    4.1. Historical Market Size Value (US$ Million) & Volume (Tonnes) Analysis, 2018 to 2022
    4.2. Current and Future Market Size Value (US$ Million) & Volume (Tonnes) Projections, 2023 to 2033
        4.2.1. Y-o-Y Growth Trend Analysis
        4.2.2. Absolute $ Opportunity Analysis
5. Global Analysis 2018 to 2022 and Forecast 2023 to 2033, By Technology
    5.1. Introduction / Key Findings
    5.2. Historical Market Size Value (US$ Million) & Volume (Tonnes) Analysis By Technology, 2018 to 2022
    5.3. Current and Future Market Size Value (US$ Million) & Volume (Tonnes) Analysis and Forecast ByTechnology, 2023 to 2033
        5.3.1. Active Packaging
        5.3.2. Intelligent Packaging
        5.3.3. Nanocomposite Packaging
        5.3.4. Antimicrobial Packaging
        5.3.5. Others (Barrier Coatings, etc.)
    5.4. Y-o-Y Growth Trend Analysis By Technology, 2018 to 2022
    5.5. Absolute $ Opportunity Analysis By Technology, 2023 to 2033
6. Global Analysis 2018 to 2022 and Forecast 2023 to 2033, By Application
    6.1. Introduction / Key Findings
    6.2. Historical Market Size Value (US$ Million) & Volume (Tonnes) Analysis By Application, 2018 to 2022
    6.3. Current and Future Market Size Value (US$ Million) & Volume (Tonnes) Analysis and Forecast ByApplication, 2023 to 2033
        6.3.1. Films
        6.3.2. Pouches
        6.3.3. Bottles and jars
        6.3.4. Caps and closures
        6.3.5. Others (Trays, Boxes, Cartons, etc.)
    6.4. Y-o-Y Growth Trend Analysis By Application, 2018 to 2022
    6.5. Absolute $ Opportunity Analysis By Application, 2023 to 2033
7. Global Analysis 2018 to 2022 and Forecast 2023 to 2033, By End Use
    7.1. Introduction / Key Findings
    7.2. Historical Market Size Value (US$ Million) & Volume (Tonnes) Analysis By End Use, 2018 to 2022
    7.3. Current and Future Market Size Value (US$ Million) & Volume (Tonnes) Analysis and Forecast By End Use,2023 to 2033
        7.3.1. Food and Beverage
        7.3.2. Healthcare
        7.3.3. Personal care and Cosmetics
        7.3.4. Electrical and Electronics
        7.3.5. Shipping and Logistics
        7.3.6. Other Cosnumer Goods
    7.4. Y-o-Y Growth Trend Analysis By End Use, 2018 to 2022
    7.5. Absolute $ Opportunity Analysis By End Use, 2023 to 2033
8. Global Analysis 2018 to 2022 and Forecast 2023 to 2033, By Region
    8.1. Introduction
    8.2. Historical Market Size Value (US$ Million) & Volume (Tonnes) Analysis By Region, 2018 to 2022
    8.3. Current Market Size Value (US$ Million) & Volume (Tonnes) Analysis and Forecast By Region, 2023 to 2033
        8.3.1. North America
        8.3.2. Latin America
        8.3.3. Europe
        8.3.4. East Asia
        8.3.5. South Asia
        8.3.6. Oceania
        8.3.7. MEA
    8.4. Market Attractiveness Analysis By Region
9. North America Analysis 2018 to 2022 and Forecast 2023 to 2033, By Country
    9.1. Historical Market Size Value (US$ Million) & Volume (Tonnes) Trend Analysis By Market Taxonomy,2018 to 2022
    9.2. Market Size Value (US$ Million) & Volume (Tonnes) Forecast By Market Taxonomy, 2023 to 2033
        9.2.1. By Country
            9.2.1.1. USA
            9.2.1.2. Canada
        9.2.2. By Technology
        9.2.3. By Application
        9.2.4. By End Use
    9.3. Market Attractiveness Analysis
        9.3.1. By Country
        9.3.2. By Technology
        9.3.3. By Application
        9.3.4. By End Use
    9.4. Key Takeaways
10. Latin America Analysis 2018 to 2022 and Forecast 2023 to 2033, By Country
    10.1. Historical Market Size Value (US$ Million) & Volume (Tonnes) Trend Analysis By Market Taxonomy,2018 to 2022
    10.2. Market Size Value (US$ Million) & Volume (Tonnes) Forecast By Market Taxonomy, 2023 to 2033
        10.2.1. By Country
            10.2.1.1. Brazil
            10.2.1.2. Mexico
            10.2.1.3. Argentina
            10.2.1.4. Chile
            10.2.1.5. Peru
            10.2.1.6. Rest of Latin America
        10.2.2. By Technology
        10.2.3. By Application
        10.2.4. By End Use
    10.3. Market Attractiveness Analysis
        10.3.1. By Country
        10.3.2. By Technology
        10.3.3. By Application
        10.3.4. By End Use
    10.4. Key Takeaways
11. Europe Analysis 2018 to 2022 and Forecast 2023 to 2033, By Country
    11.1. Historical Market Size Value (US$ Million) & Volume (Tonnes) Trend Analysis By Market Taxonomy,2018 to 2022
    11.2. Market Size Value (US$ Million) & Volume (Tonnes) Forecast By Market Taxonomy, 2023 to 2033
        11.2.1. By Country
            11.2.1.1. Germany
            11.2.1.2. Italy
            11.2.1.3. France
            11.2.1.4. United kingdom
            11.2.1.5. Spain
            11.2.1.6. Russia
            11.2.1.7. BENELUX
            11.2.1.8. Poland
            11.2.1.9. Nordic Countries
            11.2.1.10. Rest of Europe
        11.2.2. By Technology
        11.2.3. By Application
        11.2.4. By End Use
    11.3. Market Attractiveness Analysis
        11.3.1. By Country
        11.3.2. By Technology
        11.3.3. By Application
        11.3.4. By End Use
    11.4. Key Takeaways
12. East Asia Analysis 2018 to 2022 and Forecast 2023 to 2033, By Country
    12.1. Historical Market Size Value (US$ Million) & Volume (Tonnes) Trend Analysis By Market Taxonomy,2018 to 2022
    12.2. Market Size Value (US$ Million) & Volume (Tonnes) Forecast By Market Taxonomy, 2023 to 2033
        12.2.1. By Country
            12.2.1.1. China
            12.2.1.2. Japan
            12.2.1.3. South Korea
        12.2.2. By Technology
        12.2.3. By Application
        12.2.4. By End Use
    12.3. Market Attractiveness Analysis
        12.3.1. By Country
        12.3.2. By Technology
        12.3.3. By Application
        12.3.4. By End Use
    12.4. Key Takeaways
13. South Asia Analysis 2018 to 2022 and Forecast 2023 to 2033, By Country
    13.1. Historical Market Size Value (US$ Million) & Volume (Tonnes) Trend Analysis By Market Taxonomy, 2018 to 2022
    13.2. Market Size Value (US$ Million) & Volume (Tonnes) Forecast By Market Taxonomy, 2023 to 2033
        13.2.1. By Country
            13.2.1.1. India
            13.2.1.2. Thailand
            13.2.1.3. Malaysia
            13.2.1.4. Indonesia
            13.2.1.5. Singapore
            13.2.1.6. Rest of South Asia
        13.2.2. By Technology
        13.2.3. By Application
        13.2.4. By End Use
    13.3. Market Attractiveness Analysis
        13.3.1. By Country
        13.3.2. By Technology
        13.3.3. By Application
        13.3.4. By End Use
    13.4. Key Takeaways
14. Oceania Analysis 2018 to 2022 and Forecast 2023 to 2033, By Country
    14.1. Historical Market Size Value (US$ Million) & Volume (Tonnes) Trend Analysis By Market Taxonomy,2018 to 2022
    14.2. Market Size Value (US$ Million) & Volume (Tonnes) Forecast By Market Taxonomy, 2023 to 2033
        14.2.1. By Country
            14.2.1.1. Australia
            14.2.1.2. New Zealand
        14.2.2. By Technology
        14.2.3. By Application
        14.2.4. By End Use
    14.3. Market Attractiveness Analysis
        14.3.1. By Country
        14.3.2. By Technology
        14.3.3. By Application
        14.3.4. By End Use
    14.4. Key Takeaways
15. MEA Analysis 2018 to 2022 and Forecast 2023 to 2033, By Country
    15.1. Historical Market Size Value (US$ Million) & Volume (Tonnes) Trend Analysis By Market Taxonomy,2018 to 2022
    15.2. Market Size Value (US$ Million) & Volume (Tonnes) Forecast By Market Taxonomy, 2023 to 2033
        15.2.1. By Country
            15.2.1.1. GCC Countries
            15.2.1.2. South Africa
            15.2.1.3. Central Africa
            15.2.1.4. North Africa
        15.2.2. By Technology
        15.2.3. By Application
        15.2.4. By End Use
    15.3. Market Attractiveness Analysis
        15.3.1. By Country
        15.3.2. By Technology
        15.3.3. By Application
        15.3.4. By End Use
    15.4. Key Takeaways
16. Key Countries Analysis
    16.1. USA
        16.1.1. Pricing Analysis
        16.1.2. Market Share Analysis, 2022
            16.1.2.1. By Technology
            16.1.2.2. By Application
            16.1.2.3. By End Use
    16.2. Canada
        16.2.1. Pricing Analysis
        16.2.2. Market Share Analysis, 2022
            16.2.2.1. By Technology
            16.2.2.2. By Application
            16.2.2.3. By End Use
    16.3. Brazil
        16.3.1. Pricing Analysis
        16.3.2. Market Share Analysis, 2022
            16.3.2.1. By Technology
            16.3.2.2. By Application
            16.3.2.3. By End Use
    16.4. Mexico
        16.4.1. Pricing Analysis
        16.4.2. Market Share Analysis, 2022
            16.4.2.1. By Technology
            16.4.2.2. By Application
            16.4.2.3. By End Use
    16.5. Argentina
        16.5.1. Pricing Analysis
        16.5.2. Market Share Analysis, 2022
            16.5.2.1. By Technology
            16.5.2.2. By Application
            16.5.2.3. By End Use
    16.6. Chile
        16.6.1. Pricing Analysis
        16.6.2. Market Share Analysis, 2022
            16.6.2.1. By Technology
            16.6.2.2. By Application
            16.6.2.3. By End Use
    16.7. Peru
        16.7.1. Pricing Analysis
        16.7.2. Market Share Analysis, 2022
            16.7.2.1. By Technology
            16.7.2.2. By Application
            16.7.2.3. By End Use
    16.8. Germany
        16.8.1. Pricing Analysis
        16.8.2. Market Share Analysis, 2022
            16.8.2.1. By Technology
            16.8.2.2. By Application
            16.8.2.3. By End Use
    16.9. Italy
        16.9.1. Pricing Analysis
        16.9.2. Market Share Analysis, 2022
            16.9.2.1. By Technology
            16.9.2.2. By Application
            16.9.2.3. By End Use
    16.10. France
        16.10.1. Pricing Analysis
        16.10.2. Market Share Analysis, 2022
            16.10.2.1. By Technology
            16.10.2.2. By Application
            16.10.2.3. By End Use
    16.11. Spain
        16.11.1. Pricing Analysis
        16.11.2. Market Share Analysis, 2022
            16.11.2.1. By Technology
            16.11.2.2. By Application
            16.11.2.3. By End Use
    16.12. United kingdom
        16.12.1. Pricing Analysis
        16.12.2. Market Share Analysis, 2022
            16.12.2.1. By Technology
            16.12.2.2. By Application
            16.12.2.3. By End Use
    16.13. Russia
        16.13.1. Pricing Analysis
        16.13.2. Market Share Analysis, 2022
            16.13.2.1. By Technology
            16.13.2.2. By Application
            16.13.2.3. By End Use
    16.14. Poland
        16.14.1. Pricing Analysis
        16.14.2. Market Share Analysis, 2022
            16.14.2.1. By Technology
            16.14.2.2. By Application
            16.14.2.3. By End Use
    16.15. BENELUX
        16.15.1. Pricing Analysis
        16.15.2. Market Share Analysis, 2022
            16.15.2.1. By Technology
            16.15.2.2. By Application
            16.15.2.3. By End Use
    16.16. Nordic Countries
        16.16.1. Pricing Analysis
        16.16.2. Market Share Analysis, 2022
            16.16.2.1. By Technology
            16.16.2.2. By Application
            16.16.2.3. By End Use
    16.17. China
        16.17.1. Pricing Analysis
        16.17.2. Market Share Analysis, 2022
            16.17.2.1. By Technology
            16.17.2.2. By Application
            16.17.2.3. By End Use
    16.18. Japan
        16.18.1. Pricing Analysis
        16.18.2. Market Share Analysis, 2022
            16.18.2.1. By Technology
            16.18.2.2. By Application
            16.18.2.3. By End Use
    16.19. South Korea
        16.19.1. Pricing Analysis
        16.19.2. Market Share Analysis, 2022
            16.19.2.1. By Technology
            16.19.2.2. By Application
            16.19.2.3. By End Use
    16.20. India
        16.20.1. Pricing Analysis
        16.20.2. Market Share Analysis, 2022
            16.20.2.1. By Technology
            16.20.2.2. By Application
            16.20.2.3. By End Use
    16.21. Thailand
        16.21.1. Pricing Analysis
        16.21.2. Market Share Analysis, 2022
            16.21.2.1. By Technology
            16.21.2.2. By Application
            16.21.2.3. By End Use
    16.22. Indonesia
        16.22.1. Pricing Analysis
        16.22.2. Market Share Analysis, 2022
            16.22.2.1. By Technology
            16.22.2.2. By Application
            16.22.2.3. By End Use
    16.23. Malaysia
        16.23.1. Pricing Analysis
        16.23.2. Market Share Analysis, 2022
            16.23.2.1. By Technology
            16.23.2.2. By Application
            16.23.2.3. By End Use
    16.24. Singapore
        16.24.1. Pricing Analysis
        16.24.2. Market Share Analysis, 2022
            16.24.2.1. By Technology
            16.24.2.2. By Application
            16.24.2.3. By End Use
    16.25. Australia
        16.25.1. Pricing Analysis
        16.25.2. Market Share Analysis, 2022
            16.25.2.1. By Technology
            16.25.2.2. By Application
            16.25.2.3. By End Use
    16.26. New Zealand
        16.26.1. Pricing Analysis
        16.26.2. Market Share Analysis, 2022
            16.26.2.1. By Technology
            16.26.2.2. By Application
            16.26.2.3. By End Use
    16.27. GCC Countries
        16.27.1. Pricing Analysis
        16.27.2. Market Share Analysis, 2022
            16.27.2.1. By Technology
            16.27.2.2. By Application
            16.27.2.3. By End Use
    16.28. South Africa
        16.28.1. Pricing Analysis
        16.28.2. Market Share Analysis, 2022
            16.28.2.1. By Technology
            16.28.2.2. By Application
            16.28.2.3. By End Use
    16.29. North Africa
        16.29.1. Pricing Analysis
        16.29.2. Market Share Analysis, 2022
            16.29.2.1. By Technology
            16.29.2.2. By Application
            16.29.2.3. By End Use
    16.30. Central Africa
        16.30.1. Pricing Analysis
        16.30.2. Market Share Analysis, 2022
            16.30.2.1. By Technology
            16.30.2.2. By Application
            16.30.2.3. By End Use
17. Market Structure Analysis
    17.1. Competition Dashboard
    17.2. Competition Benchmarking
    17.3. Market Share Analysis of Top Players
        17.3.1. By Regional
        17.3.2. By Technology
        17.3.3. By Application
        17.3.4. By End Use
18. Competition Analysis
    18.1. Competition Deep Dive
        18.1.1. Amcor Plc
            18.1.1.1. Overview
            18.1.1.2. Product Portfolio
            18.1.1.3. Profitability by Market Segments (Product/Age /Sales Channel/Region)
            18.1.1.4. Sales Footprint
            18.1.1.5. Strategy Overview
                18.1.1.5.1. Marketing Strategy
                18.1.1.5.2. Product Strategy
                18.1.1.5.3. Channel Strategy
        18.1.2. BASF SE
            18.1.2.1. Overview
            18.1.2.2. Product Portfolio
            18.1.2.3. Profitability by Market Segments (Product/Age /Sales Channel/Region)
            18.1.2.4. Sales Footprint
            18.1.2.5. Strategy Overview
                18.1.2.5.1. Marketing Strategy
                18.1.2.5.2. Product Strategy
                18.1.2.5.3. Channel Strategy
        18.1.3. Honeywell International Inc.
            18.1.3.1. Overview
            18.1.3.2. Product Portfolio
            18.1.3.3. Profitability by Market Segments (Product/Age /Sales Channel/Region)
            18.1.3.4. Sales Footprint
            18.1.3.5. Strategy Overview
                18.1.3.5.1. Marketing Strategy
                18.1.3.5.2. Product Strategy
                18.1.3.5.3. Channel Strategy
        18.1.4. Sealed Air Corporation
            18.1.4.1. Overview
            18.1.4.2. Product Portfolio
            18.1.4.3. Profitability by Market Segments (Product/Age /Sales Channel/Region)
            18.1.4.4. Sales Footprint
            18.1.4.5. Strategy Overview
                18.1.4.5.1. Marketing Strategy
                18.1.4.5.2. Product Strategy
                18.1.4.5.3. Channel Strategy
        18.1.5. 3M Company
            18.1.5.1. Overview
            18.1.5.2. Product Portfolio
            18.1.5.3. Profitability by Market Segments (Product/Age /Sales Channel/Region)
            18.1.5.4. Sales Footprint
            18.1.5.5. Strategy Overview
                18.1.5.5.1. Marketing Strategy
                18.1.5.5.2. Product Strategy
                18.1.5.5.3. Channel Strategy
        18.1.6. Avery Dennison Corporation
            18.1.6.1. Overview
            18.1.6.2. Product Portfolio
            18.1.6.3. Profitability by Market Segments (Product/Age /Sales Channel/Region)
            18.1.6.4. Sales Footprint
            18.1.6.5. Strategy Overview
                18.1.6.5.1. Marketing Strategy
                18.1.6.5.2. Product Strategy
                18.1.6.5.3. Channel Strategy
        18.1.7. Crown Holdings Inc.
            18.1.7.1. Overview
            18.1.7.2. Product Portfolio
            18.1.7.3. Profitability by Market Segments (Product/Age /Sales Channel/Region)
            18.1.7.4. Sales Footprint
            18.1.7.5. Strategy Overview
                18.1.7.5.1. Marketing Strategy
                18.1.7.5.2. Product Strategy
                18.1.7.5.3. Channel Strategy
        18.1.8. Evonik Industries AG
            18.1.8.1. Overview
            18.1.8.2. Product Portfolio
            18.1.8.3. Profitability by Market Segments (Product/Age /Sales Channel/Region)
            18.1.8.4. Sales Footprint
            18.1.8.5. Strategy Overview
                18.1.8.5.1. Marketing Strategy
                18.1.8.5.2. Product Strategy
                18.1.8.5.3. Channel Strategy
        18.1.9. Ball Corporation
            18.1.9.1. Overview
            18.1.9.2. Product Portfolio
            18.1.9.3. Profitability by Market Segments (Product/Age /Sales Channel/Region)
            18.1.9.4. Sales Footprint
            18.1.9.5. Strategy Overview
                18.1.9.5.1. Marketing Strategy
                18.1.9.5.2. Product Strategy
                18.1.9.5.3. Channel Strategy
        18.1.10. Klöckner Pentaplast
            18.1.10.1. Overview
            18.1.10.2. Product Portfolio
            18.1.10.3. Profitability by Market Segments (Product/Age /Sales Channel/Region)
            18.1.10.4. Sales Footprint
            18.1.10.5. Strategy Overview
                18.1.10.5.1. Marketing Strategy
                18.1.10.5.2. Product Strategy
                18.1.10.5.3. Channel Strategy
        18.1.11. DuPont Teijin Film
            18.1.11.1. Overview
            18.1.11.2. Product Portfolio
            18.1.11.3. Profitability by Market Segments (Product/Age /Sales Channel/Region)
            18.1.11.4. Sales Footprint
            18.1.11.5. Strategy Overview
                18.1.11.5.1. Marketing Strategy
                18.1.11.5.2. Product Strategy
                18.1.11.5.3. Channel Strategy
        18.1.12. PPG Industries, Inc
            18.1.12.1. Overview
            18.1.12.2. Product Portfolio
            18.1.12.3. Profitability by Market Segments (Product/Age /Sales Channel/Region)
            18.1.12.4. Sales Footprint
            18.1.12.5. Strategy Overview
                18.1.12.5.1. Marketing Strategy
                18.1.12.5.2. Product Strategy
                18.1.12.5.3. Channel Strategy
        18.1.13. Chevron Phillips Chemical Co. LLC
            18.1.13.1. Overview
            18.1.13.2. Product Portfolio
            18.1.13.3. Profitability by Market Segments (Product/Age /Sales Channel/Region)
            18.1.13.4. Sales Footprint
            18.1.13.5. Strategy Overview
                18.1.13.5.1. Marketing Strategy
                18.1.13.5.2. Product Strategy
                18.1.13.5.3. Channel Strategy
        18.1.14. Graham Packaging Company
            18.1.14.1. Overview
            18.1.14.2. Product Portfolio
            18.1.14.3. Profitability by Market Segments (Product/Age /Sales Channel/Region)
            18.1.14.4. Sales Footprint
            18.1.14.5. Strategy Overview
                18.1.14.5.1. Marketing Strategy
                18.1.14.5.2. Product Strategy
                18.1.14.5.3. Channel Strategy
        18.1.15. Amelco Desiccants Inc
            18.1.15.1. Overview
            18.1.15.2. Product Portfolio
            18.1.15.3. Profitability by Market Segments (Product/Age /Sales Channel/Region)
            18.1.15.4. Sales Footprint
            18.1.15.5. Strategy Overview
                18.1.15.5.1. Marketing Strategy
                18.1.15.5.2. Product Strategy
                18.1.15.5.3. Channel Strategy
        18.1.16. Sonoco Products Company
            18.1.16.1. Overview
            18.1.16.2. Product Portfolio
            18.1.16.3. Profitability by Market Segments (Product/Age /Sales Channel/Region)
            18.1.16.4. Sales Footprint
            18.1.16.5. Strategy Overview
                18.1.16.5.1. Marketing Strategy
                18.1.16.5.2. Product Strategy
                18.1.16.5.3. Channel Strategy
        18.1.17. WestRock Company
            18.1.17.1. Overview
            18.1.17.2. Product Portfolio
            18.1.17.3. Profitability by Market Segments (Product/Age /Sales Channel/Region)
            18.1.17.4. Sales Footprint
            18.1.17.5. Strategy Overview
                18.1.17.5.1. Marketing Strategy
                18.1.17.5.2. Product Strategy
                18.1.17.5.3. Channel Strategy
        18.1.18. Graphic Packaging International LLC
            18.1.18.1. Overview
            18.1.18.2. Product Portfolio
            18.1.18.3. Profitability by Market Segments (Product/Age /Sales Channel/Region)
            18.1.18.4. Sales Footprint
            18.1.18.5. Strategy Overview
                18.1.18.5.1. Marketing Strategy
                18.1.18.5.2. Product Strategy
                18.1.18.5.3. Channel Strategy
        18.1.19. Timestrip UK Ltd
            18.1.19.1. Overview
            18.1.19.2. Product Portfolio
            18.1.19.3. Profitability by Market Segments (Product/Age /Sales Channel/Region)
            18.1.19.4. Sales Footprint
            18.1.19.5. Strategy Overview
                18.1.19.5.1. Marketing Strategy
                18.1.19.5.2. Product Strategy
                18.1.19.5.3. Channel Strategy
        18.1.20. Desiccare Inc
            18.1.20.1. Overview
            18.1.20.2. Product Portfolio
            18.1.20.3. Profitability by Market Segments (Product/Age /Sales Channel/Region)
            18.1.20.4. Sales Footprint
            18.1.20.5. Strategy Overview
                18.1.20.5.1. Marketing Strategy
                18.1.20.5.2. Product Strategy
                18.1.20.5.3. Channel Strategy
19. Assumptions & Acronyms Used
20. Research Methodology
Recommendations

Packaging

Beverage Packaging Market

June 2024

REP-GB-196

506 pages

Explore Packaging Insights

View Reports
Future Market Insights

Nanotechnology Packaging Market

Schedule a Call