Reports

- Global Locations -

Headquarters

Future Market Insights, Inc.

Christiana Corporate, 200
Continental Drive, Suite 401,
Newark, Delaware - 19713,
United States

T: +1-845-579-5705

Americas

Future Market Insights, Inc.

616 Corporate Way, Suite 2-9018,
Valley Cottage, NY 10989, United States

T: +1-347-918-3531

MEA

Future Market Insights

1602-6 Jumeirah Bay X2 Tower, Plot No: JLT-PH2-X2A,
Jumeirah Lakes Towers, Dubai,
United Arab Emirates

Europe

Future Market Insights

3rd Floor, 207 Regent Street,
W1B 3HH London
United Kingdom

T: + 44 (0) 20 8123 9659
D: +44 (0) 20 3287 4268

Asia Pacific

Future Market Insights

IndiaLand Global Tech Park, Unit UG-1, Behind Grand HighStreet, Phase 1, Hinjawadi, MH, Pune – 411057, India

Optical Coating Market Outlook (2022 to 2032)

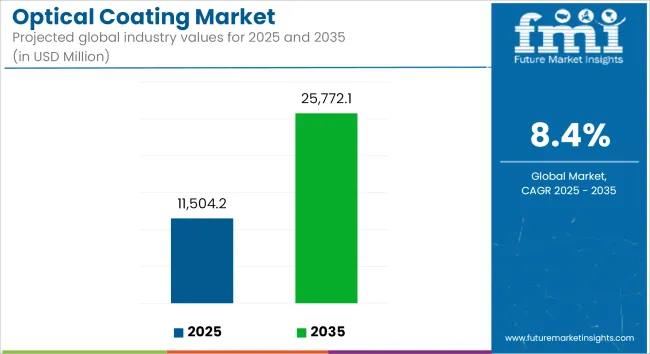
FMI estimates the global Optical Coating market to reach a value of US$ 9,718.5 Million by the year 2022. Sales prospects of Optical Coatings are expected to expand at a CAGR of 8.8% and top a valuation of US$ 22,598.7 Million by 2032. The rapid growth of various end-use industries and the growing trend of fashionable designs for eye-wears and consumer electronics are propelling the optical coatings market.

Attribute Details
Optical Coating Sales (2021A) US$ 8,947.8 Million
Optical Coating Sales (2022E) US$ 9,718.5 Million
Optical Coating Market Projections (2032F) US$ 22,598.7 Million
Value CAGR (2022 to 2032) 8.8%
Collective Value Share: Top 3 Countries (2022E) 41.7%

According to the latest research published by Future Market Insights, Global Optical Coating Market is anticipated to hold 3-7% of the market share in the overall Paints & Coating market.

Don't pay for what you don't need

Customize your report by selecting specific countries or regions and save 30%!

2017 to 2021 Optical Coating market outlook compared to 2022 to 2032 forecast

The demand for the optical coating market grew at a 7.6% CAGR between 2017 and 2021. Considering the several end-use industries served, demand for optical coating is uneven depending on consumer electronics, automotive, and others which have stifled demand. Furthermore, due to the pandemic, the growth of the optical coating market has been negatively impacted in 2020. Based on consumption patterns, the optical coating market has seen a substantial rise in demand over the last few years.

The demand for optical coating is expected to increase during the assessment period and is further expected to witness a significant growth rate of 8.8% in the same period. The market for optical coatings is prospering from rising defense spending as well as increasing demand for optical coatings from the semiconductor and electronics industries. Additionally, it is projected that the market would grow as optical coatings find new applications in the aerospace sector. An increasing population and an increase in optical demand are further factors driving the market for optical coatings.

Optical Coating Market

The flourishing electronics and semiconductor industry to drive optical coating market?

In many electronic applications where light must travel through optical surfaces, optical coatings are used. Optical anti-reflective coatings are used on tablet and cell phone screens for a variety of purposes, including making text easier to read in daylight. These coatings are used on the semiconductor diode lasers' facets. Since IoT is becoming more prevalent across a wide range of industries, the demand for semiconductors has grown at an extremely rapid rate in recent years. This is additionally pushing the market for optical coatings.

Semiconductor components can endure the high temperatures needed for wafer fabrication due to optical coatings. The utilization of the latest wafers in semiconductors has expanded as a result of the industry's rapid expansion, which is anticipated to raise the demand for ultra-pure optical coatings.

Consequently, optical coatings are the preferred substance for enhancing the functionality of these products. This will promote the use of high-purity optical coatings in the semiconductor and electronics industries.

Nikhil Kaitwade
Nikhil Kaitwade

Principal Consultant

Talk to Analyst

Find your sweet spots for generating winning opportunities in this market.

Why is aerospace & defense segment witnessing the expeditious growth rate?

In the aerospace and defense industries, optical coatings are often employed. Photovoltaic energy production for space applications has always benefited greatly from thin film technology. Optically coated devices, in particular anti-reflective ones, are widely used in monitoring and exploration instruments.

The increasing usage of space-based instruments like telescopes, satellites, and probes is expected to increase the need for optical coatings during the course of the projected period. Since nanosatellites have become more prevalent recently, demand for the optical coatings utilized in their solar panels, cameras, and remote sensing equipment has skyrocketed.

Due to their unique qualities, optical coatings like IR, UF, and night vision filters are in demand in the military industry. Numerous nations have boosted their spending on defense research and development because of geopolitical factors, which will result in new applications for optical coatings.

Why is optical coating gaining traction from medical and electronics industry?

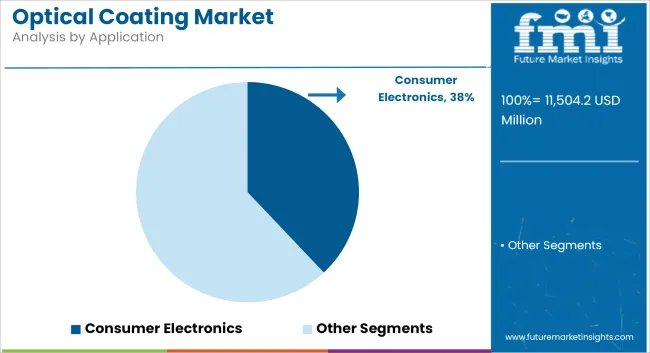
The market is expected to be driven by the rising number of young people as well as a rise in demand for consumer electronics such as smartphones, tablets, cameras, LED displays, video game consoles, and personal computers during the course of the projection period. Nowadays, mainly in the fashion market, optical lenses and filters are growing in popularity among young people as wearable trends.

The market for medical components has also been stimulated by the growing population as well as its concerns about health. Among the many products that use optical coatings are medical devices, sensors, optical communications, lighting, biotechnology, automobiles, lithography, and space and astronomy components. One of the main drivers propelling the optical coatings business is the rising manufacture of complicated, technologically advanced components.

Get the data you need at a Fraction of the cost

Personalize your report by choosing insights you need
and save 40%!

Has optical coating paved its path in Advanced Automotive Electronics?

One of the primary technologies used in fully and partially autonomous cars is optical sensors. Vehicles are fitted with a variety of optical equipment, including radars, lasers, and cameras, which are based on LEDs and infrared lasers. New optical technologies, including LIDAR lasers, infrared (IR)-based supplemental lighting, and camera systems with environmental awareness, will be included in the next generation of cars. The operation of driver assistance systems including collision avoidance, lane departure warning, night vision, and traffic sign recognition also depends on optical sensors.

These new technologies have led to a major rise in the demand for specialized optical films and coatings in recent years. In order to enhance the performance of optical components, optical coatings offer higher spectrum performance and environmental stability.

Do raw material price fluctuation play a vital role to determine the optical coating market growth?

Numerous raw materials, including fluorides (strontium, calcium, and magnesium) and oxides (titanium, selenium, aluminum, and zirconium), and metals (copper, gold, and silver), are used in the production of optical coatings. The price variations of metals and oxides including indium, titanium dioxide, copper, gold, and silver are significantly impacted by the extremely volatile and unpredictability of the raw materials utilized in the optical coatings industry.

The cost of manufacturing optical coatings is negatively impacted by the rising cost of raw materials, particularly metals, and oxides, which are subject to extreme price fluctuations. One of the essential basic elements needed to create transparent optical coatings is indium. Trading Economics estimates that the cost of indium has climbed by 42.86% since the start of 2021 and by 23.64% from 2020. The expansion of the optical coatings market is being severely hampered by the rising cost of raw materials and price volatility.

How is optical coating reinforcing the solar power industry?

The solar power industry is currently gaining a lot of traction worldwide due to the increasing global awareness of renewable energy sources. The growing usage of solar energy across the globe is increasing the demand for optical coatings because solar panels are frequently coated with them to provide refraction and other functions.

The top layers of solar panels, solar cells, and other photovoltaic materials are coated with optical materials to improve the performance of solar panels by extending their lifespan and light-collection yield while lowering maintenance costs. Solar panels typically use anti-reflective optical coatings that are comparable to the coatings used on camera lenses. Optical coatings are used extensively in the global solar energy sector and will continue to be in high demand.

Country-wise Insights

What will be the Growth Outlook of the Optical Coating Market in the USA?

The USA is expected to dominate the North American region as well as the global optical coating market in terms of consumption owing to the growing end-use industries & availability of raw materials and a better manufacturing environment. Opportunities in consumer electronics, tools & equipment, automotive, aerospace & military, energy, and the medical industry make the future of the optical coating market in the USA look optimistic. Because of its better functional features and performance advantages, Optical coating is in high demand in the consumer electronics industry for high-resolution displays.

Due to its vast and diverse industrial base and because it is the world's top exporter and manufacturer of defense products, USA military spending climbed by about 2.9% in 2021, and the USA is expected to have a prominent share. Some of the top regional players, including PPG Industries, DuPont, and others are located there. All these factors along with the growth of the end-use industries are expected to drive the demand for the Optical Coating market during the forecast period. The Optical Coating market in the USA is expected to reach about US$ 6,046.5 Million by end of the year 2032.

What is the demand outlook for Optical Coating in India?

India Electronics & Semiconductor Association estimates that between 2021 and 2026, the country's semiconductor component market will reach cumulative revenues of $300 billion. The Indian semiconductor market is poised for rapid expansion over the coming years, which will aid in boosting the Indian optical coating market. Additionally, the nation is growing to be among the biggest consumers of semiconductors and electronic components.

The Make in India initiative is being promoted by India for semiconductor, automotive, and aerospace products. The country's ability to produce solar panels, automobile glass sheets, optoelectronic components, and other electronic devices will benefit from this initiative. Eventually, this development of the Indian manufacturing industry will boost the market for optical coatings. As optical coating is extensively utilized in the electronic and semiconductor industry the India optical coating market is estimated to create incremental opportunities of US$ 1,130.8 Million during the forecast period.

Category-wise Insights

What Is the Growth Outlook of Anti-Reflective coating in the Optical Coating Market?

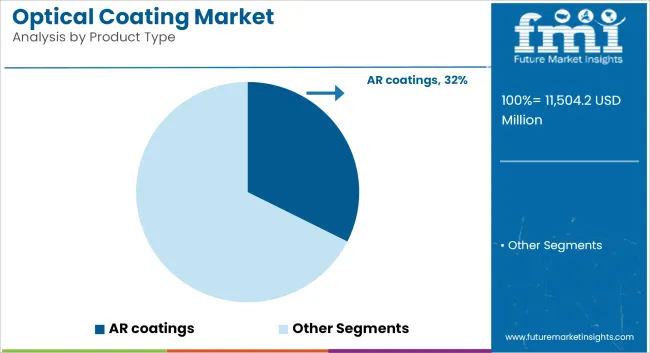
The anti-reflection coatings type segment holds a sizeable market share of the overall optical coatings market due to its capacity for high-quality coatings with low reflection and high transmission power on equipment such as display screens, mirrors, and lenses used in several consumer and industrial applications.

Due to these factors, anti-reflection coatings are becoming more popular in the global optical coatings market. The anti-reflective coatings market is being driven by advancements in the photovoltaic and eyewear industries as well as an increase in anti-reflective coating applications in the construction industry. From the abovementioned factors, the anti-reflective coating type is anticipated to reach about US$ 5,221.6 Million by end of the year 2032.

What are the growth prospects of vacuum deposition technology?

The most affordable technique for adding optical coatings is vacuum deposition technology (VDT). Compared to the evaporative coating technique, it just requires a basic instrument setup and offers a more precise coating over the surface. Therefore, both small and large-scale coating enterprises frequently favor vacuum deposition techniques.

Another advantage of vacuum deposition technology is that the process temperature can be more precisely controlled. This makes it possible to coat a variety of temperature-sensitive materials over glass surfaces using VDT. The production of high-reflective mirrors and anti-reflective coatings are the most typical uses of VDT. Owing to these features, vacuum deposition technology is growing and emerging as a popular option in the optical coating industry.

Competitive Landscape

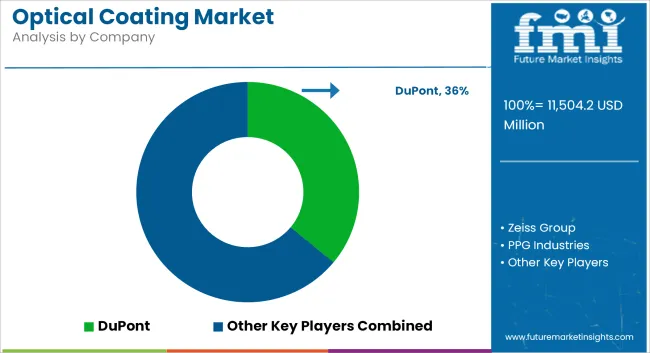
The Global Optical Coating market is a highly fragmented market with the presence of a high number of active market players. Key players are holding less than one-fourth of the market share. Market participants are making major Research and Development investments to investigate new optical coating applications in aerospace and defense equipment. Additional significant market players are vying for the top spot in the market by developing technology-driven breakthroughs in optical processes.

Also, the focus has been on the expansion of production capacities to meet the growing demand for Optical Coatings. For instance:

  • In July 2021, DuPont successfully completed the acquisition of Laird Performance Materials, a world leader in high-performance electromagnetic shielding and thermal management solutions.
  • In October 2020, SDC Technologies acquired COTEC GmbH’s thin film and coatings technology to broaden its range of liquid hard coatings
  • In May 2021, PPG completed the acquisition of Worwag, a manufacturer of coatings for industrial and automotive applications

Scope of Report

Attribute Details
Forecast Period 2022 to 2032
Historical Data Available for 2017 to 2021
Market Analysis USD Million for Value and Tons for Volume
Key Countries Covered USA, Canada, Brazil, Mexico, Germany, Italy, France, United Kingdom, Spain, BENELUX, Russia, China, Japan, South Korea, India, ASEAN, Australia and New Zealand, GCC Countries, Turkey, Northern Africa, South Africa
Key Segments Covered Type, Technology, Application, and Region
Key Companies Profiled
  • PPG Industries
  • EssilorLuxottica
  • Hoya Corporation
  • DuPont
  • Nippon Sheet Glass & Co. Ltd.
  • Edmund Optics
  • ZEISS Group
  • Zygo Corporation
  • Brewer Science Inc.
Report Coverage
  • Market Forecast, Company Share Analysis, Competition Intelligence, Drivers, Restraints, Opportunities and Threats Analysis, Market Dynamics and Challenges, and Strategic Growth Initiatives
Customization & Pricing Available Upon Request

Optical Coating Market Segmentation

By Product Type:

  • AR coatings
  • High Reflective Coatings
  • Transparent Conductive Coatings
  • Filter Coatings
  • Beam splitter Coatings
  • Others

By Technology:

  • Vacuum Deposition
  • E-beam Evaporation
  • Sputtering Process
  • Ion-Assisted Deposition

By Application:

  • Consumer Electronics
  • Lenses & Eyewear
  • Solar
  • Automotive
  • Aerospace & Defense
  • Others

By Region:

  • North America
  • Latin America
  • Europe
  • East Asia
  • South Asia and the Pacific
  • Middle East & Africa

Frequently Asked Questions

What is the current size of the Global Optical Coating Market?

The global market for Optical Coating is estimated to reach a valuation of US$ 9,718.5 Million in 2022.

What is the demand outlook for Optical Coating in various end-use industries?

The Optical Coating demand is anticipated to witness a growth rate of 8.8% over the forecast period of 2022 and 2032 in terms of value.

Who are the key players in the global market of Optical Coating?

According to FMI analysis, PPG Industries, EssilorLuxottica, Hoya Corporation, DuPont, Nippon Sheet Glass & Co. Ltd., Edmund Optics, ZEISS Group, Zygo Corporation, Brewer Science Inc., Materion, and others are identified as the key manufacturers in the Optical Coating market.

What is the estimated market share of the key players in the Global Optical Coating market?

Key players in the global Optical Coating market are expected to account for about 20-25% of the overall market share.

Which are the key countries driving the Global Optical Coating market demand?

The top countries driving the global Optical Coating demand are the USA, China, Germany, and India.

Table of Content

1. Executive Summary | Optical Coating Market

    1.1. Global Market Outlook

    1.2. Demand Side Trends

    1.3. Supply Side Trends

    1.4. Technology Roadmap

    1.5. Analysis and Recommendations

2. Market Overview

    2.1. Market Coverage / Taxonomy

    2.2. Market Definition / Scope / Limitations

3. Key Market Trends

    3.1. Key Trends Impacting the Market

    3.2. Product Innovation / Development Trends

4. Key Success Factors

    4.1. Product Adoption / Usage Analysis

    4.2. Product USPs / Features

    4.3. Strategic Promotional Strategies

5. Global Market Demand Analysis 2017 to 2021 and Forecast, 2022 to 2032

    5.1. Historical Market Volume (Tons) Analysis, 2017 to 2021

    5.2. Current and Future Market Volume (Tons) Projections, 2022 to 2032

    5.3. Y-o-Y Growth Trend Analysis

6. Global Market - Pricing Analysis

    6.1. Regional Pricing Analysis by Product Product Type and Pricing Forecast

        6.1.1. Distributor Level Pricing

        6.1.2. Manufacturer-Level Pricing

    6.2. Global Average Pricing Analysis Benchmark

7. Global Market Demand (in Value or Size in US$ Million) Analysis 2017 to 2021 and Forecast, 2022 to 2032

    7.1. Historical Market Value (US$ Million) Analysis, 2017 to 2021

    7.2. Current and Future Market Value (US$ Million) Projections, 2022 to 2032

        7.2.1. Y-o-Y Growth Trend Analysis

        7.2.2. Absolute $ Opportunity Analysis

8. Market Background

    8.1. Macro-Economic Factors

        8.1.1. Global Economic Outlook

        8.1.2. Global Chemical Sales Overview

        8.1.3. Global Chemical Industry Overview

        8.1.4. Global Consumer Electronics Industry Overview

        8.1.5. Global Automotive Production Overview

        8.1.6. Solar & Semiconductor Market Overview

    8.2. Forecast Factors - Relevance & Impact

        8.2.1. Top Companies Historical Growth

        8.2.2. Increasing applications in multiple industries

        8.2.3. GDP Growth forecast

        8.2.4. Adaption of Renewable Energy - Solar

        8.2.5. Business Climate

    8.3. Value Chain Analysis

        8.3.1. Raw Material Suppliers

        8.3.2. Product Manufacturers

        8.3.3. Probable End Users

    8.4. Market Dynamics

        8.4.1. Drivers

        8.4.2. Restraints

        8.4.3. Opportunity Analysis

    8.5. Global Supply Demand Analysis

    8.6. COVID-19 Crisis - Impact Assessment

        8.6.1. Current Statistics

        8.6.2. Short-Mid-Long Term Outlook

        8.6.3. Likely Rebound

    8.7. Market Overview by Chemical Product Type - 2021

        8.7.1. Introduction

            8.7.1.1. Inorganic Chemicals

            8.7.1.2. Organic Chemicals

        8.7.2. List of Preferred Chemical Product Types

        8.7.3. Overview of Key Developments/Patents

9. Global Market Analysis 2017 to 2021 and Forecast 2022 to 2032, By Product Type

    9.1. Introduction / Key Findings

    9.2. Historical Market Size (US$ Million) and Volume Analysis By Product Type, 2017 to 2021

    9.3. Current and Future Market Size (US$ Million) and Volume Analysis and Forecast By Product Type, 2022 to 2032

        9.3.1. AR Coatings

        9.3.2. High Reflective Coatings

        9.3.3. Transparent Conductive Coatings

        9.3.4. Filter Coatings

        9.3.5. Beam splitter Coatings

        9.3.6. EC Coatings

        9.3.7. Others

    9.4. Market Attractiveness Analysis By Product Type

10. Global Market Analysis 2017 to 2021 and Forecast 2022 to 2032, by Technology

    10.1. Introduction / Key Findings

    10.2. Historical Market Size (US$ Million) and Volume Analysis By End Use, 2017 to 2021

    10.3. Current and Future Market Size (US$ Million) and Volume Analysis and Forecast By End Use, 2022 to 2032

        10.3.1. Vacuum Deposition

        10.3.2. E-Beam Evaporation

        10.3.3. Sputtering Process

        10.3.4. Ion-Assisted Deposition (IAD)

    10.4. Market Attractiveness Analysis By End Use

11. Global Market Analysis 2017 to 2021 and Forecast 2022 to 2032, by Application

    11.1. Introduction / Key Findings

    11.2. Historical Market Size (US$ Million) and Volume Analysis By Application, 2017 to 2021

    11.3. Current and Future Market Size (US$ Million) and Volume Analysis and Forecast By Application, 2022 to 2032

        11.3.1. Consumer Electronics

        11.3.2. Lenses & Eyewear

        11.3.3. Solar

        11.3.4. Automotive

        11.3.5. Aerospace & Defense

        11.3.6. Other

    11.4. Market Attractiveness Analysis By Application

12. Global Market Analysis 2017 to 2021 and Forecast 2022 to 2032, by Region

    12.1. Introduction

    12.2. Historical Market Size (US$ Million) and Volume Analysis By Region, 2017 to 2021

    12.3. Current Market Size (US$ Million) and Volume Analysis and Forecast By Region, 2022 to 2032

        12.3.1. North America

        12.3.2. Latin America

        12.3.3. Europe

        12.3.4. East Asia

        12.3.5. South Asia and Pacific excluding India

        12.3.6. Middle East and Africa (MEA)

        12.3.7. India

    12.4. Market Attractiveness Analysis By Region

13. North America Market Analysis 2017 to 2021 and Forecast 2022 to 2032

    13.1. Introduction

    13.2. Pricing Analysis

    13.3. Historical Market Size (US$ Million) and Volume Trend Analysis By Market Taxonomy, 2017 to 2021

    13.4. Market Size (US$ Million) and Volume Forecast By Market Taxonomy, 2022 to 2032

        13.4.1. By Country

            13.4.1.1. USA

            13.4.1.2. Canada

        13.4.2. By Product Type

        13.4.3. By Technology

        13.4.4. By End Use

    13.5. Market Attractiveness Analysis

        13.5.1. By Country

        13.5.2. By Product Type

        13.5.3. By Technology

        13.5.4. By End Use

    13.6. Market Trends

    13.7. Drivers and Restraints - Impact Analysis

14. Latin America Market Analysis 2017 to 2021 and Forecast 2022 to 2032

    14.1. Introduction

    14.2. Pricing Analysis

    14.3. Historical Market Size (US$ Million) and Volume Trend Analysis By Market Taxonomy, 2017 to 2021

    14.4. Market Size (US$ Million) and Volume Forecast By Market Taxonomy, 2022 to 2032

        14.4.1. By Country

            14.4.1.1. Brazil

            14.4.1.2. Mexico

            14.4.1.3. Rest of Latin America

        14.4.2. By Product Type

        14.4.3. By Technology

        14.4.4. By End Use

    14.5. Market Attractiveness Analysis

        14.5.1. By Country

        14.5.2. By Product Type

        14.5.3. By Technology

        14.5.4. By End Use

    14.6. Market Trends

    14.7. Drivers and Restraints - Impact Analysis

15. Europe Market Analysis 2017 to 2021 and Forecast 2022 to 2032

    15.1. Introduction

    15.2. Pricing Analysis

    15.3. Historical Market Size (US$ Million) and Volume Trend Analysis By Market Taxonomy, 2017 to 2021

    15.4. Market Size (US$ Million) and Volume Forecast By Market Taxonomy, 2022 to 2032

        15.4.1. By Country

            15.4.1.1. Germany

            15.4.1.2. Italy

            15.4.1.3. France

            15.4.1.4. United Kingdom

            15.4.1.5. Spain

            15.4.1.6. BENELUX

            15.4.1.7. Russia

            15.4.1.8. Rest of Europe

        15.4.2. By Product Type

        15.4.3. By Technology

        15.4.4. By End Use

    15.5. Market Attractiveness Analysis

        15.5.1. By Country

        15.5.2. By Product Type

        15.5.3. By Technology

        15.5.4. By End Use

    15.6. Market Trends

    15.7. Drivers and Restraints - Impact Analysis

16. East Asia Market Analysis 2017 to 2021 and Forecast 2022 to 2032

    16.1. Introduction

    16.2. Pricing Analysis

    16.3. Historical Market Size (US$ Million) and Volume Trend Analysis By Market Taxonomy, 2017 to 2021

    16.4. Market Size (US$ Million) and Volume Forecast By Market Taxonomy, 2022 to 2032

        16.4.1. By Country

            16.4.1.1. China

            16.4.1.2. Japan

            16.4.1.3. South Korea

        16.4.2. By Product Type

        16.4.3. By Technology

        16.4.4. By End Use

    16.5. Market Attractiveness Analysis

        16.5.1. By Country

        16.5.2. By Product Type

        16.5.3. By Technology

        16.5.4. By End Use

    16.6. Market Trends

    16.7. Drivers and Restraints - Impact Analysis

17. South Asia and Pacific Market Analysis 2017 to 2021 and Forecast 2022 to 2032

    17.1. Introduction

    17.2. Pricing Analysis

    17.3. Historical Market Size (US$ Million) and Volume Trend Analysis By Market Taxonomy, 2017 to 2021

    17.4. Market Size (US$ Million) and Volume Forecast By Market Taxonomy, 2022 to 2032

        17.4.1. By Country

            17.4.1.1. India

            17.4.1.2. ASEAN

            17.4.1.3. Australia and New Zealand

            17.4.1.4. Rest of South Asia & Pacific

        17.4.2. By Product Type

        17.4.3. By Technology

        17.4.4. By End Use

    17.5. Market Attractiveness Analysis

        17.5.1. By Country

        17.5.2. By Product Type

        17.5.3. By Technology

        17.5.4. By End Use

    17.6. Market Trends

    17.7. Drivers and Restraints - Impact Analysis

18. Middle East and Africa Market Analysis 2017 to 2021 and Forecast 2022 to 2032

    18.1. Introduction

    18.2. Pricing Analysis

    18.3. Historical Market Size (US$ Million) and Volume Trend Analysis By Market Taxonomy, 2017 to 2021

    18.4. Market Size (US$ Million) and Volume Forecast By Market Taxonomy, 2022 to 2032

        18.4.1. By Country

            18.4.1.1. GCC Countries

            18.4.1.2. Turkey

            18.4.1.3. Northern Africa

            18.4.1.4. South Africa

            18.4.1.5. Rest of Middle East and Africa

        18.4.2. By Product Type

        18.4.3. By Technology

        18.4.4. By End Use

    18.5. Market Attractiveness Analysis

        18.5.1. By Country

        18.5.2. By Product Type

        18.5.3. By Technology

        18.5.4. By End Use

    18.6. Market Trends

    18.7. Drivers and Restraints - Impact Analysis

19. India Market Analysis 2017 to 2021 and Forecast 2022 to 2032

    19.1. Introduction

    19.2. Pricing Analysis

    19.3. Historical Market Size (US$ Million) and Volume Trend Analysis By Market Taxonomy, 2017 to 2021

    19.4. Market Size (US$ Million) and Volume Forecast By Market Taxonomy, 2022 to 2032

        19.4.1. By Region

            19.4.1.1. North India

            19.4.1.2. South India

            19.4.1.3. East India

            19.4.1.4. West India

        19.4.2. By Product Type

        19.4.3. By Technology

        19.4.4. By End Use

    19.5. Market Attractiveness Analysis

        19.5.1. By Country

        19.5.2. By Product Type

        19.5.3. By Technology

        19.5.4. By End Use

    19.6. Market Trends

    19.7. Drivers and Restraints - Impact Analysis

20. Country-Wise Market Analysis

    20.1. Introduction

    20.2. USA Market Analysis

        20.2.1. By Product Type

        20.2.2. By Technology

        20.2.3. By End Use

    20.3. Canada Market Analysis

        20.3.1. By Product Type

        20.3.2. By Technology

        20.3.3. By End Use

    20.4. Mexico Market Analysis

        20.4.1. By Product Type

        20.4.2. By Technology

        20.4.3. By End Use

    20.5. Brazil Market Analysis

        20.5.1. By Product Type

        20.5.2. By Technology

        20.5.3. By End Use

    20.6. Germany Market Analysis

        20.6.1. By Product Type

        20.6.2. By Technology

        20.6.3. By End Use

    20.7. Italy Market Analysis

        20.7.1. By Product Type

        20.7.2. By Technology

        20.7.3. By End Use

    20.8. France Market Analysis

        20.8.1. By Product Type

        20.8.2. By Technology

        20.8.3. By End Use

    20.9. United Kingdom Market Analysis

        20.9.1. By Product Type

        20.9.2. By Technology

        20.9.3. By End Use

    20.10. Spain Market Analysis

        20.10.1. By Product Type

        20.10.2. By Technology

        20.10.3. By End Use

    20.11. Russia Market Analysis

        20.11.1. By Product Type

        20.11.2. By Technology

        20.11.3. By End Use

    20.12. BENELUX Market Analysis

        20.12.1. By Product Type

        20.12.2. By Technology

        20.12.3. By End Use

    20.13. China Market Analysis

        20.13.1. By Product Type

        20.13.2. By Technology

        20.13.3. By End Use

    20.14. Japan Market Analysis

        20.14.1. By Product Type

        20.14.2. By Technology

        20.14.3. By End Use

    20.15. S. Korea Market Analysis

        20.15.1. By Product Type

        20.15.2. By Technology

        20.15.3. By End Use

    20.16. India Market Analysis

        20.16.1. By Product Type

        20.16.2. By Technology

        20.16.3. By End Use

    20.17. ASEAN Market Analysis

        20.17.1. By Product Type

        20.17.2. By Technology

        20.17.3. By End Use

    20.18. Australia and New Zealand Market Analysis

        20.18.1. By Product Type

        20.18.2. By Technology

        20.18.3. By End Use

    20.19. Turkey Market Analysis

        20.19.1. By Product Type

        20.19.2. By Technology

        20.19.3. By End Use

    20.20. South Africa Market Analysis

        20.20.1. By Product Type

        20.20.2. By Technology

        20.20.3. By End Use

21. Market Structure Analysis

    21.1. Market Analysis by Tier of Companies (Optical Coating)

    21.2. Market Concentration

    21.3. Market Share Analysis of Top Players

    21.4. Market Presence Analysis

        21.4.1. By Product Type Footprint of Players

        21.4.2. By Regional Footprint of Players

22. Competition Analysis

    22.1. Competition Dashboard

    22.2. Competition Benchmarking

    22.3. Competition Deep Dive

        22.3.1. DuPont

            22.3.1.1. Overview

            22.3.1.2. Phthalate Portfolio

            22.3.1.3. Profitability by Market Segments (Product /Channel/Region)

            22.3.1.4. Sales Footprint

            22.3.1.5. Strategy Overview

        22.3.2. Zeiss Group

            22.3.2.1. Overview

            22.3.2.2. Phthalate Portfolio

            22.3.2.3. Profitability by Market Segments (Product /Channel/Region)

            22.3.2.4. Sales Footprint

            22.3.2.5. Strategy Overview

        22.3.3. PPG Industries

            22.3.3.1. Overview

            22.3.3.2. Phthalate Portfolio

            22.3.3.3. Profitability by Market Segments (Product /Channel/Region)

            22.3.3.4. Sales Footprint

            22.3.3.5. Strategy Overview

        22.3.4. Nippon Sheet & Glass

            22.3.4.1. Overview

            22.3.4.2. Phthalate Portfolio

            22.3.4.3. Profitability by Market Segments (Product /Channel/Region)

            22.3.4.4. Sales Footprint

            22.3.4.5. Strategy Overview

        22.3.5. Inrad Optics

            22.3.5.1. Overview

            22.3.5.2. Phthalate Portfolio

            22.3.5.3. Profitability by Market Segments (Product /Channel/Region)

            22.3.5.4. Sales Footprint

            22.3.5.5. Strategy Overview

        22.3.6. EssilorLuxoticca

            22.3.6.1. Overview

            22.3.6.2. Phthalate Portfolio

            22.3.6.3. Profitability by Market Segments (Product /Channel/Region)

            22.3.6.4. Sales Footprint

            22.3.6.5. Strategy Overview

        22.3.7. Optosigma corporation

            22.3.7.1. Overview

            22.3.7.2. Phthalate Portfolio

            22.3.7.3. Profitability by Market Segments (Product /Channel/Region)

            22.3.7.4. Sales Footprint

            22.3.7.5. Strategy Overview

        22.3.8. Hoya Corporation

            22.3.8.1. Overview

            22.3.8.2. Phthalate Portfolio

            22.3.8.3. Profitability by Market Segments (Product /Channel/Region)

            22.3.8.4. Sales Footprint

            22.3.8.5. Strategy Overview

        22.3.9. Brewer Sciences Inc

            22.3.9.1. Overview

            22.3.9.2. Phthalate Portfolio

            22.3.9.3. Profitability by Market Segments (Product /Channel/Region)

            22.3.9.4. Sales Footprint

            22.3.9.5. Strategy Overview

        22.3.10. SDC Technologies

            22.3.10.1. Overview

            22.3.10.2. Phthalate Portfolio

            22.3.10.3. Profitability by Market Segments (Product /Channel/Region)

            22.3.10.4. Sales Footprint

            22.3.10.5. Strategy Overview

        22.3.11. Reynard Corporation

            22.3.11.1. Overview

            22.3.11.2. Phthalate Portfolio

            22.3.11.3. Profitability by Market Segments (Product /Channel/Region)

            22.3.11.4. Sales Footprint

            22.3.11.5. Strategy Overview

        22.3.12. Tian Cheng Optic Co., Ltd.

            22.3.12.1. Overview

            22.3.12.2. Phthalate Portfolio

            22.3.12.3. Profitability by Market Segments (Product /Channel/Region)

            22.3.12.4. Sales Footprint

            22.3.12.5. Strategy Overview

        22.3.13. Zygo Corporation

            22.3.13.1. Overview

            22.3.13.2. Phthalate Portfolio

            22.3.13.3. Profitability by Market Segments (Product /Channel/Region)

            22.3.13.4. Sales Footprint

            22.3.13.5. Strategy Overview

        22.3.14. Evaporated Coatings Inc.

            22.3.14.1. Overview

            22.3.14.2. Phthalate Portfolio

            22.3.14.3. Profitability by Market Segments (Product /Channel/Region)

            22.3.14.4. Sales Footprint

            22.3.14.5. Strategy Overview

        22.3.15. Deposition Sciences Inc.

            22.3.15.1. Overview

            22.3.15.2. Phthalate Portfolio

            22.3.15.3. Profitability by Market Segments (Product /Channel/Region)

            22.3.15.4. Sales Footprint

            22.3.15.5. Strategy Overview

        22.3.16. Helia Photonics

            22.3.16.1. Overview

            22.3.16.2. Phthalate Portfolio

            22.3.16.3. Profitability by Market Segments (Product /Channel/Region)

            22.3.16.4. Sales Footprint

            22.3.16.5. Strategy Overview

        22.3.17. Cascade Optical Corporation

            22.3.17.1. Overview

            22.3.17.2. Phthalate Portfolio

            22.3.17.3. Profitability by Market Segments (Product /Channel/Region)

            22.3.17.4. Sales Footprint

            22.3.17.5. Strategy Overview

        22.3.18. Torr Scientific Ltd.

            22.3.18.1. Overview

            22.3.18.2. Phthalate Portfolio

            22.3.18.3. Profitability by Market Segments (Product /Channel/Region)

            22.3.18.4. Sales Footprint

            22.3.18.5. Strategy Overview

        22.3.19. Precision Opticals

            22.3.19.1. Overview

            22.3.19.2. Phthalate Portfolio

            22.3.19.3. Profitability by Market Segments (Product /Channel/Region)

            22.3.19.4. Sales Footprint

            22.3.19.5. Strategy Overview

23. Assumptions and Acronyms Used

24. Research Methodology

Don't pay for what you don't need

Customize your report by selecting specific countries or regions and save 30%!

List of Tables

Table 01: Global Market Size Value (US$ Million) Forecast By Product Type, 2017 to 2032

Table 02: Global Market Size Value (US$ Million) Forecast By Technology, 2017 to 2032

Table 03: Global Market Size Volume (Tons) and Value (US$ Million) Forecast By Application, 2017 to 2032

Table 04: Global Market Size Volume (Tons) and Value (US$ Million) Forecast By Region, 2017 to 2032

Table 05: North America Market Size Value (US$ Million) Forecast By Country, 2017 to 2032

Table 06: North America Market Size Value (US$ Million) Forecast By Product Type, 2017 to 2032

Table 07: North America Market Size Value (US$ Million) Forecast By Technology, 2017 to 2032

Table 08: North America Market Size Volume (Tons) and Value (US$ Million) Forecast By Application, 2017 to 2032

Table 09: Latin America Market Size Value (US$ Million) Forecast By Country, 2017 to 2032

Table 10: Latin America Market Size Value (US$ Million) Forecast By Product Type, 2017 to 2032

Table 11: Latin America Market Size Value (US$ Million) Forecast By Technology, 2017 to 2032

Table 12: Latin America Market Size Volume (Tons) and Value (US$ Million) Forecast By Application, 2017 to 2032

Table 13: Europe Market Size Value (US$ Million) Forecast By Country, 2017 to 2032

Table 14: Europe Market Size Value (US$ Million) Forecast By Product Type, 2017 to 2032

Table 15: Europe Market Size Value (US$ Million) Forecast By Technology, 2017 to 2032

Table 16: Europe Market Size Volume (Tons) and Value (US$ Million) Forecast By Application, 2017 to 2032

Table 17: East Asia Market Size Value (US$ Million) Forecast By Country, 2017 to 2032

Table 18: East Asia Market Size Value (US$ Million) Forecast By Product Type, 2017 to 2032

Table 19: East Asia Market Size Value (US$ Million) Forecast By Technology, 2017 to 2032

Table 20: East Asia Market Size Volume (Tons) and Value (US$ Million) Forecast By Application, 2017 to 2032

Table 21: SAPeI Market Size Value (US$ Million) Forecast By Country, 2017 to 2032

Table 22: SAPeI Market Size Value (US$ Million) Forecast By Product Type, 2017 to 2032

Table 23: SAPeI Market Size Value (US$ Million) Forecast By Technology, 2017 to 2032

Table 24: SAPeI Market Size Volume (Tons) and Value (US$ Million) Forecast By Application, 2017 to 2032

Table 25: Middle East and Africa Market Size Value (US$ Million) Forecast By Country, 2017 to 2032

Table 26: Middle East and Africa Market Size Value (US$ Million) Forecast By Product Type, 2017 to 2032

Table 27: Middle East and Africa Market Size Value (US$ Million) Forecast By Technology, 2017 to 2032

Table 28: Middle East and Africa Market Size Volume (Tons) and Value (US$ Million) Forecast By Application, 2017 to 2032

Table 29: India Market Size Value (US$ Million) Forecast By Region, 2017 to 2032

Table 30: India Market Size Value (US$ Million) Forecast By Product Type, 2017 to 2032

Table 31: India Market Size Value (US$ Million) Forecast By Technology, 2017 to 2032

Table 32: India Market Size Volume (Tons) and Value (US$ Million) Forecast By Application, 2017 to 2032
Nikhil Kaitwade
Nikhil Kaitwade

Principal Consultant

Talk to Analyst

Find your sweet spots for generating winning opportunities in this market.

List of Charts

Figure 01: Global Optical Coatings) Market Historical Volume (Tons), 2017 to 2021

Figure 02: Global Market Current and Forecast Volume (Tons), 2021 to 2031

Figure 03: Global Market Historical Value (US$ Million), 2016 to 2020

Figure 04: Global Market Current and Forecast Value (US$ Million), 2021 to 2031

Figure 05: Global Market Incremental $ Opportunity (US$ Million), 2021 to 2031

Figure 06: Global Market Share and BPS Analysis By Product Type – 2022 & 2032

Figure 07: Global Market Y-o-Y Growth Projections By Product Type, 2022 to 2032

Figure 08: Global Market Attractiveness Analysis By Product Type, 2022 to 2032

Figure 09: Global Market Absolute $ Opportunity by AR Coatings Segment, 2017 to 2032

Figure 10: Global Market Absolute $ Opportunity by High Reflective Coatings Segment, 2017 to 2032

Figure 11: Global Market Absolute $ Opportunity by Transparent Conductive Coatings Segment, 2017 to 2032

Figure 12: Global Market Absolute $ Opportunity by Filter Coatings Segment, 2017 to 2032

Figure 13: Global Market Absolute $ Opportunity by Beam splitter Coatings Segment, 2017 to 2032

Figure 14: Global Market Absolute $ Opportunity by Others Segment, 2017 to 2032

Figure 15: Global Market Share and BPS Analysis By Technology – 2022 & 2032

Figure 16: Global Market Y-o-Y Growth Projections By Technology, 2022 to 2032

Figure 17: Global Market Attractiveness Analysis By Technology, 2022 to 2032

Figure 18: Global Market Absolute $ Opportunity by Vacuum Deposition Segment, 2017 to 2032

Figure 19: Global Market Absolute $ Opportunity by E-Beam Evaporation Segment, 2017 to 2032

Figure 20: Global Market Absolute $ Opportunity by Sputtering Process Segment, 2017 to 2032

Figure 21: Global Market Absolute $ Opportunity by Ion-Assisted Deposition (IAD) segment, 2017 to 2032

Figure 22: Global Market Share and BPS Analysis By Application – 2022 & 2032

Figure 23: Global Market Y-o-Y Growth Projections By Application, 2022 to 2032

Figure 24: Global Market Attractiveness Analysis By Application, 2022 to 2032

Figure 25: Global Market Absolute $ Opportunity by Consumer Electronics Segment, 2017 to 2032

Figure 26: Global Market Absolute $ Opportunity by Lenses & Eyewear Segment, 2017 to 2032

Figure 27: Global Market Absolute $ Opportunity by Solar Segment, 2017 to 2032

Figure 28: Global Market Absolute $ Opportunity by Automotive Segment, 2017 to 2032

Figure 29: Global Market Absolute $ Opportunity by Aerospace & Defense Segment, 2017 to 2032

Figure 30: Global Market Absolute $ Opportunity by Others Segment, 2017 to 2032

Figure 31: Global Market Share and BPS Analysis By Region – 2022 & 2032

Figure 32: Global Market Y-o-Y Growth Projections By Region, 2022 to 2032

Figure 33: Global Market Attractiveness Analysis By Region, 2022 to 2032

Figure 34: Global Market Absolute $ Opportunity by North America Segment, 2017 to 2032

Figure 35: Global Market Absolute $ Opportunity by Latin America Segment, 2017 to 2032

Figure 36: Global Market Absolute $ Opportunity by Europe Segment, 2017 to 2032

Figure 37: Global Market Absolute $ Opportunity by East Asia Segment, 2017 to 2032

Figure 38: Global Market Absolute $ Opportunity by SAPeI Segment, 2017 to 2032

Figure 39: Global Market Absolute $ Opportunity by Segment, 2017 to 2032

Figure 40: Global Market Absolute $ Opportunity by India Segment, 2017 to 2032

Figure 41: North America Market Share and BPS Analysis By Country – 2022 & 2032

Figure 42: North America Market Y-o-Y Growth Projections By Country, 2022 to 2032

Figure 43: North America Market Attractiveness Analysis By Country, 2022 to 2032

Figure 44: North America Market Share and BPS Analysis By Product Type – 2022 & 2032

Figure 45: North America Market Y-o-Y Growth Projections By Product Type, 2022 to 2032

Figure 46: North America Market Attractiveness Analysis By Product Type, 2022 to 2032

Figure 47: North America Market Share and BPS Analysis By Technology – 2022 & 2032

Figure 48: North America Market Y-o-Y Growth Projections By Technology, 2022 to 2032

Figure 49: North America Market Attractiveness Analysis By Technology, 2022 to 2032

Figure 50: North America Market Share and BPS Analysis By Application – 2022 & 2032

Figure 51: North America Market Y-o-Y Growth Projections By Application, 2022 to 2032

Figure 52: North America Market Attractiveness Analysis By Application, 2022 to 2032

Figure 53: Latin America Market Share and BPS Analysis By Country – 2022 & 2032

Figure 54: Latin America Market Y-o-Y Growth Projections By Country, 2022 to 2032

Figure 55: Latin America Market Attractiveness Analysis By Country, 2022 to 2032

Figure 56: Latin America Market Share and BPS Analysis By Product Type – 2022 & 2032

Figure 57: Latin America Market Y-o-Y Growth Projections By Product Type, 2022 to 2032

Figure 58: Latin America Market Attractiveness Analysis By Product Type, 2022 to 2032

Figure 59: Latin America Market Share and BPS Analysis By Technology – 2022 & 2032

Figure 60: Latin America Market Y-o-Y Growth Projections By Technology, 2022 to 2032

Figure 61: Latin America Market Attractiveness Analysis By Technology, 2022 to 2032

Figure 62: Latin America Market Share and BPS Analysis By Application – 2022 & 2032

Figure 63: Latin America Market Y-o-Y Growth Projections By Application, 2022 to 2032

Figure 64: Latin America Market Attractiveness Analysis By Application, 2022 to 2032

Figure 65: Europe Market Share and BPS Analysis By Country– 2022 & 2032

Figure 66: Europe Market Y-o-Y Growth Projections By Country, 2022 to 2032

Figure 67: Europe Market Attractiveness Analysis By Country, 2022 to 2032

Figure 68: Europe Market Share and BPS Analysis By Product Type – 2022 & 2032

Figure 69: Europe Market Y-o-Y Growth Projections By Product Type, 2022 to 2032

Figure 70: Europe Market Attractiveness Analysis By Product Type, 2022 to 2032

Figure 71: Europe Market Share and BPS Analysis By Technology – 2022 & 2032

Figure 72: Europe Market Y-o-Y Growth Projections By Technology, 2022 to 2032

Figure 73: Europe Market Attractiveness Analysis By Technology, 2022 to 2032

Figure 74: Europe Market Share and BPS Analysis By Application – 2022 & 2032

Figure 75: Europe Market Y-o-Y Growth Projections By Application, 2022 to 2032

Figure 76: Europe Market Attractiveness Analysis By Application, 2022 to 2032

Figure 77: East Asia Market Share and BPS Analysis By Country – 2022 & 2032

Figure 78: East Asia Market Y-o-Y Growth Projections By Country, 2022 to 2032

Figure 79: East Asia Market Attractiveness Analysis By Country, 2022 to 2032

Figure 80: East Asia Market Share and BPS Analysis By Product Type – 2022 & 2032

Figure 81: East Asia Market Y-o-Y Growth Projections By Product Type, 2022 to 2032

Figure 82: East Asia Market Attractiveness Analysis By Product Type, 2022 to 2032

Figure 83: East Asia Market Share and BPS Analysis By Technology – 2022 & 2032

Figure 84: East Asia Market Y-o-Y Growth Projections By Technology, 2022 to 2032

Figure 85: East Asia Market Attractiveness Analysis By Technology, 2022 to 2032

Figure 86: East Asia Market Share and BPS Analysis By Application – 2022 & 2032

Figure 87: East Asia Market Y-o-Y Growth Projections By Application, 2022 to 2032

Figure 88: East Asia Market Attractiveness Analysis By Application, 2022 to 2032

Figure 89: SAPeI Market Share and BPS Analysis By Country – 2022 & 2032

Figure 90: SAPeI Market Y-o-Y Growth Projections By Country, 2022 to 2032

Figure 91: SAPeI Market Attractiveness Analysis By Country, 2022 to 2032

Figure 92: SAPeI Market Share and BPS Analysis By Product Type – 2022 & 2032

Figure 93: SAPeI Market Y-o-Y Growth Projections By Product Type, 2022 to 2032

Figure 94: SAPeI Market Attractiveness Analysis By Product Type, 2022 to 2032

Figure 95: SAPeI Market Share and BPS Analysis By Technology – 2022 & 2032

Figure 96: SAPeI Market Y-o-Y Growth Projections By Technology, 2022 to 2032

Figure 97: SAPeI Market Attractiveness Analysis By Technology, 2022 to 2032

Figure 98: SAPeI Market Share and BPS Analysis By Application – 2022 & 2032

Figure 99: SAPeI Market Y-o-Y Growth Projections By Application, 2022 to 2032

Figure 100: SAPeI Market Attractiveness Analysis By Application, 2022 to 2032

Figure 101: Middle East and Africa Market Share and BPS Analysis By Country – 2022 & 2032

Figure 102: Middle East and Africa Market Y-o-Y Growth Projections By Country, 2022 to 2032

Figure 103: Middle East and Africa Market Attractiveness Analysis By Country, 2022 to 2032

Figure 104: Middle East and Africa Market Share and BPS Analysis By Product Type – 2022 & 2032

Figure 105: Middle East and Africa Market Y-o-Y Growth Projections By Product Type, 2022 to 2032

Figure 106: Middle East and Africa Market Attractiveness Analysis By Product Type, 2022 to 2032

Figure 107: Middle East and Africa Market Share and BPS Analysis By Technology – 2022 & 2032

Figure 108: Middle East and Africa Market Y-o-Y Growth Projections By Technology, 2022 to 2032

Figure 109: Middle East and Africa Market Attractiveness Analysis By Technology, 2022 to 2032

Figure 110: Middle East and Africa Market Share and BPS Analysis By Application – 2022 & 2032

Figure 111: Middle East and Africa Market Y-o-Y Growth Projections By Application, 2022 to 2032

Figure 112: Middle East and Africa Market Attractiveness Analysis By Application, 2022 to 2032

Figure 113: India Market Share and BPS Analysis By Country – 2022 & 2032

Figure 114: India Market Y-o-Y Growth Projections By Country, 2022 to 2032

Figure 115: India Market Attractiveness Analysis By Country, 2022 to 2032

Figure 116: India Market Share and BPS Analysis By Product Type – 2022 & 2032

Figure 117: India Market Y-o-Y Growth Projections By Product Type, 2022 to 2032

Figure 118: India Market Attractiveness Analysis By Product Type, 2022 to 2032

Figure 119: India Market Share and BPS Analysis By Technology – 2022 & 2032

Figure 120: India Market Y-o-Y Growth Projections By Technology, 2022 to 2032

Figure 121: India Market Attractiveness Analysis By Technology, 2022 to 2032

Figure 122: India Market Share and BPS Analysis By Application – 2022 & 2032

Figure 123: India Market Y-o-Y Growth Projections By Application, 2022 to 2032

Figure 124: India Market Attractiveness Analysis By Application, 2022 to 2032

Recommendations

Chemicals & Materials

Coating Additives Market

Published : August 2023

Chemicals & Materials

Automotive Refinish Coatings Market

Published : December 2022

Food and Beverage

Food Coating Ingredients Market

Published : June 2022

Explore Chemicals & Materials Insights

View Reports