The global optical spectrum analyzer market is likely to expand USD 716.0 million by 2035, recording an absolute increase of USD 304.7 million over the forecast period. The market is valued at USD 411.3 million in 2025 and is set to rise at a CAGR of 5.7% during the assessment period. The overall market size is expected to grow by nearly 1.7 times during the same period, supported by increasing demand for fiber optic network testing solutions worldwide, driving demand for precision optical measurement systems and increasing investments in 5G infrastructure deployment and data center expansion projects globally.
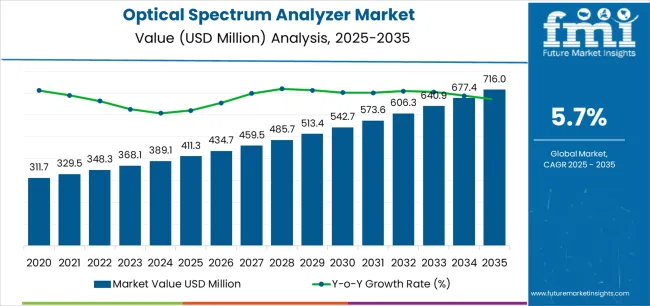
Between 2025 and 2030, the optical spectrum analyzer market is projected to expand from USD 411.3 million to USD 542.7 million, resulting in a value increase of USD 131.4 million, which represents 43.1% of the total forecast growth for the decade. This phase of development will be shaped by rising demand for fiber optic network validation and 5G infrastructure testing, product innovation in high-resolution measurement capabilities and multifunction testing platforms, as well as expanding integration with automated test equipment and cloud-based data analytics. Companies are establishing competitive positions through investment in advanced optical sensing technologies, portable form factor development, and strategic market expansion across telecommunications, data centers, and research institutions.
From 2030 to 2035, the market is forecast to grow from USD 542.7 million to USD 716.0 million, adding another USD 173.3 million, which constitutes 56.9% of the overall ten-year expansion. This period is expected to be characterized by the expansion of specialized analyzer systems, including coherent optical testing solutions and AI-powered measurement automation tailored for specific network requirements, strategic collaborations between equipment manufacturers and telecom operators, and an enhanced focus on remote testing capabilities and predictive network maintenance. The growing emphasis on optical network optimization and wavelength division multiplexing (WDM) system deployment will drive demand for advanced, high-performance optical spectrum analyzer solutions across diverse telecommunications and photonics applications.
| Metric | Value |
|---|---|
| Market Value (2025) | USD 411.3 million |
| Market Forecast Value (2035) | USD 716.0 million |
| Forecast CAGR (2025-2035) | 5.7% |
The optical spectrum analyzer market grows by enabling telecommunications engineers and network operators to achieve superior optical signal characterization and network performance validation while reducing troubleshooting time and deployment costs. Fiber optic network operators face mounting pressure to optimize wavelength utilization and ensure signal quality, with optical spectrum analyzers typically providing sub-nanometer wavelength resolution enabling detection of subtle signal degradation representing 20-30% performance loss before end-user impact, making precision optical measurement essential for network reliability. The 5G infrastructure revolution's need for high-capacity fiber backhaul creates demand for advanced spectrum analyzer solutions that can validate dense wavelength division multiplexing (DWDM) systems, characterize optical amplifier performance, and ensure consistent signal quality across expanding metropolitan and long-haul fiber networks.
Government initiatives promoting broadband infrastructure development and digital economy transformation drive adoption in IT & telecommunication, data centers, and research institutions, where optical network quality has a direct impact on service reliability and competitive positioning. The global shift toward high-speed connectivity and cloud computing accelerates optical spectrum analyzer demand as operators seek alternatives to manual testing that creates deployment delays and inconsistent measurement procedures.
The market is segmented by product type, mode type, end use, and region. By product type, the market is divided into Portable Spectrometer, Benchtop, and Handheld. Based on mode type, the market is categorized into Mode and Wavelength Meter Mode. By end use, the market includes IT & Telecommunication, Medical & Healthcare, Energy & Utilities, Automotive, Institutions, and Aerospace & Defense. Regionally, the market is divided into Asia Pacific, Europe, North America, Latin America, and Middle East & Africa.
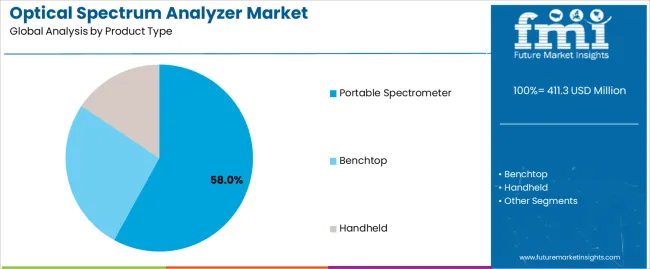
The portable spectrometer segment represents the dominant force in the optical spectrum analyzer market, capturing approximately 58.0% of total market share in 2025. This advanced category encompasses devices featuring battery-operated field-portable designs with comprehensive measurement capabilities, delivering flexibility for on-site fiber optic network testing with laboratory-grade accuracy in compact form factors. The Portable Spectrometer segment's market leadership stems from its exceptional versatility supporting field installation verification and troubleshooting, cost-effectiveness compared to benchtop alternatives while maintaining critical measurement performance, and compatibility with mobile workforce requirements in telecommunications deployment and maintenance operations.
The Benchtop segment maintains a substantial 32.0% market share, serving laboratory environments and manufacturing facilities requiring maximum measurement resolution and stability through full-featured systems for research and development, component characterization, and production testing applications where portability considerations yield to ultimate performance specifications. The Handheld segment accounts for 10.0% market share, featuring ultra-compact designs for basic optical network testing and quick fiber verification applications where simplified functionality and maximum portability justify reduced measurement capabilities.
Key advantages driving the Portable Spectrometer segment include:
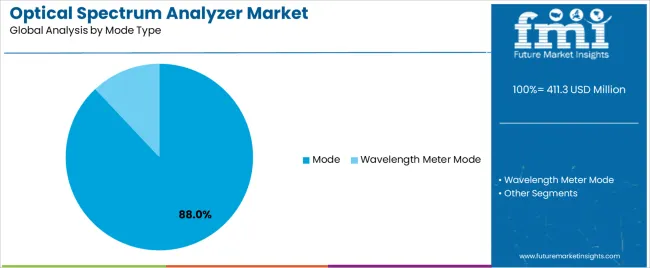
Mode applications dominate the optical spectrum analyzer market with approximately 88.0% market share in 2025, reflecting the primary utilization for spectral power distribution analysis across telecommunications, photonics research, and optical component testing throughout diverse applications. The Mode segment's market leadership is reinforced by universal requirement for optical signal characterization including wavelength identification, power measurement, and spectral purity verification across fiber optic systems, laser diode characterization, and optical amplifier testing.
The Wavelength Meter Mode segment represents 12.0% market share through specialized applications requiring ultra-high precision wavelength measurement for laser frequency stabilization, photonics research, and scientific instrumentation where absolute wavelength accuracy below 0.001 nm enables critical research and manufacturing applications beyond standard spectrum analysis requirements.
Key market dynamics supporting mode type preferences include:
IT & Telecommunication applications dominate the optical spectrum analyzer market with approximately 52.0% market share in 2025, reflecting the critical role of optical spectrum analysis in fiber optic network deployment, maintenance, and optimization throughout global telecommunications infrastructure. The IT & Telecommunication segment's market leadership is reinforced by massive fiber deployment for 5G backhaul, data center interconnects, and metro/long-haul networks requiring comprehensive optical layer validation, established protocols for optical network testing incorporating spectrum analysis as essential measurement, and continuous technology evolution toward higher channel counts and data rates necessitating advanced characterization capabilities.
The Medical & Healthcare segment represents significant market share through applications including optical coherence tomography (OCT) system development, biomedical imaging equipment validation, and laser surgical instrument testing. The Energy & Utilities segment accounts for meaningful market presence, featuring smart grid fiber optic sensor networks and power utility communication infrastructure testing. The Automotive segment serves LiDAR system development and autonomous vehicle sensor validation. The Institutions segment encompasses university research laboratories and government research facilities. The Aerospace & Defense segment includes military communication systems and satellite optical link testing applications.
Key market dynamics supporting end-use preferences include:
The market is driven by three concrete demand factors tied to optical network expansion and technology evolution.
The global fiber optic infrastructure growth creates expanding testing equipment requirements, with fiber deployment projected to reach 1 billion km globally by 2030 requiring reliable characterization tools, and optical spectrum analyzers essential for commissioning DWDM systems carrying 80+ wavelength channels in single fiber delivering terabits-per-second capacity in metropolitan and long-haul networks.
The 5G network deployment accelerates fiber testing demand, with each 5G base station requiring fiber backhaul connection averaging 10-25 Gbps capacity validated through optical spectrum analysis ensuring signal quality and wavelength compliance across dense urban deployments involving thousands of cell sites per major metropolitan area.
The data center interconnect expansion drives high-performance testing needs, with hyperscale operators deploying 400G/800G coherent optical transceivers requiring comprehensive spectral characterization validating modulation quality and ensuring multi-terabit throughput across regional and continental distances supporting cloud computing and content delivery networks.
Market restraints include high capital equipment costs affecting market accessibility, particularly for portable spectrum analyzers where USD 20,000-60,000 acquisition costs represent significant investment for small telecommunications contractors and regional service providers operating on thin profit margins. Technical expertise requirements create utilization barriers, as effective optical spectrum analyzer operation demands understanding of optical physics, fiber optic principles, and network architecture requiring trained technicians with specialized knowledge that many organizations struggle to develop and retain. Competitive pressure from alternative test equipment poses adoption challenges, as optical time-domain reflectometers (OTDRs) and optical power meters costing 30-50% less than spectrum analyzers provide adequate capabilities for basic fiber testing applications, limiting spectrum analyzer purchases to scenarios requiring detailed spectral analysis unavailable through simpler instruments.
Key trends indicate accelerated adoption of multifunction test platforms, with equipment manufacturers integrating optical spectrum analyzer capabilities into comprehensive field test units incorporating OTDR, power meters, and visual fault locators, providing technicians complete fiber characterization in single portable device. Technology advancement trends toward coherent optical testing capabilities enable analysis of advanced modulation formats including DP-QPSK and DP-16QAM used in 100G/400G systems, supporting next-generation network deployment through equipment validating signal quality parameters beyond simple power and wavelength measurements. The market thesis could face disruption if software-defined testing using tunable lasers and photodetectors achieves equivalent measurement capabilities at significantly reduced costs, eliminating dedicated spectrum analyzer hardware, or if artificial intelligence-powered network analytics reduce field testing requirements through predictive maintenance identifying fiber degradation from operational data without manual spectrum analyzer measurements
| Country | CAGR (2025-2035) |
|---|---|
| China | 7.7% |
| India | 7.1% |
| Germany | 6.6% |
| USA | 5.4% |
| UK | 4.8% |
| Japan | 4.3% |
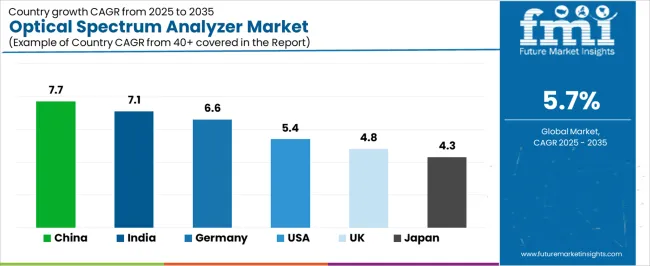
The optical spectrum analyzer market is gaining momentum worldwide, with China taking the lead thanks to massive fiber optic infrastructure deployment and 5G network expansion programs. Close behind, India benefits from digital infrastructure initiatives and telecommunications sector growth, positioning itself as a strategic growth hub in the Asia-Pacific region. Germany shows strong advancement, where industrial photonics leadership and telecommunications excellence strengthen its role in European optical testing equipment markets. The U.S. demonstrates robust growth through technology innovation leadership and extensive data center infrastructure, signaling continued investment in advanced optical network testing solutions. Meanwhile, the U.K. stands out for its telecommunications modernization programs and research institution capabilities, while Japan continues to record steady progress driven by photonics industry excellence and quality-focused network operations. Together, China and India anchor the global expansion story, while established markets build stability and innovation into the market's growth path.
The report covers an in-depth analysis of 40+ countries, Top-performing countries are highlighted below.
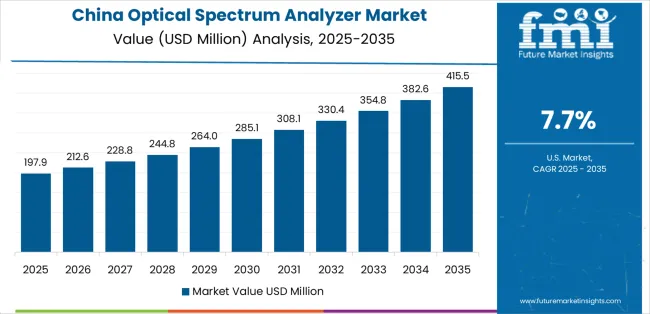
China demonstrates the strongest growth potential in the Optical Spectrum Analyzer Market with a CAGR of 7.7% through 2035. The country's leadership position stems from comprehensive fiber optic network expansion, intensive 5G infrastructure deployment, and aggressive digital economy targets driving adoption of advanced optical testing equipment. Growth is concentrated in major telecommunications hubs, including Beijing, Shanghai, Guangzhou, and Shenzhen, where network equipment manufacturers, telecom operators, and fiber optic system integrators are implementing optical spectrum analyzer programs for network deployment validation, component manufacturing quality control, and research and development applications. Distribution channels through test equipment distributors, direct manufacturer relationships, and telecom operator procurement systems expand deployment across fiber optic infrastructure projects and photonics manufacturing facilities. The country's Digital China strategy provides policy support for telecommunications infrastructure development, including fiber-to-the-home deployment and 5G network buildout requiring comprehensive optical testing capabilities.
Key market factors:
In major telecommunications markets, metropolitan areas, and technology hubs, the adoption of optical spectrum analyzer systems is accelerating across telecom operators, fiber network contractors, and research institutions, driven by Digital India initiatives and telecommunications infrastructure expansion. The market demonstrates strong growth momentum with a CAGR of 7.1% through 2035, linked to comprehensive fiber optic network deployment and increasing focus on advanced optical testing capabilities. Indian telecommunications organizations are implementing optical spectrum analyzer programs and network quality validation systems to ensure service reliability while meeting the growing bandwidth demands across 4G/5G mobile networks, enterprise connectivity, and government fiber projects. The country's expanding technology sector creates sustained demand for optical testing equipment, while growing research infrastructure drives adoption of advanced characterization tools.
Germany's advanced photonics sector demonstrates sophisticated implementation of optical spectrum analyzer programs, with documented case studies showing integration at telecommunications equipment manufacturers and research institutions achieving comprehensive optical component characterization supporting product development excellence. The country's optical testing infrastructure in major technology centers, including Munich, Berlin, Stuttgart, and Frankfurt, showcases integration of advanced spectrum analyzer technologies with existing telecommunications testing and photonics research systems, leveraging expertise in optical engineering and precision measurement. German organizations emphasize measurement accuracy and traceability standards, creating demand for high-performance optical spectrum analyzers that support quality assurance commitments and enable cutting-edge photonics research and development. The market maintains strong growth through focus on technology innovation and measurement excellence, with a CAGR of 6.6% through 2035.
Key development areas:
The USA market leads in optical spectrum analyzer technology innovation based on established telecommunications infrastructure, extensive data center networks, and comprehensive photonics research capabilities supporting advanced testing requirements. The country shows solid potential with a CAGR of 5.4% through 2035, driven by hyperscale data center expansion and telecommunications network modernization across major technology regions. American organizations are adopting advanced optical spectrum analyzers for coherent optical system validation, photonic integrated circuit characterization, and optical amplifier testing, particularly in telecommunications equipment manufacturing requiring comprehensive component validation and in research institutions pioneering next-generation optical technologies. Distribution channels through test equipment distributors, direct manufacturer sales, and integrator relationships expand coverage across diverse optical testing applications.
Leading market segments:
The UK.'s optical spectrum analyzer market demonstrates mature implementation focused on telecommunications network modernization and photonics research excellence, with documented integration at telecommunications operators and university research centers achieving comprehensive optical system characterization. The country maintains steady growth momentum with a CAGR of 4.8% through 2035, driven by fiber broadband expansion and photonics research leadership supporting advanced testing technology adoption. Major telecommunications regions, including London, Manchester, and Scotland, showcase advanced optical spectrum analyzer applications where testing programs integrate with existing network operations centers and research laboratories ensuring comprehensive optical network quality management and photonics innovation.
Key market characteristics:
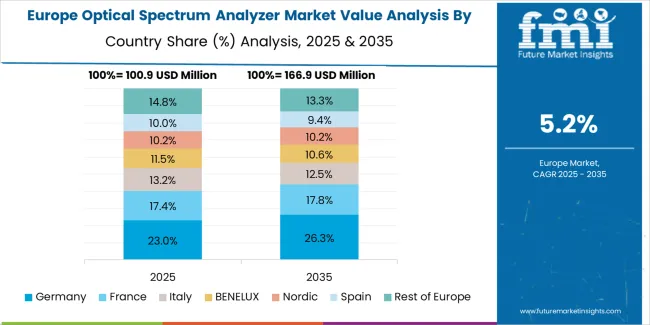
The optical spectrum analyzer market in Europe is projected to grow from USD 108.5 million in 2025 to USD 186.2 million by 2035, registering a CAGR of 5.6% over the forecast period. Germany is expected to maintain its leadership position with a 34.8% market share in 2025, declining slightly to 34.5% by 2035, supported by its extensive photonics industry infrastructure and major telecommunications equipment manufacturing centers, including Munich, Berlin, and Stuttgart technology regions.
The United Kingdom follows with a 22.5% share in 2025, projected to reach 22.2% by 2035, driven by comprehensive telecommunications infrastructure modernization programs and photonics research implementing advanced optical testing standards. France holds a 17.2% share in 2025, expected to rise to 17.4% by 2035 through ongoing fiber network expansion and photonics industry development. Italy commands a 10.8% share in both 2025 and 2035, backed by telecommunications infrastructure and optical component manufacturing. Spain accounts for 7.5% in 2025, rising to 7.7% by 2035 on fiber broadband deployment and mobile network expansion. Switzerland maintains 4.2% in 2025, reaching 4.4% by 2035 on precision instrumentation leadership and photonics research excellence. The Rest of Europe region is anticipated to hold 3.0% in 2025, expanding to 3.3% by 2035, attributed to increasing optical spectrum analyzer adoption in Nordic telecommunications markets and emerging Central & Eastern European fiber infrastructure programs.
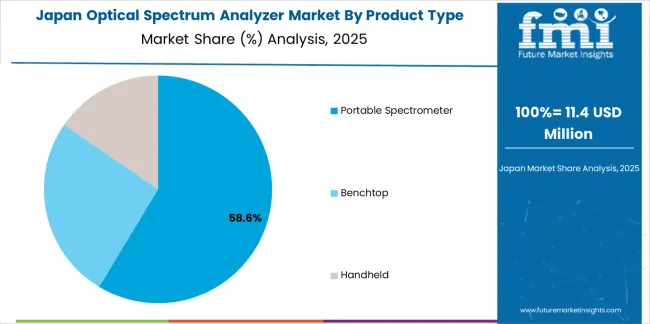
The Japanese optical spectrum analyzer market demonstrates a mature and precision-focused landscape, characterized by sophisticated integration of advanced measurement technologies with existing telecommunications testing, photonics manufacturing quality control, and traditional meticulous engineering practices across quality-oriented technology sectors. Japan's emphasis on measurement accuracy and equipment reliability drives demand for rigorously calibrated optical spectrum analyzers that support precision manufacturing commitments and research excellence expectations in demanding photonics applications. The market benefits from strong partnerships between international test equipment manufacturers and domestic measurement equipment distributors including major trading houses, creating comprehensive service ecosystems that prioritize technical training and calibration support programs. Technology regions in Tokyo, Osaka, Hamamatsu, and other major centers showcase advanced optical spectrum analyzer implementations where testing programs achieve comprehensive traceability through national metrology standards and continuous calibration verification protocols.
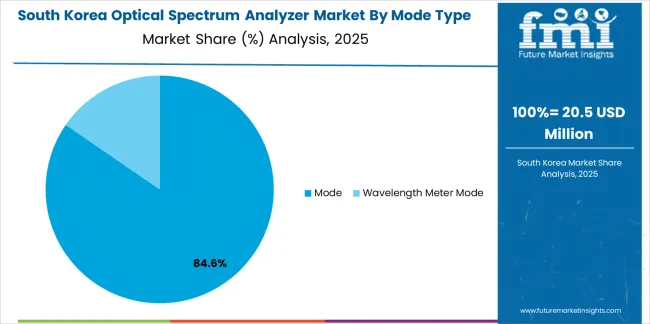
The South Korean optical spectrum analyzer market is characterized by growing international test equipment manufacturer presence, with companies maintaining significant positions through comprehensive technical capabilities and advanced measurement solutions for telecommunications and photonics applications. The market demonstrates increasing emphasis on 5G network testing and photonics manufacturing quality control, as Korean organizations increasingly demand sophisticated optical spectrum analyzers that integrate with domestic telecommunications infrastructure and advanced manufacturing systems deployed across major technology companies. Regional test equipment distributors are gaining market share through strategic partnerships with international manufacturers, offering specialized services including Korean regulatory compliance support and customized application training programs for telecommunications and photonics sectors. The competitive landscape shows increasing collaboration between multinational test equipment companies and Korean technology specialists, creating hybrid service models that combine international measurement expertise with local telecommunications practice knowledge and manufacturing quality system integration capabilities.
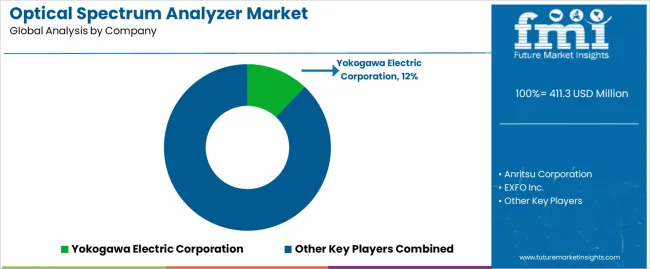
The optical spectrum analyzer market features approximately 10-15 meaningful players with moderate concentration, where the top three companies control roughly 52-57% of global market share through established technology platforms and comprehensive distribution networks. Competition centers on measurement performance specifications, portability features, and application support rather than price competition alone. Yokogawa Electric Corporation leads with approximately 12% market share through its comprehensive optical testing portfolio including high-performance spectrum analyzers.
Market leaders include Yokogawa Electric Corporation, Anritsu Corporation, and EXFO Inc., which maintain competitive advantages through decades of optical measurement expertise and extensive R&D investment, global service networks providing calibration services and technical support across major telecommunications markets, and comprehensive product portfolios ranging from portable field units to laboratory-grade benchtop systems across multiple price points, creating reliability and application breadth advantages with telecommunications operators and test equipment distributors. These companies leverage research and development capabilities in photonics engineering and ongoing technology advancement programs to defend market positions while expanding into coherent optical testing capabilities and AI-powered measurement automation.
Challengers encompass Keysight Technologies and VIAVI Solutions Inc., which compete through specialized measurement capabilities and strong presence in key telecommunications equipment manufacturing markets. Product specialists focus on specific application segments or form factors, offering differentiated capabilities in handheld designs, ultra-high resolution laboratory systems, and specialized applications for coherent optical testing or photonic integrated circuit characterization.
Regional players and emerging technology providers create competitive pressure through innovative measurement approaches and cost-competitive alternatives, particularly in high-growth markets including China and India, where domestic manufacturing capabilities and localized support provide advantages in price-sensitive telecommunications contractor segments. Market dynamics favor companies that combine proven measurement accuracy with comprehensive application support offerings including telecommunications-specific measurement routines, automated test sequences, and data management software that address complete optical network characterization requirements across fiber deployment, network commissioning, and ongoing maintenance operations throughout multi-decade fiber infrastructure lifecycles.
Optical spectrum analyzers represent precision optical measurement systems that enable telecommunications engineers to achieve sub-nanometer wavelength resolution detecting 20-30% signal degradation before end-user impact, delivering superior network quality assurance and troubleshooting efficiency with proven reliability enabling terabit-scale DWDM system validation in demanding telecommunications applications. With the market projected to grow from USD 411.3 million in 2025 to USD 716.0 million by 2035 at a 5.7% CAGR, these essential test instruments offer compelling advantages - network optimization, deployment acceleration, and cost reduction - making them essential for IT & Telecommunication operators (52.0% market share), photonics manufacturers, and organizations requiring optical signal characterization supporting fiber infrastructure expansion and next-generation optical technology development. Scaling market adoption and technology advancement requires coordinated action across telecommunications policy, test standards, equipment manufacturers, technical training programs, and fiber infrastructure investment capital.
| Item | Value |
|---|---|
| Quantitative Units | USD 411.3 million |
| Product Type | Portable Spectrometer, Benchtop, Handheld |
| Mode Type | Mode, Wavelength Meter Mode |
| End Use | IT & Telecommunication, Medical & Healthcare, Energy & Utilities, Automotive, Institutions, Aerospace & Defense |
| Regions Covered | Asia Pacific, Europe, North America, Latin America, Middle East & Africa |
| Country Covered | China, India, Germany, U.S., U.K., Japan, and 40+ countries |
| Key Companies Profiled | Yokogawa Electric Corporation, Anritsu Corporation, EXFO Inc., Keysight Technologies, VIAVI Solutions Inc. |
| Additional Attributes | Dollar sales by product type, mode type, and end-use categories, regional adoption trends across Asia Pacific, Europe, and North America, competitive landscape with test equipment manufacturers and distribution networks, measurement specification requirements and standards, integration with telecommunications testing programs and photonics research initiatives, innovations in optical sensing technology and measurement automation systems, and development of specialized spectrum analyzers with enhanced resolution and portability capabilities. |
The global optical spectrum analyzer market is estimated to be valued at USD 411.3 million in 2025.
The market size for the optical spectrum analyzer market is projected to reach USD 716.0 million by 2035.
The optical spectrum analyzer market is expected to grow at a 5.7% CAGR between 2025 and 2035.
The key product types in optical spectrum analyzer market are portable spectrometer, benchtop and handheld.
In terms of mode type, mode segment to command 88.0% share in the optical spectrum analyzer market in 2025.


Full Research Suite comprises of:
Market outlook & trends analysis
Interviews & case studies
Strategic recommendations
Vendor profiles & capabilities analysis
5-year forecasts
8 regions and 60+ country-level data splits
Market segment data splits
12 months of continuous data updates
DELIVERED AS:
PDF EXCEL ONLINE
Optical Character Recognition Market Forecast and Outlook 2025 to 2035
Optical Satellite Market Size and Share Forecast Outlook 2025 to 2035
Optical Imaging Market Size and Share Forecast Outlook 2025 to 2035
Optical Whitening Agents Market Size and Share Forecast Outlook 2025 to 2035
Optical Fingerprint Collector Market Size and Share Forecast Outlook 2025 to 2035
Optical Lens Materials Market Size and Share Forecast Outlook 2025 to 2035
Optical Microscope Market Size and Share Forecast Outlook 2025 to 2035
Optical Component Tester Market Size and Share Forecast Outlook 2025 to 2035
Optical EMI Shielding Adapters Market Size and Share Forecast Outlook 2025 to 2035
Optical Connector Polishing Films Market Size and Share Forecast Outlook 2025 to 2035
Optical Transmitter Market Size and Share Forecast Outlook 2025 to 2035
Optical Telephoto Lens Market Size and Share Forecast Outlook 2025 to 2035
Optical Lattice Clock Market Size and Share Forecast Outlook 2025 to 2035
Optical Grade Lithium Tantalate Wafers Market Size and Share Forecast Outlook 2025 to 2035
Optical Grade LiTaO3 Crystal Substrate Market Size and Share Forecast Outlook 2025 to 2035
Optical Brighteners Market Size and Share Forecast Outlook 2025 to 2035
Optical Liquid Level Sensor Market Size and Share Forecast Outlook 2025 to 2035
Optical Fiber Market Size and Share Forecast Outlook 2025 to 2035
Optical Communication and Networking Market Size and Share Forecast Outlook 2025 to 2035
Optical Fiber Connectivity Market Size and Share Forecast Outlook 2025 to 2035

Thank you!
You will receive an email from our Business Development Manager. Please be sure to check your SPAM/JUNK folder too.
Chat With
MaRIA