

- Market Size (2026)
- USD 16.3 Bn
- Forecast (2036)
- USD 63.0 Bn
- CAGR (2026 to 2036)
- 14.5%
Optical Transceivers Market Size, Market Forecast and Outlook By FMI
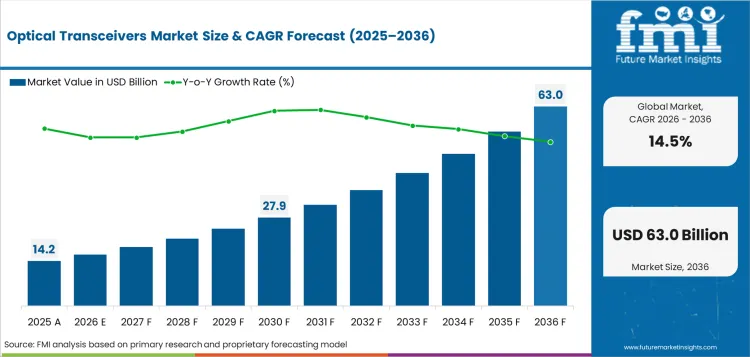
The optical transceivers market was valued at USD 14.2 billion in 2025. The market is set to reach USD 16.3 billion by 2026-end and grow at a CAGR of 14.5% between 2026-2036 to reach USD 63.0 billion by 2036. xSFP will dominate with a 68.0% share, while Less than 10G will lead with a 41.0% share.
Summary of the Optical Transceivers Market
- Demand and Growth Drivers
- Accelerating data infrastructure investment across hyperscale operators and enterprise IT environments is expanding the addressable market for optical transceivers solutions.
- Cloud migration and edge computing deployment are generating incremental demand for higher-performance configurations, shifting procurement toward advanced product tiers.
- 5G network densification and AI workload expansion are creating structural demand tailwinds that extend beyond traditional IT procurement cycles.
- Product and Segment View
- xSFP is expected to continue to be a top form factor segment, backed by 68% share of demand from primary end-use applications.
- 41% data rate demand from core application segments driven by volume driven procurement Less than 10G
- Data Centers represent 39.1% of the application segment, fueled by application-specific performance and compliance demands.
- Geography and Competitive Outlook
- China is likely to remain a key market owing to large-scale industrial capacity, government-backed modernization programs, and expanding domestic consumption.
- USA is likely to sustain demand on account of strong institutional procurement, regulatory compliance cycles, and aftermarket demand.
- Companies that can combine form factor capabilities and large-scale producer access are likely to gain traction during the forecast period.
- Analyst Opinion
- Sudip saha, Principal Consultant at FMI says, 'Companies that can improve cost competitiveness while delivering consistent performance in xsfp and less than 10g applications are likely to strengthen their position over the forecast period.'
- The optical transceivers market is evolving from a volume-driven category into a more defined market where product performance and compliance determine competitive positioning.
- The optical transceivers market is transitioning from a volume-driven category to a more defined market where product performance and compliance drive competitive positioning.
- Adoption driven by structural shifts in end-use purchasing, not cyclical recovery, points to persistent demand growth.
- Regulatory driven upgrade cycles are also supporting the market as they generate replacement demand in addition to organic growth.
Key Takeaways, Market Size, and Forecast
- The optical transceivers market was valued at USD 14.20 billion in 2025.
- By 2036, the Optical Transceivers Market is expected to be worth USD 62.97 billion.
- From 2026 to 2036, the market is projected to expand at a CAGR of 14.5%.
- The market is projected to create an incremental opportunity of USD 46.71 billion between 2026 and 2036.
- In 2026, xSFP is expected to account for 68% of the Form Factor, driven by rising deployment across enterprise and infrastructure applications.
- China (9.2%) and USA (8.5%) are two of the fastest growing markets in the world.
Optical Transceivers Market Definition
The optical transceivers market is segmented on the basis of solution, on the basis of form factor, data rate, application, connector type. The market comprises of all the commercially available products and services. The market covers existing product configurations and emerging technology variations for industrial, commercial, and institutional applications.
Optical Transceivers Market Inclusions
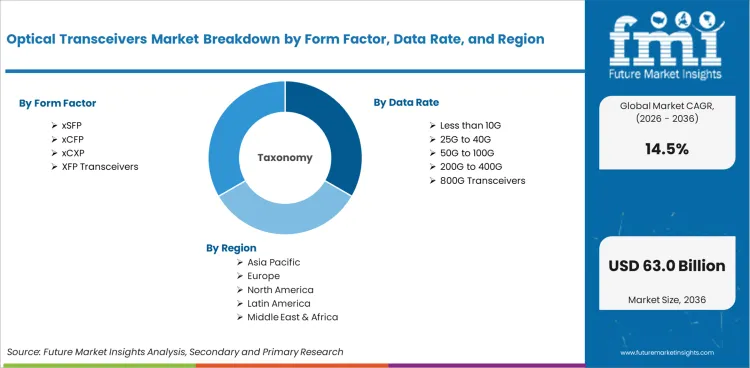
Market scope includes all commercially traded products based on form factor (xSFP, xCFP, xCXP, XFP Transceivers), data rate (Less than 10G, 25G to 40G, 50G to 100G, 200G to 400G, 800G Transceivers), application (Data Centers, Media, IT & Telecom, Healthcare, Energy & Power), connector type (LC Connector, SC Connector, MPO - MTP Connector, Others). The revenue size ranges from 2026 to 2036.
Optical Transceivers Market Exclusions
The scope does not include raw or unprocessed materials that are not commercially classified within the defined product taxonomy, components sold as part of unrelated systems where optical transceivers functionality is incidental, or products manufactured exclusively for internal consumption without commercial distribution.
Optical Transceivers Market Research Methodology
- Primary Research: FMI analysts conducted interviews with manufacturers, distributors, procurement managers, and technical specialists across key markets to gather primary demand intelligence and validate market dynamics.
- Desk Research: Combined data from industry associations, regulatory filings, corporate annual reports, and trade publications to build comprehensive market intelligence.
- Market Sizing and Forecasting: Bottom-up aggregation from segment-level transaction data across product categories, applications, and regions, validated against top-down industry benchmarks.
- Data Validation: Cross-checked quarterly against global production statistics, trade data, and manufacturer disclosures to ensure forecast accuracy.
Why is the Optical Transceivers Market Growing?
- Structural demand growth across primary end-use segments is supporting a 14.5% CAGR through the forecast period, with growth concentrated in form factor applications.
- China leads country growth at 9.2% driven by large-scale industrial capacity and government-backed modernization driving volume expansion.
- Regulatory compliance and performance standardization are creating upgrade cycles that will drive replacement demand beyond organic market expansion.
The global optical transceivers market size is projected to grow at a CAGR of 14.5% during the forecast period of 2026 to 2036. The demand for optical transceivers is driven by the structural changes in procurement of end-use, compliance cycles with regulations, and technology driven performance requirements. The xSFP segment is the largest in demand, with concentrated procurement from primary end-use categories where specification-based purchasing is driven by performance and reliability requirements.
Enterprise digital transformation and infrastructure modernization are creating multi-year procurement cycles that exceed traditional technology refresh timelines. The procurement segments with the greatest concentration are cloud service providers and telecommunications operators. Procurement decisions are increasingly linked to performance benchmarks and total cost of ownership, not just initial acquisition cost.
The competitive landscape is being shaped by technology standardization and interoperability requirements with procurement favoring market players with certified solutions that are compatible with multiple platforms. The demand for open architecture standards is lowering switching costs for large-scale buyers and turning up the heat on vendors to differentiate on performance, reliability and service level commitments.
Market Segmentation Analysis
- xSFP is the leading form factor, holding a 68% market share and used in a number of end-use categories.
- The less than 10G segment accounts for the largest share of demand, 41%, with procurement driven by high-volume application categories.
- II-VI Incorporated is leading distribution, showing established procurement relationships and contract manufacturing strength.
The optical transceivers market is segmented on the basis of form factor, data rate, application, connector type . According to form factor: XFP, xSFP, xCFP, xCXP transceivers. By data rate Less than 10G 25G to 40G 50G to 100G 200G to 400G Application: Data Center, Media, IT & Telecom, Healthcare. The market is segmented based on connector type into LC Connector, SC Connector, MPO - MTP Connector and Others.
Insights into the xSFP Form Factor Segment
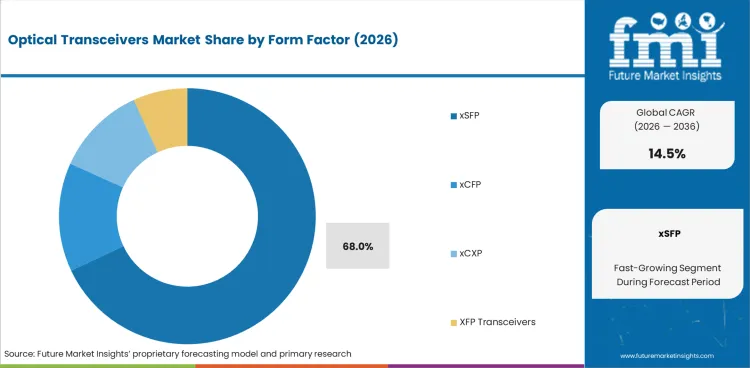
The xSFP market share is expected to be 68% in 2026. Demand is focused on use cases where form factor performance directly impacts operational outcomes and compliance posture. Procurement decisions in this segment are driven by specification requirements, cost-performance ratios, and supplier reliability over multi-year contracting cycles.
Insights into the Less than 10G Data Rate Segment
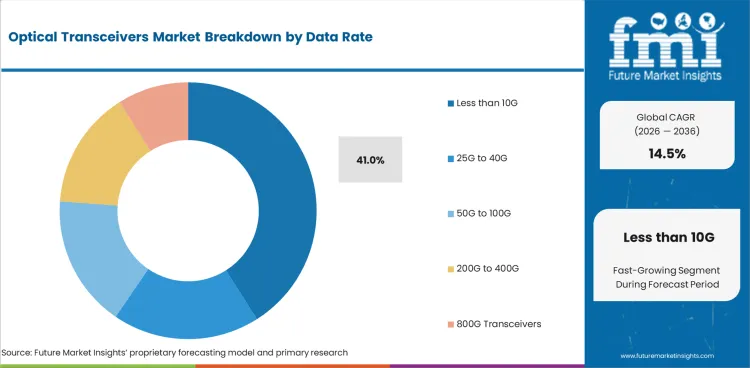
Less than 10G is the biggest slice of the data rate pie, representing 41%. The growth in this category is driven by the expanded application scope and increased procurement volume from institutional and industrial buyers. Performance certification, regulatory compliance and cost competitiveness in different geographic markets shape product differentiation.
Optical Transceivers Market Drivers, Restraints, and Opportunities
- Regulatory compliance requirements and certification mandates are creating structured demand for optical transceivers products across primary end-use segments.
- They are more expensive than traditional ones, limiting their use in price-sensitive sectors, with growth concentrated in the premium and certified sectors.
- Advancement of technology and expanding application scope is generating incremental demand from hitherto unserved end-use categories.
Optical transceivers market is growing on account of regulatory compliance requirements, technological advancements, and increasing application scope. “Despite the challenges such as cost premiums and scaling constraints, there are opportunities in compliance-driven procurement, performance upgrading and geographic expansion into high-growth markets.
Regulatory and Compliance Driven Demand
Demand is driven by regulatory requirements for standardized product specifications and performance certifications. In North America, Europe and East Asia, structured procurement cycles are emerging as compliance requirements cause institutional buyers to align purchasing decisions with regulatory timelines and certification renewal schedules.
Cost Premium and Scalability Constraints
Cost-performance trade-offs limit adoption and penetration in price-sensitive segments. Procurement premiums are justified for higher-margin premium product categories based on performance specifications, while commodity-grade applications are subject to margin compression from competitive intensity and input cost volatility.
Technology Driven Application Expansion
Growth is the result of technology progress that expands the scope of application that can be treated. Apart from the conventional end-use segments, the incremental demand for applications previously served by alternative solutions is being created by performance improvements across core product categories.
Supply Chain and Sourcing Dynamics
Procurement is affected by supply chain concentration risks and sourcing reliability considerations. Buyers with multi-year procurement requirements are diversifying supplier bases and placing a premium on manufacturers with proven production capacity, quality consistency and delivery reliability across geographic markets.
Analysis of Optical Transceivers Market By Key Countries
.webp "Top Country Growth Comparison Optical Transceivers Market Cagr (2026 2036)")
| Country | CAGR |
|---|---|
| China | 9.2% |
| USA | 8.5% |
| South Korea | 8.3% |
| Japan | 8% |
| Germany | 7.8% |
| UK | 7.6% |
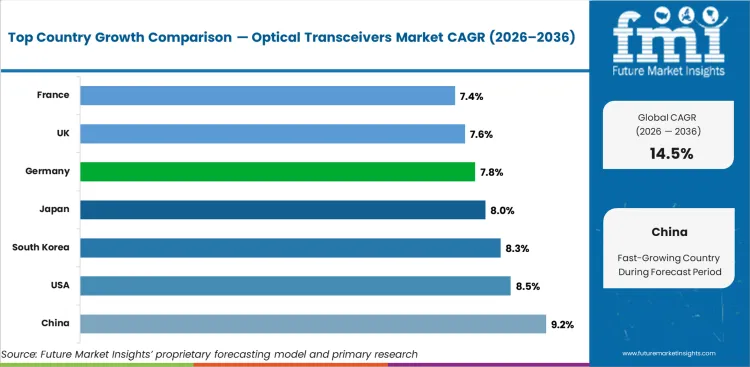
- China at 9.2% reflects large-scale industrial capacity and government-backed modernization driving volume expansion.
- USA at 8.5% reflects institutional and aftermarket demand with regulatory compliance driving upgrade cycles.
- South Korea at 8.3% reflects technology-intensive manufacturing and export-oriented production supporting growth.
- Japan at 8% reflects advanced manufacturing and quality-driven procurement sustaining technology leadership.
The global optical transceivers market is expected to grow at a rate of 14.5% per year from 2026 to 2036. The study covers more than 30 countries, and the main markets are listed below.
Demand Outlook for Optical Transceivers Market in China
China’s growth is projected at 9.2% through 2036. Growth is indicative of increasing industrial capacity, government supported modernization schemes and rising domestic consumption across key end use segments. Increased production and technology transfer from international manufacturers are contributing to improved quality and cost competitiveness.
- Volume procurement growth driven by industrial capacity expansion.
- Government modernization programs create structured channels of demand.
- Improving domestic production capabilities are making costs more competitive.
Future Outlook for Optical Transceivers Market in USA
The USA is projected to grow at 8.5% until 2036. Demand drivers include cycles of regulatory compliance, aftermarket replacement volumes, and institutional procurement from large industrial and commercial end-users. II-VI Incorporated has distribution channels and purchasing relationships established throughout the US market.
- Upgrade and replacement cycles are maintained by regulatory compliance requirements.
- Aftermarket procurement from the aging installed base creates recurring demand
- Institutional buyers want performance certification and reliable supply.
Opportunity Analysis of Optical Transceivers Market in South Korea
South Korea is expected to grow by 8.3% by 2036. Export-oriented production and technology-intensive manufacturing capacity are supporting market growth. Sustained procurement volumes are being generated by government investment programs and domestic industrial modernization.
- Technology-intensive manufacturing spurs the demand for export-oriented manufacturing.
- Domestic market modernization is through government investment programs.
- Industrial procurement is the reflection of standardization of quality and performance.
In-depth Analysis of Optical Transceivers Market in Japan
Japan is predicted to expand by 8% through 2036. Technology leadership is maintained through advanced manufacturing capabilities and quality-driven procurement standards. Demand is driven by institutional purchasing that appreciates product reliability, performance consistency and long-term supplier relationships.
- Quality led procurement standards support premium product demand.
- Advanced manufacturing is a driver of technology leadership and export competitiveness.
- Institutional buying strategies emphasize the development of long-term supplier relationships.
Sales Analysis of Optical Transceivers Market in Germany
Germany is expected to grow by 7.8% by 2036. Manufacturing-intensive engineering and export demand underpin market growth. Germany is a high value procurement market, with advanced industrial infrastructure and leadership in regulatory compliance.
- Volume growth is supported by end use demand growth.
- Structured demand is created by institutional procurement patterns.
- Compliance purchasing is driven by regulatory alignment.
Growth Prospects for Optical Transceivers Market in UK
UK is forecast to grow at 7.6% to 2036. Compliance driven procurement, institutional demand and post regulatory transition needs are maintaining market momentum. Quality standardization and performance certification requirements drive the procurement decisions across end-use segments.
- Compliance-driven procurement supports upgrade cycle demand.
- Institutional end-users care about certified product specifications.
- Incremental procurement requirements post regulatory transition.
Competitive Landscape and Strategic Positioning
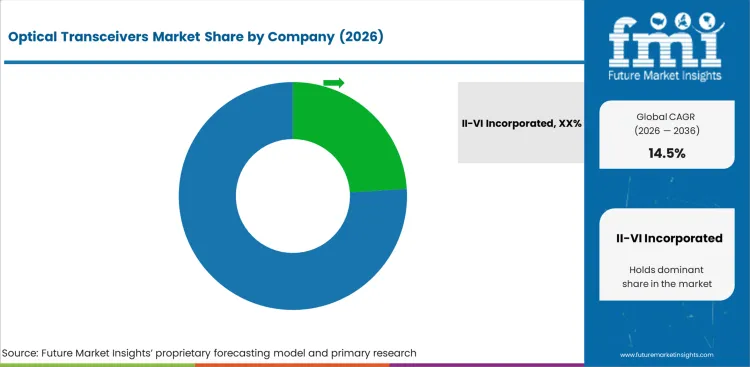
- II-VI Incorporated holds approximately 24% market share and leads through integrated production capabilities and established procurement relationships across primary end-use segments.
- Lumentum Holdings Inc., Broadcom Inc., and InnoLight Technology all offer complementary product ranges across the value chain.
- New players are focusing on specialized applications and technology differentiation to establish competitive positions in high-growth segments.
II-VI Incorporated leads through broad product portfolio coverage, multi-regional manufacturing capabilities, and established procurement relationships with institutional buyers. Lumentum Holdings Inc. competes through complementary product offerings and regional distribution strength.
Broadcom Inc. and other established manufacturers maintain market positions through technology specialization, regional market access, and application-specific product development.
Barriers include price sensitivity across the value chain, regulatory approval requirements for new product entries, production scaling challenges, and established supply chain relationships. Strategic priorities include cost reduction, geographic expansion, and partnerships for compliance-driven procurement programs.
Key Companies in the Optical Transceivers Market
Key global companies leading the optical transceivers market include:
- II-VI Incorporated, Lumentum Holdings Inc., Broadcom Inc., InnoLight Technology, Accelink Technologies, Hisense Broadband maintain established market positions through broad product portfolios, multi-regional manufacturing capabilities, and institutional procurement relationships.
Competitive Benchmarking: Optical Transceivers Market
| Company | Product Breadth | Technology Capability | Distribution Reach | Geographic Footprint |
|---|---|---|---|---|
| II-VI Incorporated | High | High | Strong | Global |
| Lumentum Holdings Inc. | High | High | Strong | Global |
| Broadcom Inc. | High | Medium | Strong | Global |
| InnoLight Technology | Medium | Medium | Moderate | Multi-regional |
| Accelink Technologies | Medium | Medium | Moderate | Multi-regional |
| Hisense Broadband | Medium | Medium | Moderate | Multi-regional |
Source: Future Market Insights competitive analysis, 2026.
Key Developments in Optical Transceivers Market
- In 2025, Coherent Corp. continued expanding its advanced photonics, optical communications, and semiconductor component portfolio through new high-performance optical technologies supporting AI datacenters, industrial manufacturing, aerospace, and communications applications across North America and Europe.
- In 2025, Lumentum Holdings Inc. continued expanding its photonics manufacturing and supply chain capabilities through investments supporting growing demand from AI datacenter, telecom, cloud networking, and industrial technology markets across East Asia and other global regions.
Key Players in the Optical Transceivers Market
Major Global Players
- II-VI Incorporated
- Lumentum Holdings Inc.
- Broadcom Inc.
- InnoLight Technology
- Accelink Technologies
- Hisense Broadband
Report Scope and Coverage
| Parameter | Details |
|---|---|
| Quantitative Units | USD 16.26 billion to USD 62.97 billion, at a CAGR of 14.5% |
| Market Definition | The optical transceivers market encompasses form factor, data rate, application, connector type segmentation across commercial and institutional applications. |
| Regions Covered | North America, Latin America, Europe, East Asia, South Asia and Pacific, Middle East and Africa |
| Countries Covered | China, USA, South Korea, Japan, Germany, UK, France, Australia, Italy, New Zealand, 30 plus countries |
| Key Companies Profiled | II-VI Incorporated, Lumentum Holdings Inc., Broadcom Inc., InnoLight Technology, Accelink Technologies, Hisense Broadband |
| Forecast Period | 2026 to 2036 |
| Approach | Hybrid bottom-up and top-down methodology starting with verified transaction data, projecting adoption velocity across segments and regions. |
Market Segmentation Analysis
Optical Transceivers Market Segmented by Form Factor:
- xSFP
- xCFP
- xCXP
- XFP Transceivers
Optical Transceivers Market Segmented by Data Rate:
- Less than 10G
- 25G to 40G
- 50G to 100G
- 200G to 400G
- 800G Transceivers
Optical Transceivers Market Segmented by Application:
- Data Centers
- Media
- IT & Telecom
- Healthcare
- Energy & Power
- Industrial
Optical Transceivers Market Segmented by Connector Type:
- LC Connector
- SC Connector
- MPO - MTP Connector
- Others
Optical Transceivers Market by Region:
- North America
- USA
- Canada
- Mexico
- Latin America
- Brazil
- Chile
- Rest of Latin America
- Western Europe
- Germany
- UK
- Italy
- Spain
- France
- Nordic
- BENELUX
- Rest of Western Europe
- Eastern Europe
- Russia
- Poland
- Hungary
- Balkan & Baltic
- Rest of Eastern Europe
- East Asia
- China
- Japan
- South Korea
- South Asia and Pacific
- India
- ASEAN
- Australia & New Zealand
- Rest of South Asia and Pacific
- Middle East & Africa
- Kingdom of Saudi Arabia
- Other GCC Countries
- Turkiye
- South Africa
- Other African Union
- Rest of Middle East & Africa
Research Sources and Bibliography
- 1. International Telecommunication Union. (2025). ITU ICT Infrastructure and Connectivity Statistics. ITU.
- 2. USA Federal Communications Commission. (2024). FCC Broadband and Infrastructure Report. FCC.
- 3. European Commission. (2025). EC Digital Economy and Society Index. European Commission.
- 4. Institute of Electrical and Electronics Engineers. (2025). IEEE Standards and Publications Database. IEEE.
- 5. World Economic Forum. (2025). WEF Global Information Technology Report. WEF.
This bibliography is provided for reader reference.
This Report Answers
- Estimating the size of the market and how much money it will make from 2026 to 2036.
- Dividing up by form factor, data rate, application, connector type.
- Insights about more than 30 markets in the region.
- Analysis of technology that includes core product categories and emerging configurations.
- Assessment of the competitive landscape.
- Finding investment opportunities in high-growth segments and regions.
- Keeping track of the supply chain.
- Delivery of data in PDF and Excel formats.
Frequently Asked Questions
What is the global market demand for Optical Transceivers Market in 2026?
In 2026, the global optical transceivers market is expected to be worth USD 16.26 billion.
How big will the market for Optical Transceivers Market be in 2036?
By 2036, the market for optical transceivers market is expected to be worth USD 62.97 billion.
How much do you think demand for Optical Transceivers Market will grow between 2026 and 2036?
Between 2026 and 2036, the demand for optical transceivers market is expected to grow at a CAGR of 14.5%.
Which Form Factor is likely to be the best seller in the Optical Transceivers Market by 2026?
xSFP will make up 68% of the market in 2026. This shows that xsfp is the primary demand category due to rising deployment across enterprise and infrastructure applications.
What is causing demand to rise in China in the Optical Transceivers Market?
China is expected to grow at a rate of 9.2% per year through 2036, thanks to large-scale industrial capacity and government-backed modernization driving volume expansion.
What is causing demand to rise in USA in the Optical Transceivers Market?
USA is expected to grow at a rate of 8.5% per year through 2036, thanks to institutional and aftermarket demand with regulatory compliance driving upgrade cycles.
What does this report mean by 'Optical Transceivers Market definition'?
The optical transceivers market includes products and services classified by form factor, data rate, application, connector type, spanning the 2026 to 2036 forecast period.
How does FMI make the Optical Transceivers Market forecast and check it?
Forecasting models use a hybrid bottom-up and top-down approach, starting with verified transaction data and checking it against global production statistics and manufacturer disclosures.
Preview the report firsthand - request a free sample
Get SampleGet the brochure for pricing and purchase details.
Get PDFTable of Content
- Executive Summary
- Global Market Outlook
- Demand-side Trends
- Supply-side Trends
- Technology Roadmap Analysis
- Analysis and Recommendations
- Market Overview
- Market Coverage / Taxonomy
- Market Definition / Scope / Limitations
- Research Methodology
- Chapter Orientation
- Analytical Lens and Working Hypotheses
- Market Sizing, Forecasting, and Opportunity Mapping
- Research Design and Evidence Framework
- Desk Research Programme (Secondary Evidence)
- Company Annual and Sustainability Reports
- Peer-reviewed Journals and Academic Literature
- Corporate Websites, Product Literature, and Technical Notes
- Earnings Decks and Investor Briefings
- Statutory Filings and Regulatory Disclosures
- Technical White Papers and Standards Notes
- Trade Journals, Industry Magazines, and Analyst Briefs
- Conference Proceedings, Webinars, and Seminar Materials
- Government Statistics Portals and Public Data Releases
- Press Releases and Reputable Media Coverage
- Specialist Newsletters and Curated Briefings
- Sector Databases and Reference Repositories
- FMI Internal Proprietary Databases and Historical Market Datasets
- Subscription Datasets and Paid Sources
- Social Channels, Communities, and Digital Listening Inputs
- Additional Desk Sources
- Expert Input and Fieldwork (Primary Evidence)
- Primary Modes
- Qualitative Interviews and Expert Elicitation
- Quantitative Surveys and Structured Data Capture
- Blended Approach
- Why Primary Evidence is Used
- Field Techniques
- Interviews
- Surveys
- Focus Groups
- Observational and In-context Research
- Physicians and Other Healthcare Professionals
- Governance, Ethics, and Data Stewardship
- Research Ethics
- Data Integrity and Handling
- Primary Modes
- Tooling, Models, and Reference Databases
- Desk Research Programme (Secondary Evidence)
- Data Engineering and Model Build
- Data Acquisition and Ingestion
- Cleaning, Normalisation, and Verification
- Synthesis, Triangulation, and Analysis
- Quality Assurance and Audit Trail
- Market Background
- Market Dynamics
- Drivers
- Restraints
- Opportunity
- Trends
- Scenario Forecast
- Demand in Optimistic Scenario
- Demand in Likely Scenario
- Demand in Conservative Scenario
- Opportunity Map Analysis
- Product Life Cycle Analysis
- Supply Chain Analysis
- Investment Feasibility Matrix
- Value Chain Analysis
- PESTLE and Porter’s Analysis
- Regulatory Landscape
- Regional Parent Market Outlook
- Production and Consumption Statistics
- Import and Export Statistics
- Market Dynamics
- Global Market Analysis 2021 to 2025 and Forecast, 2026 to 2036
- Historical Market Size Value (USD Million) Analysis, 2021 to 2025
- Current and Future Market Size Value (USD Million) Projections, 2026 to 2036
- Y-o-Y Growth Trend Analysis
- Absolute $ Opportunity Analysis
- Global Market Pricing Analysis 2021 to 2025 and Forecast 2026 to 2036
- Global Market Analysis 2021 to 2025 and Forecast 2026 to 2036, By Form Factor
- Introduction / Key Findings
- Historical Market Size Value (USD Million) Analysis By Form Factor , 2021 to 2025
- Current and Future Market Size Value (USD Million) Analysis and Forecast By Form Factor , 2026 to 2036
- xSFP
- xCFP
- xCXP
- XFP Transceivers
- xSFP
- Y-o-Y Growth Trend Analysis By Form Factor , 2021 to 2025
- Absolute $ Opportunity Analysis By Form Factor , 2026 to 2036
- Global Market Analysis 2021 to 2025 and Forecast 2026 to 2036, By Data Rate
- Introduction / Key Findings
- Historical Market Size Value (USD Million) Analysis By Data Rate, 2021 to 2025
- Current and Future Market Size Value (USD Million) Analysis and Forecast By Data Rate, 2026 to 2036
- Less than 10G
- 25G to 40G
- 50G to 100G
- 200G to 400G
- 800G Transceivers
- Less than 10G
- Y-o-Y Growth Trend Analysis By Data Rate, 2021 to 2025
- Absolute $ Opportunity Analysis By Data Rate, 2026 to 2036
- Global Market Analysis 2021 to 2025 and Forecast 2026 to 2036, By Application
- Introduction / Key Findings
- Historical Market Size Value (USD Million) Analysis By Application, 2021 to 2025
- Current and Future Market Size Value (USD Million) Analysis and Forecast By Application, 2026 to 2036
- Data Centers
- Media
- IT & Telecom
- Healthcare
- Energy & Power
- Industrial
- Data Centers
- Y-o-Y Growth Trend Analysis By Application, 2021 to 2025
- Absolute $ Opportunity Analysis By Application, 2026 to 2036
- Global Market Analysis 2021 to 2025 and Forecast 2026 to 2036, By Connector Type
- Introduction / Key Findings
- Historical Market Size Value (USD Million) Analysis By Connector Type, 2021 to 2025
- Current and Future Market Size Value (USD Million) Analysis and Forecast By Connector Type, 2026 to 2036
- LC Connector
- SC Connector
- MPO - MTP Connector
- Others
- LC Connector
- Y-o-Y Growth Trend Analysis By Connector Type, 2021 to 2025
- Absolute $ Opportunity Analysis By Connector Type, 2026 to 2036
- Global Market Analysis 2021 to 2025 and Forecast 2026 to 2036, By Region
- Introduction
- Historical Market Size Value (USD Million) Analysis By Region, 2021 to 2025
- Current Market Size Value (USD Million) Analysis and Forecast By Region, 2026 to 2036
- North America
- Latin America
- Western Europe
- Eastern Europe
- East Asia
- South Asia and Pacific
- Middle East & Africa
- Market Attractiveness Analysis By Region
- North America Market Analysis 2021 to 2025 and Forecast 2026 to 2036, By Country
- Historical Market Size Value (USD Million) Trend Analysis By Market Taxonomy, 2021 to 2025
- Market Size Value (USD Million) Forecast By Market Taxonomy, 2026 to 2036
- By Country
- USA
- Canada
- Mexico
- By Form Factor
- By Data Rate
- By Application
- By Connector Type
- By Country
- Market Attractiveness Analysis
- By Country
- By Form Factor
- By Data Rate
- By Application
- By Connector Type
- Key Takeaways
- Latin America Market Analysis 2021 to 2025 and Forecast 2026 to 2036, By Country
- Historical Market Size Value (USD Million) Trend Analysis By Market Taxonomy, 2021 to 2025
- Market Size Value (USD Million) Forecast By Market Taxonomy, 2026 to 2036
- By Country
- Brazil
- Chile
- Rest of Latin America
- By Form Factor
- By Data Rate
- By Application
- By Connector Type
- By Country
- Market Attractiveness Analysis
- By Country
- By Form Factor
- By Data Rate
- By Application
- By Connector Type
- Key Takeaways
- Western Europe Market Analysis 2021 to 2025 and Forecast 2026 to 2036, By Country
- Historical Market Size Value (USD Million) Trend Analysis By Market Taxonomy, 2021 to 2025
- Market Size Value (USD Million) Forecast By Market Taxonomy, 2026 to 2036
- By Country
- Germany
- UK
- Italy
- Spain
- France
- Nordic
- BENELUX
- Rest of Western Europe
- By Form Factor
- By Data Rate
- By Application
- By Connector Type
- By Country
- Market Attractiveness Analysis
- By Country
- By Form Factor
- By Data Rate
- By Application
- By Connector Type
- Key Takeaways
- Eastern Europe Market Analysis 2021 to 2025 and Forecast 2026 to 2036, By Country
- Historical Market Size Value (USD Million) Trend Analysis By Market Taxonomy, 2021 to 2025
- Market Size Value (USD Million) Forecast By Market Taxonomy, 2026 to 2036
- By Country
- Russia
- Poland
- Hungary
- Balkan & Baltic
- Rest of Eastern Europe
- By Form Factor
- By Data Rate
- By Application
- By Connector Type
- By Country
- Market Attractiveness Analysis
- By Country
- By Form Factor
- By Data Rate
- By Application
- By Connector Type
- Key Takeaways
- East Asia Market Analysis 2021 to 2025 and Forecast 2026 to 2036, By Country
- Historical Market Size Value (USD Million) Trend Analysis By Market Taxonomy, 2021 to 2025
- Market Size Value (USD Million) Forecast By Market Taxonomy, 2026 to 2036
- By Country
- China
- Japan
- South Korea
- By Form Factor
- By Data Rate
- By Application
- By Connector Type
- By Country
- Market Attractiveness Analysis
- By Country
- By Form Factor
- By Data Rate
- By Application
- By Connector Type
- Key Takeaways
- South Asia and Pacific Market Analysis 2021 to 2025 and Forecast 2026 to 2036, By Country
- Historical Market Size Value (USD Million) Trend Analysis By Market Taxonomy, 2021 to 2025
- Market Size Value (USD Million) Forecast By Market Taxonomy, 2026 to 2036
- By Country
- India
- ASEAN
- Australia & New Zealand
- Rest of South Asia and Pacific
- By Form Factor
- By Data Rate
- By Application
- By Connector Type
- By Country
- Market Attractiveness Analysis
- By Country
- By Form Factor
- By Data Rate
- By Application
- By Connector Type
- Key Takeaways
- Middle East & Africa Market Analysis 2021 to 2025 and Forecast 2026 to 2036, By Country
- Historical Market Size Value (USD Million) Trend Analysis By Market Taxonomy, 2021 to 2025
- Market Size Value (USD Million) Forecast By Market Taxonomy, 2026 to 2036
- By Country
- Kingdom of Saudi Arabia
- Other GCC Countries
- Turkiye
- South Africa
- Other African Union
- Rest of Middle East & Africa
- By Form Factor
- By Data Rate
- By Application
- By Connector Type
- By Country
- Market Attractiveness Analysis
- By Country
- By Form Factor
- By Data Rate
- By Application
- By Connector Type
- Key Takeaways
- Key Countries Market Analysis
- USA
- Pricing Analysis
- Market Share Analysis, 2025
- By Form Factor
- By Data Rate
- By Application
- By Connector Type
- Canada
- Pricing Analysis
- Market Share Analysis, 2025
- By Form Factor
- By Data Rate
- By Application
- By Connector Type
- Mexico
- Pricing Analysis
- Market Share Analysis, 2025
- By Form Factor
- By Data Rate
- By Application
- By Connector Type
- Brazil
- Pricing Analysis
- Market Share Analysis, 2025
- By Form Factor
- By Data Rate
- By Application
- By Connector Type
- Chile
- Pricing Analysis
- Market Share Analysis, 2025
- By Form Factor
- By Data Rate
- By Application
- By Connector Type
- Germany
- Pricing Analysis
- Market Share Analysis, 2025
- By Form Factor
- By Data Rate
- By Application
- By Connector Type
- UK
- Pricing Analysis
- Market Share Analysis, 2025
- By Form Factor
- By Data Rate
- By Application
- By Connector Type
- Italy
- Pricing Analysis
- Market Share Analysis, 2025
- By Form Factor
- By Data Rate
- By Application
- By Connector Type
- Spain
- Pricing Analysis
- Market Share Analysis, 2025
- By Form Factor
- By Data Rate
- By Application
- By Connector Type
- France
- Pricing Analysis
- Market Share Analysis, 2025
- By Form Factor
- By Data Rate
- By Application
- By Connector Type
- India
- Pricing Analysis
- Market Share Analysis, 2025
- By Form Factor
- By Data Rate
- By Application
- By Connector Type
- ASEAN
- Pricing Analysis
- Market Share Analysis, 2025
- By Form Factor
- By Data Rate
- By Application
- By Connector Type
- Australia & New Zealand
- Pricing Analysis
- Market Share Analysis, 2025
- By Form Factor
- By Data Rate
- By Application
- By Connector Type
- China
- Pricing Analysis
- Market Share Analysis, 2025
- By Form Factor
- By Data Rate
- By Application
- By Connector Type
- Japan
- Pricing Analysis
- Market Share Analysis, 2025
- By Form Factor
- By Data Rate
- By Application
- By Connector Type
- South Korea
- Pricing Analysis
- Market Share Analysis, 2025
- By Form Factor
- By Data Rate
- By Application
- By Connector Type
- Russia
- Pricing Analysis
- Market Share Analysis, 2025
- By Form Factor
- By Data Rate
- By Application
- By Connector Type
- Poland
- Pricing Analysis
- Market Share Analysis, 2025
- By Form Factor
- By Data Rate
- By Application
- By Connector Type
- Hungary
- Pricing Analysis
- Market Share Analysis, 2025
- By Form Factor
- By Data Rate
- By Application
- By Connector Type
- Kingdom of Saudi Arabia
- Pricing Analysis
- Market Share Analysis, 2025
- By Form Factor
- By Data Rate
- By Application
- By Connector Type
- Turkiye
- Pricing Analysis
- Market Share Analysis, 2025
- By Form Factor
- By Data Rate
- By Application
- By Connector Type
- South Africa
- Pricing Analysis
- Market Share Analysis, 2025
- By Form Factor
- By Data Rate
- By Application
- By Connector Type
- USA
- Market Structure Analysis
- Competition Dashboard
- Competition Benchmarking
- Market Share Analysis of Top Players
- By Regional
- By Form Factor
- By Data Rate
- By Application
- By Connector Type
- Competition Analysis
- Competition Deep Dive
- II-VI Incorporated
- Overview
- Product Portfolio
- Profitability by Market Segments (Product/Age /Sales Channel/Region)
- Sales Footprint
- Strategy Overview
- Marketing Strategy
- Product Strategy
- Channel Strategy
- Lumentum Holdings Inc.
- Broadcom Inc.
- InnoLight Technology
- Accelink Technologies
- Hisense Broadband
- II-VI Incorporated
- Competition Deep Dive
- Assumptions & Acronyms Used


