Optical Grade Lithium Tantalate Wafers Market Forecast and Outlook (2025-2035)

The optical grade lithium tantalate wafers market, valued at USD 807.7 million in 2025 and projected to reach USD 1,184.1 million by 2035 at a CAGR of 3.9%, exhibits measurable growth when analyzed across half-decade periods. From 2025 to 2030, the market shows an incremental increase from USD 807.7 million to approximately USD 941.2 million. This half-decade growth block captures early-stage adoption, reflecting rising demand in electronics, photonics, and piezoelectric applications. Annual increments during this period average around 3.8–4.0%, highlighting a steady momentum while manufacturers optimize wafer production and distribution to accommodate rising industrial requirements.
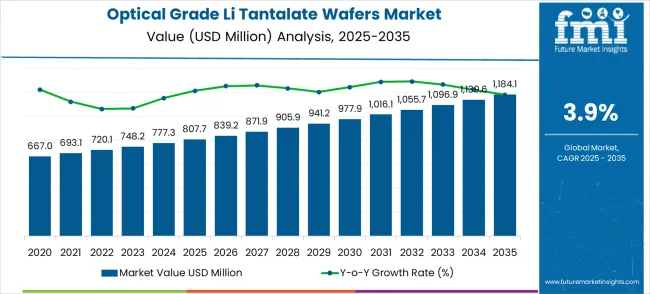
Quick Stats for Optical Grade Lithium Tantalate Wafers Market

  • Optical Grade Lithium Tantalate Wafers Market Value (2025): USD 807.7 million
  • Optical Grade Lithium Tantalate Wafers Market Forecast Value (2035): USD 1,184.1 million
  • Optical Grade Lithium Tantalate Wafers Market Forecast CAGR: 3.9%
  • Leading Classification Type in Optical Grade Lithium Tantalate Wafers Market: 6 Inches Wafers (42.0%)
  • Key Growth Regions in Optical Grade Lithium Tantalate Wafers Market: China, India, and Germany
  • Top Key Players in Optical Grade Lithium Tantalate Wafers Market: Sumitomo Metal Mining, Shin-Etsu Chemical, Koike, Korth Kristalle, Tiantong, Kaiju Technology Co., Ltd., Zhejiang MTCN Technology Co., Ltd., HEFEI KEJING MATERIALS TECHNOLOGY CO., LTD., Suzhou Nanzhi Core Materials Technology Co., Ltd., Hyperion Optics, Advanced Fiber Resources(Zhuhai), Ltd., Bon-tek

Optical Grade Li Tantalate Wafers Market Market Value Analysis

Optical Grade Lithium Tantalate Wafers Market Key Takeaways

Metric Value
Market Value (2025) USD 807.7 million
Market Forecast Value (2035) USD 1,184.1 million
Forecast CAGR (2025–2035) 3.9%

In the mid-decade phase from 2030 to 2035, revenues expand from USD 941.2 million to USD 1,184.1 million, demonstrating a higher absolute growth contribution relative to the earlier half-decade. Growth during this period is supported by increased deployment of lithium tantalate wafers in telecommunications, sensor technology, and advanced electronic devices. The weighted growth emphasizes the compounding effect of technology adoption across multiple sectors. Annual increments in this second half-decade average 3.9%, reflecting consistent market penetration, improved production efficiency, and broader industrial acceptance of high-performance wafers.

Analyzing the half-decade weighted growth offers insights into the temporal distribution of value accumulation and market dynamics. Early adoption stages prioritize establishing supply chains, technological validation, and niche market penetration, whereas the latter half-decade shows acceleration in revenues due to scale-up, higher-volume contracts, and expanded end-use adoption. Stakeholders can leverage these half-decade growth insights for strategic planning, aligning production capacity, R&D investment, and distribution strategies to capitalize on periods of maximum revenue contribution within the forecast horizon. This phased approach ensures optimized market positioning and sustainable growth across the 2025–2035 period.

Why is the Optical Grade Lithium Tantalate Wafers Market Growing?

Market expansion is being supported by the rapid telecommunications infrastructure development across global economies and the corresponding need for high-performance optical components in 5G communication systems, data centers, and advanced photonic applications. Modern telecommunications operations require superior optical materials with exceptional electro-optical properties to ensure optimal signal transmission and processing performance. The excellent optical, piezoelectric, and electro-optical characteristics of lithium tantalate make it an essential material in demanding applications where high-frequency performance and optical signal integrity are critical.

The growing emphasis on high-speed data transmission and network performance optimization is driving demand for advanced optical materials from certified manufacturers with proven track records of quality and consistency. Equipment manufacturers are increasingly investing in premium-grade wafer materials that offer superior optical properties and reliable performance over extended service periods. Technology requirements and performance standards are establishing material benchmarks that favor high-purity lithium tantalate solutions with advanced crystal properties and precise dimensional control.

Segmental Analysis

The market is segmented by wafer size, application, and region. By wafer diameter, the market is divided into 4 inches, 6 inches, 8 inches, and 12 inches configurations. Based on application, the market is categorized into 5G communication systems, optoelectronic devices, SAW (Surface Acoustic Wave) filters, and other optical applications. Regionally, the market is divided into North America, Europe, East Asia, South Asia & Pacific, Latin America, and Middle East & Africa.
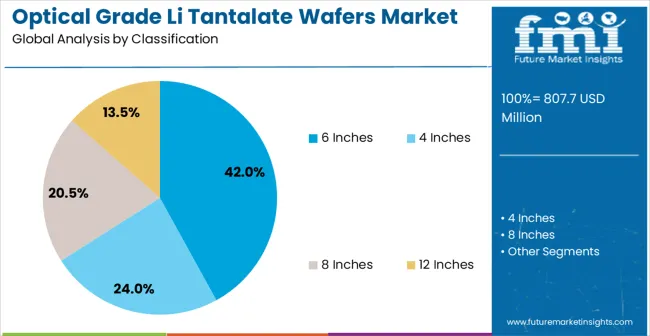
By Wafer Size, 6 Inches Segment Accounts for 42% Market Share

Optical Grade Li Tantalate Wafers Market Analysis By Classification

The 6-inch lithium tantalate wafer segment is projected to capture 42% of the optical grade lithium tantalate wafers market in 2025, securing a leading position. This dominance is driven by the optimal balance between manufacturing efficiency and device performance that 6-inch wafers provide for optical and telecommunications applications. These wafers offer cost-effectiveness for medium to high-volume production while maintaining superior optical properties, crystal uniformity, and structural integrity, making them suitable for 5G communication equipment, optical modulators, and advanced photonic devices. Technological advances in crystal growth, surface polishing, and quality control have improved dimensional precision, material consistency, and production yield while minimizing waste. The telecommunications and optoelectronics sectors are key demand drivers, as manufacturers require scalable, high-quality substrates for large-scale production. Integration of standardized processing and stringent quality control further reinforces the segment’s appeal, supporting consistent device performance, supply reliability, and cost-efficient manufacturing.
  • 6-inch wafers offer superior cost-efficiency, crystal uniformity, and optical performance for high-volume production.
  • Telecommunications and photonics sectors drive demand for scalable, high-quality substrates.

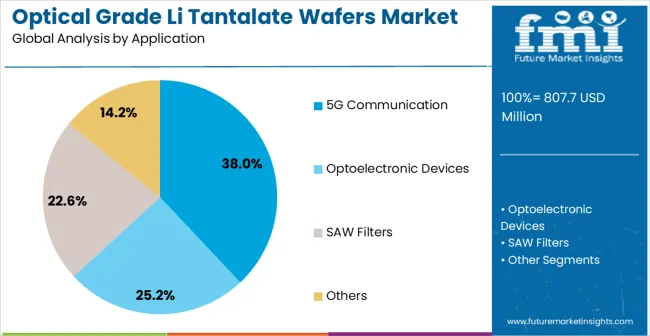
By Application, 5G Communication Segment Accounts for 38% Market Share

Optical Grade Li Tantalate Wafers Market Analysis By Application

The 5G communication segment is expected to represent 38% of optical grade lithium tantalate wafer demand in 2025, making it the largest application. This dominance is supported by the essential role of lithium tantalate in 5G infrastructure components, including electro-optical modulators, optical switches, and high-frequency signal processing devices. These applications require optical materials with exceptional electro-optical performance, high-frequency stability, and reliability under continuous operation. The global deployment of 5G networks, combined with increasing requirements for advanced optical components, drives consistent demand. Key markets in Asia-Pacific, North America, and Europe contribute substantially as network operators invest in next-generation communication infrastructure. Trends such as enhanced mobile broadband, IoT connectivity, private 5G networks, and edge computing create further opportunities for lithium tantalate components. Adoption is reinforced by the need for high-performance, reliable optical systems that ensure signal integrity, efficient network operation, and long-term performance.

  • 5G infrastructure adoption drives demand for high-frequency, electro-optical lithium tantalate components.
  • Edge computing and IoT connectivity increase requirements for advanced optical materials in communication networks.

What are the Drivers, Restraints, and Key Trends of the Optical Grade Lithium Tantalate Wafers Market?

The optical grade lithium tantalate wafers market is advancing steadily due to increasing telecommunications infrastructure development and growing recognition of advanced optical material importance in high-frequency applications. However, the market faces challenges including high material costs compared to alternative substrates, complex crystal growth processes requiring specialized expertise, and varying quality requirements across different optical applications. Standardization efforts and quality assurance programs continue to influence material specifications and market development patterns.

Integration of Advanced Crystal Growth and Quality Control Technologies

The growing implementation of sophisticated crystal growth systems and comprehensive quality control programs is enabling enhanced material purity, crystal uniformity, and optical property consistency in lithium tantalate wafer production. Advanced crystal growth techniques provide precise control over crystal orientation, defect density, and optical properties while ensuring material reliability and extended device lifetimes. These technologies are particularly important for high-performance applications requiring exceptional optical quality and material consistency across large wafer areas.

Development of Large-Diameter and Application-Specific Solutions

Modern wafer manufacturers are incorporating advanced processing technologies and specialized crystal orientations that optimize optical properties for specific device applications and enable larger wafer sizes for improved manufacturing efficiency. Integration of application-specific crystal cuts and customized surface preparation enables enhanced device performance and significant cost advantages compared to standard wafer configurations. Advanced processing techniques and quality control systems also support development of ultra-low-loss wafers for demanding photonic applications requiring exceptional optical transparency and surface quality.
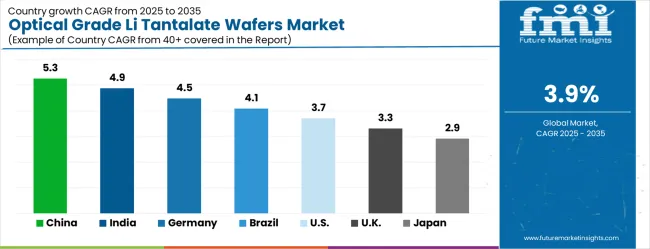
Analysis of Optical Grade Lithium Tantalate Wafers Market by Key Country

Optical Grade Li Tantalate Wafers Market Cagr Analysis By Country

Country CAGR (2025–2035)
China 5.3%
India 4.9%
Germany 4.5%
Brazil 4.1%
United States 3.7%
United Kingdom 3.3%
Japan 2.9%

The optical grade lithium tantalate wafers market is growing rapidly, with China leading at a 5.3% CAGR through 2035, driven by massive telecommunications infrastructure expansion, 5G network deployment, and photonics industry development. India follows at 4.9%, supported by rising telecommunications modernization and increasing investments in optical communication infrastructure. Germany records strong growth at 4.5%, emphasizing precision optics manufacturing, quality standards, and advanced photonics capabilities. Brazil grows steadily at 4.1%, integrating optical components into expanding telecommunications and data center operations. The United States shows moderate growth at 3.7%, focusing on technology innovation and next-generation optical system development. The United Kingdom maintains steady expansion at 3.3%, supported by photonics research and telecommunications modernization programs. Japan demonstrates stable growth at 2.9%, emphasizing technological innovation and precision optical component manufacturing.

The report covers an in-depth analysis of 40+ countries top-performing countries are highlighted below.

China Leads Global Market Growth with Infrastructure Expansion

Revenue from optical grade lithium tantalate wafers systems in China is projected to grow at a CAGR of 5.3% through 2035, driven by rapid telecommunications infrastructure expansion and large-scale 5G deployment across metropolitan areas. The growing photonics industry and expanding optical communication equipment manufacturing are creating significant demand for high-quality lithium tantalate substrates. Major equipment manufacturers are implementing comprehensive wafer procurement programs to meet production and performance requirements. Government modernization programs and sector initiatives promote adoption of advanced optical materials, enhancing substrate reliability and electro-optical performance. Combined efforts support large-scale system deployment, optimal network performance, and integration of specialized wafer materials into high-demand telecommunications and photonics applications nationwide.

  • Telecommunications modernization programs drive demand for high-performance substrates.
  • 5G network expansion creates opportunities for specialized wafer applications.

India Demonstrates Strong Market Potential with Telecommunications Growth

Revenue from optical grade lithium tantalate wafers systems in India is projected to expand at a CAGR of 4.9% through 2035, supported by telecommunications infrastructure modernization and growing investments in optical network development. The country’s expanding photonics and telecom equipment industries are driving demand for premium optical substrates that enable advanced device fabrication. Technology facilities are adopting high-quality wafer materials to improve device performance and meet international standards. Growth initiatives in telecom modernization and optical technology development are creating opportunities for advanced substrate adoption. Investment in reliable optical materials ensures enhanced network efficiency, reduced signal loss, and improved system durability, fostering adoption across major technology centers and strengthening India’s position in global photonics and telecommunications markets.

  • Infrastructure modernization and telecom expansion drive optical material demand.
  • Technology development programs encourage adoption of premium wafer substrates.

Germany Maintains Leadership with Precision Optics Excellence

Demand for optical grade lithium tantalate wafers systems in Germany is projected to grow at a CAGR of 4.5% through 2035, supported by the country’s emphasis on precision optics manufacturing and advanced photonics capabilities. Optical equipment facilities are implementing high-quality substrate materials that meet stringent performance and optical quality standards. The market is characterized by focus on precision, material reliability, and compliance with industrial quality regulations. Photonics investments prioritize advanced optical materials to optimize device performance, reduce losses, and enhance manufacturing efficiency. Research and development initiatives support next-generation fiber and photonic systems, ensuring high-performance wafer integration. Germany’s approach strengthens technological innovation, quality assurance, and sustained adoption of high-grade optical substrates.

  • Photonics investments prioritize advanced materials with superior performance.
  • Precision manufacturing programs support high-grade substrate adoption.

Brazil Expands Market with Telecommunications and Data Centre Development

Revenue from optical grade lithium tantalate wafers systems in Brazil is projected to grow at a CAGR of 4.1% through 2035, driven by expanding telecommunications networks and data center development. The country’s developing optical communication sector is investing in advanced substrate materials to improve network performance, reliability, and service quality. Technology facilities are adopting high-quality optical materials to support increasing connectivity requirements. Infrastructure modernization and telecom growth initiatives promote the integration of premium substrates in critical network components. Adoption of high-performance wafer materials ensures reduced optical losses, enhanced signal fidelity, and scalable network deployment. Combined efforts support the evolution of Brazil’s telecommunications and data center ecosystems with reliable, performance-focused optical solutions.

  • Telecom expansion and data center growth facilitate high-quality substrate adoption.
  • Infrastructure modernization drives demand for reliable optical materials.

United States Focuses on Technology Innovation and Advanced Systems

Revenue from optical grade lithium tantalate wafers systems in the USA is projected to grow at a CAGR of 3.7% through 2035, driven by technology innovation and emphasis on next-generation optical system development. Photonics and telecommunications facilities are upgrading substrate materials for improved performance, reduced system costs, and compliance with rigorous standards. R&D and technology advancement programs encourage adoption of premium substrates that enhance device reliability and efficiency. The market benefits from integration of high-performance materials in critical communication and research applications. Adoption of advanced lithium tantalate wafers supports superior electro-optical properties, cost-effective production, and long-term system scalability across multiple photonics and telecom sectors in the United States.

  • Technology innovation programs drive adoption of premium optical substrates.
  • Photonics research initiatives support advanced system development and reliability.

United Kingdom Emphasizes Photonics Research and Telecommunications Programs

Revenue from optical grade lithium tantalate wafers systems in the UK is projected to grow at a CAGR of 3.3% through 2035, supported by photonics research programs and telecommunications modernization initiatives. Research institutions and technology companies are investing in high-quality optical materials for consistent performance in experimental and industrial applications. Focus on material reliability, research quality, and compliance with academic and industrial standards drives adoption of premium wafers. Expansion of optical system development programs creates demand for specialized substrates in advanced photonics applications. Combined efforts ensure improved system performance, reproducibility, and reliability, fostering integration into both research and commercial telecommunications environments throughout the UK
  • Photonics research and telecom modernization promote adoption of advanced materials.
  • Technology research programs create demand for reliable optical substrates.

Japan Demonstrates Technological Innovation Leadership

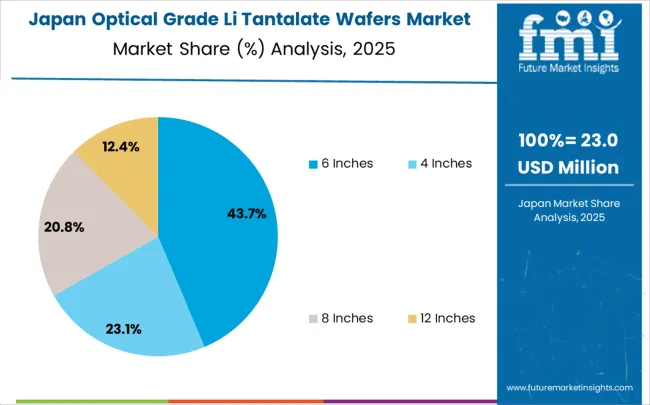
Optical Grade Li Tantalate Wafers Market Japan Market Share Analysis By Classification

Demand for optical grade lithium tantalate wafers systems in Japan is projected to grow at a CAGR of 2.9% through 2035, driven by technological innovation and precision optical manufacturing excellence. Japanese manufacturers are developing advanced optical devices using high-quality substrates with superior reliability and performance. Investments in continuous improvement and precision manufacturing enhance optical system efficiency, reduce losses, and optimize device functionality. Adoption of premium lithium tantalate wafers supports high-performance applications in photonics, telecommunications, and advanced instrumentation. Technology research programs and manufacturing excellence initiatives strengthen Japan’s position in precision optics, ensuring consistent quality, material reliability, and integration of advanced substrates across optical and communication systems.
  • Manufacturing excellence and innovation drive advanced optical system development.
  • Precision programs support adoption of premium substrates for high-performance devices.

Europe Market Split by Country

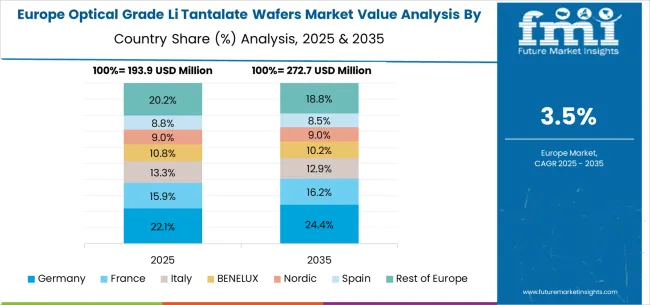
Optical Grade Li Tantalate Wafers Market Europe Country Market Share Analysis, 2025 & 2035

The optical grade lithium tantalate wafers market in Europe is projected to grow from USD 218.0 million in 2025 to USD 319.7 million by 2035, registering a CAGR of 3.9% over the forecast period. Germany is expected to maintain its leadership with a 32.1% share in 2025, supported by its strong photonics base and advanced optical manufacturing infrastructure. The United Kingdom follows with 18.3% market share, driven by photonics research and telecommunications development programs. France holds 15.6% of the European market, benefiting from optical technology investments and telecommunications modernization. Italy and Spain collectively represent 21.0% of regional demand, with growing focus on photonics and optical communication applications. The Rest of Europe region accounts for 13.0% of the market, supported by technology development in Eastern European countries and Nordic research institutions.
Competitive Landscape of Optical Grade Lithium Tantalate Wafers Market

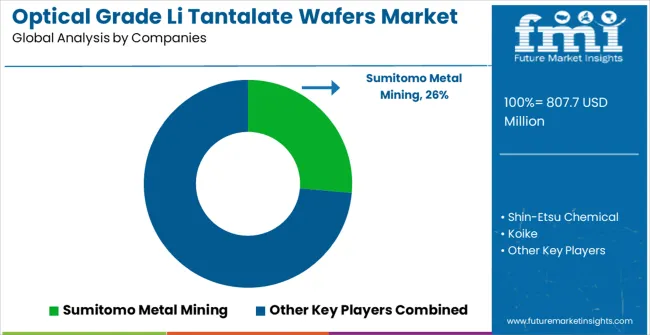
Optical Grade Li Tantalate Wafers Market Analysis By Company

Competition in the optical grade lithium tantalate wafers market is defined by established materials manufacturers, specialized crystal producers, and technology-driven wafer suppliers. Sumitomo Metal Mining provides high-purity wafers with emphasis on optical performance, consistency, and reliability. Shin-Etsu Chemical delivers advanced lithium tantalate crystals with focus on precision, defect control, and material uniformity. Koike supplies wafers optimized for optical and piezoelectric applications with stringent quality standards. Korth Kristalle offers specialized crystal solutions with attention to purity, lattice structure, and performance stability.

Differentiation in the market is achieved through crystal quality, defect minimization, and process sophistication. Tiantong Kaiju Technology Co., Ltd. produces wafers with focus on advanced polishing techniques and dimensional consistency. Zhejiang MTCN Technology Co., Ltd. emphasizes high-performance materials for telecommunications and precision electronics. HEFEI KEJING MATERIALS TECHNOLOGY CO., LTD. delivers wafers tailored for piezoelectric and optical applications with validated performance. Suzhou Nanzhi Core Materials Technology Co., Ltd. applies rigorous quality assurance and process control to support reliable wafer production.

Additional players such as Hyperion Optics, Advanced Fiber Resources (Zhuhai), Ltd., and Bon-tek provide specialized crystal solutions, focusing on purity, uniformity, and regional supply capabilities. Product brochures highlight crystal orientation, optical transmittance, defect density, and dimensional accuracy. Technical specifications, material performance data, and application suitability are emphasized to reinforce trustworthiness. Each brochure functions as a demonstration of wafer quality, operational reliability, and competitive differentiation, collectively illustrating the market dynamics and strategic positioning of optical grade lithium tantalate wafer suppliers.

Global Optical Grade Lithium Tantalate Wafers Market -- Stakeholder Contribution Framework

The optical grade lithium tantalate wafers market underpins telecommunications advancement, photonics innovation, optical system performance, and next-generation communication technologies. With performance mandates, stricter quality requirements, and demand for high-frequency optical components, the sector must balance cost competitiveness, material quality, and technological advancement. Coordinated contributions from governments, industry bodies, manufacturers/suppliers, research institutions, and investors will accelerate the transition toward high-performance, quality-assured, and cost-effective lithium tantalate wafer solutions.

How Governments Could Spur Market Growth and Adoption

  • Technology Development Incentives: Provide subsidies or tax credits for companies adopting advanced optical materials or investing in high-performance lithium tantalate-based systems.
  • Standards Development: Establish quality standards, performance benchmarks, and testing protocols, boosting confidence in telecommunications, photonics, and optical system sectors.
  • Infrastructure Programs: Embed advanced optical components into 5G deployment initiatives, data center upgrades, and national broadband expansion projects.
  • Trade Facilitation: Lower tariffs for importing crystal growth equipment and quality testing systems while supporting local exports of high-grade optical materials.
  • Research Support: Recognize advanced optical materials within national technology development and innovation frameworks.

How Industry Bodies Could Support Market Development

  • Standardization & Quality Assurance: Develop harmonized guidelines for wafer specifications, optical property testing, and quality certification.
  • Technical Education: Create curricula for crystal growth, wafer processing, and optical characterization to reduce skill shortages.
  • Technology Promotion: Position regional manufacturers as leaders in high-quality and technologically advanced optical materials.
  • Market Advocacy: Engage with equipment manufacturers to promote adoption of lithium tantalate solutions in next-generation optical systems.

How Manufacturers and Suppliers Could Strengthen the Ecosystem

  • Technology Integration: Embed advanced crystal growth, quality monitoring, and characterization systems into production operations.
  • Application Development: Collaborate with telecommunications and photonics industries to design application-optimized wafer specifications.
  • Innovation Focus: Advance crystal growth technologies, surface processing techniques, and quality control capabilities.
  • Complete Solutions: Bundle wafers with technical support or device fabrication services, offering end-to-end optical material solutions.

How Research Institutions Could Navigate Opportunities

  • Material Science Research: Advance understanding of lithium tantalate properties, processing techniques, and performance optimization methods.
  • Application Development: Establish research partnerships with industry to develop new applications and device architectures.
  • Technology Transfer: Facilitate commercialization of research discoveries through industry collaboration and licensing programs.
  • Talent Development: Build expertise via advanced degree programs, research fellowships, and industry collaboration opportunities.

How Investors and Financial Enablers Could Unlock Value

  • Infrastructure Financing: Fund crystal growth facilities, quality testing laboratories, and research centers in high-growth markets (China, India, Germany).
  • Technology Finance: Channel innovation-linked capital toward advanced crystal growth and processing technologies.
  • M&A and Consolidation: Back strategic acquisitions to integrate specialized crystal growers into comprehensive optical material suppliers.
  • Research Funding: Support startups developing novel crystal growth techniques, specialized processing methods, or advanced characterization systems.
  • Supply Chain Tools: Provide financing and risk management products for raw material procurement and international supply chain optimization.

Key Players in the Optical Grade Lithium Tantalate Wafers Market

  • Sumitomo Metal Mining
  • Shin-Etsu Chemical
  • Koike
  • Korth Kristalle
  • Tiantong Kaiju Technology Co., Ltd.
  • Zhejiang MTCN Technology Co., Ltd.
  • HEFEI KEJING MATERIALS TECHNOLOGY CO., LTD.
  • Suzhou Nanzhi Core Materials Technology Co., Ltd.
  • Hyperion Optics
  • Advanced Fiber Resources(Zhuhai),Ltd.
  • Bon-tek

Scope of the Report

Item Value
Quantitative Units USD 807.7 Million
Classification Type 4 Inches, 6 Inches, 8 Inches, 12 Inches
Application 5G Communication, Optoelectronic Devices, SAW Filters, Others
Regions Covered North America, Europe, East Asia, South Asia & Pacific, Latin America, Middle East & Africa
Country Covered United States, Germany, India, China, United Kingdom, Japan, Brazil, and other 40+ countries
Key Companies Profiled Sumitomo Metal Mining, Shin-Etsu Chemical, Koike, Korth Kristalle, Tiantong Kaiju Technology Co., Ltd., Zhejiang MTCN Technology Co., Ltd., HEFEI KEJING MATERIALS TECHNOLOGY CO., LTD., Suzhou Nanzhi Core Materials Technology Co., Ltd., Hyperion Optics, Advanced Fiber Resources(Zhuhai),Ltd., Bon-tek
Additional Attributes Dollar sales by wafer size and application, regional demand trends across North America, Europe, and Asia-Pacific, competitive landscape with established crystal growers and emerging suppliers, buyer preferences for different wafer sizes and crystal orientations, integration with advanced optical device fabrication technologies, innovations in crystal growth and wafer processing for enhanced optical quality and dimensional precision, and adoption of specialized wafer specifications with optimized electro-optical properties for high-performance telecommunications and photonics applications.

Optical Grade Lithium Tantalate Wafers Market by Segments

Wafer Size:

  • 4 Inches
  • 6 Inches
  • 8 Inches
  • 12 Inches

Application:

  • 5G Communication
  • Optoelectronic Devices
  • SAW Filters
  • Others

Region:

  • North America
    • United States
    • Canada
    • Mexico
  • Europe
    • Germany
    • United Kingdom
    • France
    • Italy
    • Spain
    • Nordic
    • BENELUX
    • Rest of Europe
  • East Asia
    • China
    • Japan
    • South Korea
  • South Asia & Pacific
    • India
    • ASEAN
    • Australia & New Zealand
    • Rest of South Asia & Pacific
  • Latin America
    • Brazil
    • Chile
    • Rest of Latin America
  • Middle East & Africa
    • Kingdom of Saudi Arabia
    • Other GCC Countries
    • Turkey
    • South Africa
    • Other African Union
    • Rest of Middle East & Africa

Table of Content

  1. Executive Summary
    • Global Market Outlook
    • Demand to side Trends
    • Supply to side Trends
    • Technology Roadmap Analysis
    • Analysis and Recommendations
  2. Market Overview
    • Market Coverage / Taxonomy
    • Market Definition / Scope / Limitations
  3. Market Background
    • Market Dynamics
      • Drivers
      • Restraints
      • Opportunity
      • Trends
    • Scenario Forecast
      • Demand in Optimistic Scenario
      • Demand in Likely Scenario
      • Demand in Conservative Scenario
    • Opportunity Map Analysis
    • Product Life Cycle Analysis
    • Supply Chain Analysis
    • Investment Feasibility Matrix
    • Value Chain Analysis
    • PESTLE and Porter’s Analysis
    • Regulatory Landscape
    • Regional Parent Market Outlook
    • Production and Consumption Statistics
    • Import and Export Statistics
  4. Global Market Analysis 2020 to 2024 and Forecast, 2025 to 2035
    • Historical Market Size Value (USD Million) Analysis, 2020 to 2024
    • Current and Future Market Size Value (USD Million) Projections, 2025 to 2035
      • Y to o to Y Growth Trend Analysis
      • Absolute $ Opportunity Analysis
  5. Global Market Pricing Analysis 2020 to 2024 and Forecast 2025 to 2035
  6. Global Market Analysis 2020 to 2024 and Forecast 2025 to 2035, By Classification
    • Introduction / Key Findings
    • Historical Market Size Value (USD Million) Analysis By Classification , 2020 to 2024
    • Current and Future Market Size Value (USD Million) Analysis and Forecast By Classification , 2025 to 2035
      • 6 Inches
      • 4 Inches
      • 8 Inches
      • 12 Inches
    • Y to o to Y Growth Trend Analysis By Classification , 2020 to 2024
    • Absolute $ Opportunity Analysis By Classification , 2025 to 2035
  7. Global Market Analysis 2020 to 2024 and Forecast 2025 to 2035, By Application
    • Introduction / Key Findings
    • Historical Market Size Value (USD Million) Analysis By Application, 2020 to 2024
    • Current and Future Market Size Value (USD Million) Analysis and Forecast By Application, 2025 to 2035
      • 5G Communication
      • Optoelectronic Devices
      • SAW Filters
      • Others
    • Y to o to Y Growth Trend Analysis By Application, 2020 to 2024
    • Absolute $ Opportunity Analysis By Application, 2025 to 2035
  8. Global Market Analysis 2020 to 2024 and Forecast 2025 to 2035, By Region
    • Introduction
    • Historical Market Size Value (USD Million) Analysis By Region, 2020 to 2024
    • Current Market Size Value (USD Million) Analysis and Forecast By Region, 2025 to 2035
      • North America
      • Latin America
      • Western Europe
      • Eastern Europe
      • East Asia
      • South Asia and Pacific
      • Middle East & Africa
    • Market Attractiveness Analysis By Region
  9. North America Market Analysis 2020 to 2024 and Forecast 2025 to 2035, By Country
    • Historical Market Size Value (USD Million) Trend Analysis By Market Taxonomy, 2020 to 2024
    • Market Size Value (USD Million) Forecast By Market Taxonomy, 2025 to 2035
      • By Country
        • USA
        • Canada
        • Mexico
      • By Classification
      • By Application
    • Market Attractiveness Analysis
      • By Country
      • By Classification
      • By Application
    • Key Takeaways
  10. Latin America Market Analysis 2020 to 2024 and Forecast 2025 to 2035, By Country
    • Historical Market Size Value (USD Million) Trend Analysis By Market Taxonomy, 2020 to 2024
    • Market Size Value (USD Million) Forecast By Market Taxonomy, 2025 to 2035
      • By Country
        • Brazil
        • Chile
        • Rest of Latin America
      • By Classification
      • By Application
    • Market Attractiveness Analysis
      • By Country
      • By Classification
      • By Application
    • Key Takeaways
  11. Western Europe Market Analysis 2020 to 2024 and Forecast 2025 to 2035, By Country
    • Historical Market Size Value (USD Million) Trend Analysis By Market Taxonomy, 2020 to 2024
    • Market Size Value (USD Million) Forecast By Market Taxonomy, 2025 to 2035
      • By Country
        • Germany
        • UK
        • Italy
        • Spain
        • France
        • Nordic
        • BENELUX
        • Rest of Western Europe
      • By Classification
      • By Application
    • Market Attractiveness Analysis
      • By Country
      • By Classification
      • By Application
    • Key Takeaways
  12. Eastern Europe Market Analysis 2020 to 2024 and Forecast 2025 to 2035, By Country
    • Historical Market Size Value (USD Million) Trend Analysis By Market Taxonomy, 2020 to 2024
    • Market Size Value (USD Million) Forecast By Market Taxonomy, 2025 to 2035
      • By Country
        • Russia
        • Poland
        • Hungary
        • Balkan & Baltic
        • Rest of Eastern Europe
      • By Classification
      • By Application
    • Market Attractiveness Analysis
      • By Country
      • By Classification
      • By Application
    • Key Takeaways
  13. East Asia Market Analysis 2020 to 2024 and Forecast 2025 to 2035, By Country
    • Historical Market Size Value (USD Million) Trend Analysis By Market Taxonomy, 2020 to 2024
    • Market Size Value (USD Million) Forecast By Market Taxonomy, 2025 to 2035
      • By Country
        • China
        • Japan
        • South Korea
      • By Classification
      • By Application
    • Market Attractiveness Analysis
      • By Country
      • By Classification
      • By Application
    • Key Takeaways
  14. South Asia and Pacific Market Analysis 2020 to 2024 and Forecast 2025 to 2035, By Country
    • Historical Market Size Value (USD Million) Trend Analysis By Market Taxonomy, 2020 to 2024
    • Market Size Value (USD Million) Forecast By Market Taxonomy, 2025 to 2035
      • By Country
        • India
        • ASEAN
        • Australia & New Zealand
        • Rest of South Asia and Pacific
      • By Classification
      • By Application
    • Market Attractiveness Analysis
      • By Country
      • By Classification
      • By Application
    • Key Takeaways
  15. Middle East & Africa Market Analysis 2020 to 2024 and Forecast 2025 to 2035, By Country
    • Historical Market Size Value (USD Million) Trend Analysis By Market Taxonomy, 2020 to 2024
    • Market Size Value (USD Million) Forecast By Market Taxonomy, 2025 to 2035
      • By Country
        • Kingdom of Saudi Arabia
        • Other GCC Countries
        • Turkiye
        • South Africa
        • Other African Union
        • Rest of Middle East & Africa
      • By Classification
      • By Application
    • Market Attractiveness Analysis
      • By Country
      • By Classification
      • By Application
    • Key Takeaways
  16. Key Countries Market Analysis
    • USA
      • Pricing Analysis
      • Market Share Analysis, 2024
        • By Classification
        • By Application
    • Canada
      • Pricing Analysis
      • Market Share Analysis, 2024
        • By Classification
        • By Application
    • Mexico
      • Pricing Analysis
      • Market Share Analysis, 2024
        • By Classification
        • By Application
    • Brazil
      • Pricing Analysis
      • Market Share Analysis, 2024
        • By Classification
        • By Application
    • Chile
      • Pricing Analysis
      • Market Share Analysis, 2024
        • By Classification
        • By Application
    • Germany
      • Pricing Analysis
      • Market Share Analysis, 2024
        • By Classification
        • By Application
    • UK
      • Pricing Analysis
      • Market Share Analysis, 2024
        • By Classification
        • By Application
    • Italy
      • Pricing Analysis
      • Market Share Analysis, 2024
        • By Classification
        • By Application
    • Spain
      • Pricing Analysis
      • Market Share Analysis, 2024
        • By Classification
        • By Application
    • France
      • Pricing Analysis
      • Market Share Analysis, 2024
        • By Classification
        • By Application
    • India
      • Pricing Analysis
      • Market Share Analysis, 2024
        • By Classification
        • By Application
    • ASEAN
      • Pricing Analysis
      • Market Share Analysis, 2024
        • By Classification
        • By Application
    • Australia & New Zealand
      • Pricing Analysis
      • Market Share Analysis, 2024
        • By Classification
        • By Application
    • China
      • Pricing Analysis
      • Market Share Analysis, 2024
        • By Classification
        • By Application
    • Japan
      • Pricing Analysis
      • Market Share Analysis, 2024
        • By Classification
        • By Application
    • South Korea
      • Pricing Analysis
      • Market Share Analysis, 2024
        • By Classification
        • By Application
    • Russia
      • Pricing Analysis
      • Market Share Analysis, 2024
        • By Classification
        • By Application
    • Poland
      • Pricing Analysis
      • Market Share Analysis, 2024
        • By Classification
        • By Application
    • Hungary
      • Pricing Analysis
      • Market Share Analysis, 2024
        • By Classification
        • By Application
    • Kingdom of Saudi Arabia
      • Pricing Analysis
      • Market Share Analysis, 2024
        • By Classification
        • By Application
    • Turkiye
      • Pricing Analysis
      • Market Share Analysis, 2024
        • By Classification
        • By Application
    • South Africa
      • Pricing Analysis
      • Market Share Analysis, 2024
        • By Classification
        • By Application
  17. Market Structure Analysis
    • Competition Dashboard
    • Competition Benchmarking
    • Market Share Analysis of Top Players
      • By Regional
      • By Classification
      • By Application
  18. Competition Analysis
    • Competition Deep Dive
      • Sumitomo Metal Mining
        • Overview
        • Product Portfolio
        • Profitability by Market Segments (Product/Age /Sales Channel/Region)
        • Sales Footprint
        • Strategy Overview
          • Marketing Strategy
          • Product Strategy
          • Channel Strategy
      • Shin-Etsu Chemical
      • Koike
      • Korth Kristalle
      • Tiantong Kaiju Technology Co., Ltd.
      • Zhejiang MTCN Technology Co., Ltd.
      • Hefei Kejing Materials Technology Co., Ltd.
      • Suzhou Nanzhi Core Materials Technology Co., Ltd.
      • Hyperion Optics
      • Advanced Fiber Resources (Zhuhai), Ltd.
      • Bon-tek
  19. Assumptions & Acronyms Used
  20. Research Methodology

List of Tables

  • Table 1: Global Market Value (USD Million) Forecast by Region, 2020 to 2035
  • Table 2: Global Market Value (USD Million) Forecast by Classification , 2020 to 2035
  • Table 3: Global Market Value (USD Million) Forecast by Application, 2020 to 2035
  • Table 4: North America Market Value (USD Million) Forecast by Country, 2020 to 2035
  • Table 5: North America Market Value (USD Million) Forecast by Classification , 2020 to 2035
  • Table 6: North America Market Value (USD Million) Forecast by Application, 2020 to 2035
  • Table 7: Latin America Market Value (USD Million) Forecast by Country, 2020 to 2035
  • Table 8: Latin America Market Value (USD Million) Forecast by Classification , 2020 to 2035
  • Table 9: Latin America Market Value (USD Million) Forecast by Application, 2020 to 2035
  • Table 10: Western Europe Market Value (USD Million) Forecast by Country, 2020 to 2035
  • Table 11: Western Europe Market Value (USD Million) Forecast by Classification , 2020 to 2035
  • Table 12: Western Europe Market Value (USD Million) Forecast by Application, 2020 to 2035
  • Table 13: Eastern Europe Market Value (USD Million) Forecast by Country, 2020 to 2035
  • Table 14: Eastern Europe Market Value (USD Million) Forecast by Classification , 2020 to 2035
  • Table 15: Eastern Europe Market Value (USD Million) Forecast by Application, 2020 to 2035
  • Table 16: East Asia Market Value (USD Million) Forecast by Country, 2020 to 2035
  • Table 17: East Asia Market Value (USD Million) Forecast by Classification , 2020 to 2035
  • Table 18: East Asia Market Value (USD Million) Forecast by Application, 2020 to 2035
  • Table 19: South Asia and Pacific Market Value (USD Million) Forecast by Country, 2020 to 2035
  • Table 20: South Asia and Pacific Market Value (USD Million) Forecast by Classification , 2020 to 2035
  • Table 21: South Asia and Pacific Market Value (USD Million) Forecast by Application, 2020 to 2035
  • Table 22: Middle East & Africa Market Value (USD Million) Forecast by Country, 2020 to 2035
  • Table 23: Middle East & Africa Market Value (USD Million) Forecast by Classification , 2020 to 2035
  • Table 24: Middle East & Africa Market Value (USD Million) Forecast by Application, 2020 to 2035

List of Figures

  • Figure 1: Global Market Pricing Analysis
  • Figure 2: Global Market Value (USD Million) Forecast 2020-2035
  • Figure 3: Global Market Value Share and BPS Analysis by Classification , 2025 and 2035
  • Figure 4: Global Market Y to o to Y Growth Comparison by Classification , 2025-2035
  • Figure 5: Global Market Attractiveness Analysis by Classification
  • Figure 6: Global Market Value Share and BPS Analysis by Application, 2025 and 2035
  • Figure 7: Global Market Y to o to Y Growth Comparison by Application, 2025-2035
  • Figure 8: Global Market Attractiveness Analysis by Application
  • Figure 9: Global Market Value (USD Million) Share and BPS Analysis by Region, 2025 and 2035
  • Figure 10: Global Market Y to o to Y Growth Comparison by Region, 2025-2035
  • Figure 11: Global Market Attractiveness Analysis by Region
  • Figure 12: North America Market Incremental Dollar Opportunity, 2025-2035
  • Figure 13: Latin America Market Incremental Dollar Opportunity, 2025-2035
  • Figure 14: Western Europe Market Incremental Dollar Opportunity, 2025-2035
  • Figure 15: Eastern Europe Market Incremental Dollar Opportunity, 2025-2035
  • Figure 16: East Asia Market Incremental Dollar Opportunity, 2025-2035
  • Figure 17: South Asia and Pacific Market Incremental Dollar Opportunity, 2025-2035
  • Figure 18: Middle East & Africa Market Incremental Dollar Opportunity, 2025-2035
  • Figure 19: North America Market Value Share and BPS Analysis by Country, 2025 and 2035
  • Figure 20: North America Market Value Share and BPS Analysis by Classification , 2025 and 2035
  • Figure 21: North America Market Y to o to Y Growth Comparison by Classification , 2025-2035
  • Figure 22: North America Market Attractiveness Analysis by Classification
  • Figure 23: North America Market Value Share and BPS Analysis by Application, 2025 and 2035
  • Figure 24: North America Market Y to o to Y Growth Comparison by Application, 2025-2035
  • Figure 25: North America Market Attractiveness Analysis by Application
  • Figure 26: Latin America Market Value Share and BPS Analysis by Country, 2025 and 2035
  • Figure 27: Latin America Market Value Share and BPS Analysis by Classification , 2025 and 2035
  • Figure 28: Latin America Market Y to o to Y Growth Comparison by Classification , 2025-2035
  • Figure 29: Latin America Market Attractiveness Analysis by Classification
  • Figure 30: Latin America Market Value Share and BPS Analysis by Application, 2025 and 2035
  • Figure 31: Latin America Market Y to o to Y Growth Comparison by Application, 2025-2035
  • Figure 32: Latin America Market Attractiveness Analysis by Application
  • Figure 33: Western Europe Market Value Share and BPS Analysis by Country, 2025 and 2035
  • Figure 34: Western Europe Market Value Share and BPS Analysis by Classification , 2025 and 2035
  • Figure 35: Western Europe Market Y to o to Y Growth Comparison by Classification , 2025-2035
  • Figure 36: Western Europe Market Attractiveness Analysis by Classification
  • Figure 37: Western Europe Market Value Share and BPS Analysis by Application, 2025 and 2035
  • Figure 38: Western Europe Market Y to o to Y Growth Comparison by Application, 2025-2035
  • Figure 39: Western Europe Market Attractiveness Analysis by Application
  • Figure 40: Eastern Europe Market Value Share and BPS Analysis by Country, 2025 and 2035
  • Figure 41: Eastern Europe Market Value Share and BPS Analysis by Classification , 2025 and 2035
  • Figure 42: Eastern Europe Market Y to o to Y Growth Comparison by Classification , 2025-2035
  • Figure 43: Eastern Europe Market Attractiveness Analysis by Classification
  • Figure 44: Eastern Europe Market Value Share and BPS Analysis by Application, 2025 and 2035
  • Figure 45: Eastern Europe Market Y to o to Y Growth Comparison by Application, 2025-2035
  • Figure 46: Eastern Europe Market Attractiveness Analysis by Application
  • Figure 47: East Asia Market Value Share and BPS Analysis by Country, 2025 and 2035
  • Figure 48: East Asia Market Value Share and BPS Analysis by Classification , 2025 and 2035
  • Figure 49: East Asia Market Y to o to Y Growth Comparison by Classification , 2025-2035
  • Figure 50: East Asia Market Attractiveness Analysis by Classification
  • Figure 51: East Asia Market Value Share and BPS Analysis by Application, 2025 and 2035
  • Figure 52: East Asia Market Y to o to Y Growth Comparison by Application, 2025-2035
  • Figure 53: East Asia Market Attractiveness Analysis by Application
  • Figure 54: South Asia and Pacific Market Value Share and BPS Analysis by Country, 2025 and 2035
  • Figure 55: South Asia and Pacific Market Value Share and BPS Analysis by Classification , 2025 and 2035
  • Figure 56: South Asia and Pacific Market Y to o to Y Growth Comparison by Classification , 2025-2035
  • Figure 57: South Asia and Pacific Market Attractiveness Analysis by Classification
  • Figure 58: South Asia and Pacific Market Value Share and BPS Analysis by Application, 2025 and 2035
  • Figure 59: South Asia and Pacific Market Y to o to Y Growth Comparison by Application, 2025-2035
  • Figure 60: South Asia and Pacific Market Attractiveness Analysis by Application
  • Figure 61: Middle East & Africa Market Value Share and BPS Analysis by Country, 2025 and 2035
  • Figure 62: Middle East & Africa Market Value Share and BPS Analysis by Classification , 2025 and 2035
  • Figure 63: Middle East & Africa Market Y to o to Y Growth Comparison by Classification , 2025-2035
  • Figure 64: Middle East & Africa Market Attractiveness Analysis by Classification
  • Figure 65: Middle East & Africa Market Value Share and BPS Analysis by Application, 2025 and 2035
  • Figure 66: Middle East & Africa Market Y to o to Y Growth Comparison by Application, 2025-2035
  • Figure 67: Middle East & Africa Market Attractiveness Analysis by Application
  • Figure 68: Global Market - Tier Structure Analysis
  • Figure 69: Global Market - Company Share Analysis

Frequently Asked Questions

How big is the optical grade lithium tantalate wafers market in 2025?

The global optical grade lithium tantalate wafers market is estimated to be valued at USD 807.7 million in 2025.

What will be the size of optical grade lithium tantalate wafers market in 2035?

The market size for the optical grade lithium tantalate wafers market is projected to reach USD 1,184.1 million by 2035.

How much will be the optical grade lithium tantalate wafers market growth between 2025 and 2035?

The optical grade lithium tantalate wafers market is expected to grow at a 3.9% CAGR between 2025 and 2035.

What are the key product types in the optical grade lithium tantalate wafers market?

The key product types in optical grade lithium tantalate wafers market are 6 inches, 4 inches, 8 inches and 12 inches.

Which application segment to contribute significant share in the optical grade lithium tantalate wafers market in 2025?

In terms of application, 5g communication segment to command 38.0% share in the optical grade lithium tantalate wafers market in 2025.

Explore Similar Insights

Future Market Insights

Optical Grade Lithium Tantalate Wafers Market

Chat With

MaRIA

Hi There, I am MaRIA, Your Market Research Intelligence Assistant. How may I help you?