Optical Transport Network Market Outlook (2022 to 2032)

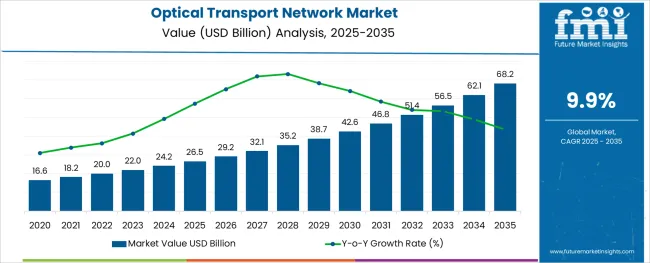
The optical transport network market is anticipated to rise to a value of USD 20 Billion in 2022 and likely to reach USD 51.4 Billion by 2032 with a CAGR of 9.9% during the forecast period from 2022 to 2032.

Report Attribute Details
Optical Transport Network Market Value (2022) USD 20 Billion
Optical Transport Network Market Anticipated Forecast Value (2032) USD 51.4 Billion
Optical Transport Network Market Projected Growth Rate (2022 to 2032) 9.9%

An optical transport network is a set of various elements that are known as optical network elements, these elements are connected by optical fibre links, which enables to cater multiplexing, and the functionality of transport and survivability of optical channels are likely to increase the demand for optical transport network during the forecast period from 2022 to 2032.

The adoption of optical transport network rises as they assist in carrying client signals, switching, signal management, and supervision which is anticipated to enlarge the optical transport network market share in the coming year.

The optical transport network provides various services with a high-capacity wavelength which is likely to raise the demand for optical transport network in the forthcoming year.

The optical transport network connects with the telecommunication companies to provide better information and reduce the cost of their ownership is anticipated to increase the optical transport network market size.

Optical transport network market growth is estimated to rise as it wraps all the technologies of digital traffic towards multiple services through its optical light paths, which calculates the timing and management data of the customer.

It is one of the key networks in transportation that scan the vehicle and its movement to identify the relevant data without any affecting or burden on transport networks technically. This is likely to increase the sales of optical transport network during the forecast period from 2022 to 2032.

Due to struggling with the traffic and rising traffic, the optical transport network is likely to be fast and easy to inform. The network that was put forward is estimated to increase the adoption of optical transport network in recent years.

The optical transport network is connected with the optical fibre cable as it is one of the stronger networks, which is likely to rise in the optical transport network market statistics in the coming year.

What are Some of the Factors Spearheading the Optical Transport Network Market?

With increasing technologies, telecom industries are one of them, which is rising the demand for optical transport network due to increasing IoT and smartphones in the coming forecast period from 2022 to 2032.

The network is quiet enough to provide all the requirements, including data, voice, video and other necessary things related to customers. Such innovations to fulfil the transport network is anticipated to grow the optical transport network market trends.

Although optical transport network forwards a piece of clean and clear information to the telecom industries as it is one of the better networks of transporting important information, which is likely to enlarge the sales of optical transport network in coming years.

The optical transport network market's key trends & opportunities are anticipated to increase as it offers various benefits. Some of them are management, monitoring, and flexibility. It also improved the reliability and secured all the services efficiently as per the optical transport network market survey.

Apart, the optical transport network also restrained the optical transport network growth due to a lack of awareness related to the optical transport network, high costs, and disconnection of the network, which drive the possibility of the decline of optical transport network market future trends in the forecast period from 2022 to 2032.

Regional Analysis

How is the Performance of North America Optical Transport Network Market Size?

North America dominates the optical transport network market share by acquiring 38.1% of the share in the optical transport network all around the globe during the forecast period from 2022 to 2032.

Due to rising IoT and an online presence worldwide, the optical transport network market trends & forecasts also like to rise in the North America region, acquiring the lion’s share as per optical transport network market statistics.

How will the Europe Optical Transport Network Market Grow?

The Europe region placed second in the optical transport network market size by acquiring 25.6% of the share of optical transport network equipment market share during the forecast period from 2022 to 2032.

Increasing IoT is the main factor of rising in the production of the optical transport network in the region. The rapidly demand optical transport network by end-users is growing the adoption of Europe optical transport network in the coming forecast period from 2022 to 2032.

How is the Start-up Ecosystem in the Optical Transport Network Market?

The key industries are likely to upsurge the optical transport network market future trends during the forecast period. Boosting the high speed of broadband is the key factor in the growing adoption of the optical transport network market.

Recently, the telecom company Vodafone Idea Ltd came with their new deploy 5th generation coherent optical service to their customers from Ciena in January 2022.

ZTE corporation launched the new compact metro edge ON product which include 4G/5G, cloud, broadband services with large capacity and also a cross-connection technology in a compact size.

These trends and recent launches are likely to develop the optical transport network size in the coming period.
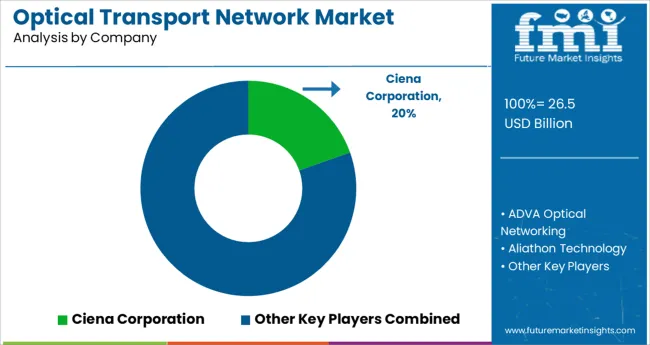
Who are Some of the Key Competitors in the Optical Transport Network Equipment Market?

The major player operating in the optical transport network market includes ADVA Optical Networking, Aliathon Technology, Ciena Corporation, Fujitsu, Infinera Corporation, Huawei Technologies Co., ZTE Corporation, ADTRAN, Ericsson, Cisco, Alcatel- Lucent, ECI Telecom Ltd., and Coriant.

All these key industry players are rising to boost the optical transport network market future trends by adopting innovative ideas and methodologies.

Recent Developments in Optical Transport Network Market are

  • The telecommunication company signed a deal of INR 3 Billion with Huawei to expand their process and upgrade it with a National Long Distance network in February 2022.
  • Cisco company dealt with the telecom company Datagroup to enlarge the project and built better internet services, security, reliability, high-speed and other services.

Report Scope

Report Attribute Details
Growth Rate CAGR of 9.9% from 2022 to 2032
Base Year for Estimation 2021
Historical Data 2016 to 2021
Forecast Period 2022 to 2032
Quantitative Units Revenue in USD Million and CAGR from 2022 to 2032
Report Coverage Revenue Forecast, Volume Forecast, Company Ranking, Competitive Landscape, Growth Factors, Trends and Pricing Analysis
Segments Covered Technology, End User, Region
Regions Covered North America; Latin America; Europe; East Asia; South Asia; Oceania; Middle East and Africa
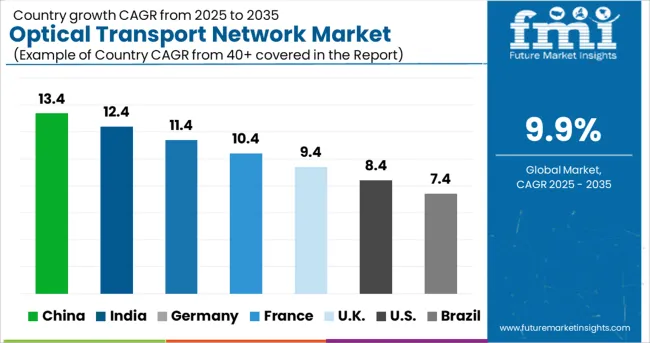
Key Countries Profiled USA, Canada, Brazil, Argentina, Germany, UK, France, Spain, Italy, Nordics, BENELUX, Australia & New Zealand, China, India, ASEAN, GCC, South Africa
Key Companies Profiled Ciena Corporation; Cisco; Coriant; FUJITSU; Huawei Technologies Co. Ltd; Infinera Corporation; Nokia; ZTE Corporation
Customization Available Upon Request

Key Segments

By Technology:

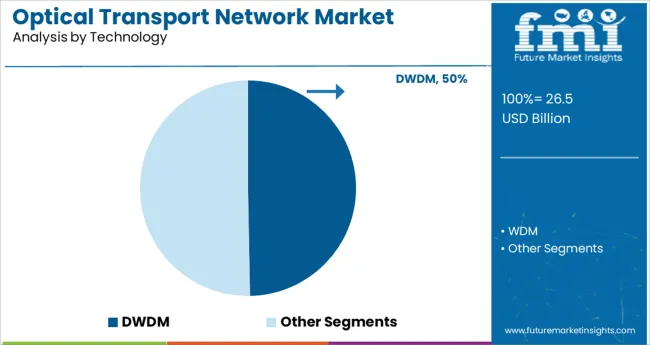
  • DWDM
  • WDM

By Component:

  • Optical Packet Platform
  • Optical Transport
  • Optical Switch

By Service:

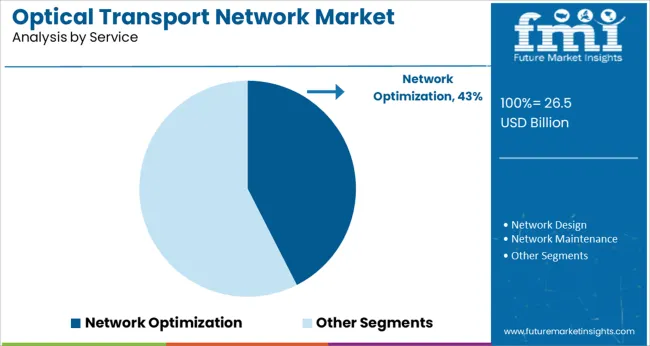
  • Network Design
  • Network Optimization
  • Network Maintenance
  • Other Support Services

By End-user Application:

  • Communication Service Providers
  • Communication Network Operators
  • Enterprises and Organization
  • Government and Institution

By Region:

  • North America
  • Latin America
  • Asia Pacific
  • MEA
  • Europe

Table of Content

  • 1. Executive Summary
  • 2. Market Overview
  • 3. Market Background
  • 4. Global Market Analysis 2017 to 2021 and Forecast, 2022 to 2032
  • 5. Global Market Analysis 2017 to 2021 and Forecast 2022 to 2032, By Technology
    • 5.1. DWDM
      • 5.1.1. Less than 10Gbps
      • 5.1.2. 10Gbps
      • 5.1.3. 40Gbps
      • 5.1.4. 100Gbps
      • 5.1.5. Greater than 100Gbps
    • 5.2. WDM
      • 5.2.1. Less than 10Gbps
      • 5.2.2. 10Gbps
      • 5.2.3. 40Gbps
      • 5.2.4. 100Gbps
      • 5.2.5. Greater than 100Gbps
  • 6. Global Market Analysis 2017 to 2021 and Forecast 2022 to 2032, By Component
    • 6.1. Optical Packet Platform
    • 6.2. Optical Transport
    • 6.3. Optical Switch
  • 7. Global Market Analysis 2017 to 2021 and Forecast 2022 to 2032, By Service
    • 7.1. Network Design
    • 7.2. Network Optimization
    • 7.3. Network Maintenance
    • 7.4. Other Support Services
  • 8. Global Market Analysis 2017 to 2021 and Forecast 2022 to 2032, By End-user Application
    • 8.1. Communication Service Providers
    • 8.2. Communication Network Operators
    • 8.3. Enterprises and Organizations
    • 8.4. Government and Institutions
  • 9. Global Market Analysis 2017 to 2021 and Forecast 2022 to 2032, By Region
    • 9.1. North America
    • 9.2. Latin America
    • 9.3. Europe
    • 9.4. Asia Pacific
    • 9.5. MEA
  • 10. North America Market Analysis 2017 to 2021 and Forecast 2022 to 2032, By Country
  • 11. Latin America Market Analysis 2017 to 2021 and Forecast 2022 to 2032, By Country
  • 12. Europe Market Analysis 2017 to 2021 and Forecast 2022 to 2032, By Country
  • 13. Asia Pacific Market Analysis 2017 to 2021 and Forecast 2022 to 2032, By Country
  • 14. MEA Market Analysis 2017 to 2021 and Forecast 2022 to 2032, By Country
  • 15. Key Countries Market Analysis
  • 16. Market Structure Analysis
  • 17. Competition Analysis
    • 17.1. ADVA Optical Networking
    • 17.2. Aliathon Technology
    • 17.3. Ciena Corporation
    • 17.4. Fujitsu
    • 17.5. Infinera Corporation
    • 17.6. Huawei Technologies
    • 17.7. ZTE Corporation
    • 17.8. ADTRAN
    • 17.9. Ericsson
    • 17.10. Cisco
    • 17.11. Alcatel-Lucent
    • 17.12. Ribbon Communications
    • 17.13. Coriant
  • 18. Assumptions & Acronyms Used
  • 19. Research Methodology

List of Tables

Table 1: Global Market Value (US$ Mn) Forecast by Region, 2017-2032

Table 2: Global Market Value (US$ Mn) Forecast by Technology, 2017-2032

Table 3: Global Market Value (US$ Mn) Forecast by Component, 2017-2032

Table 4: Global Market Value (US$ Mn) Forecast by Service, 2017-2032

Table 5: Global Market Value (US$ Mn) Forecast by End-user Application, 2017-2032

Table 6: North America Market Value (US$ Mn) Forecast by Country, 2017-2032

Table 7: North America Market Value (US$ Mn) Forecast by Technology, 2017-2032

Table 8: North America Market Value (US$ Mn) Forecast by Component, 2017-2032

Table 9: North America Market Value (US$ Mn) Forecast by Service, 2017-2032

Table 10: North America Market Value (US$ Mn) Forecast by End-user Application, 2017-2032

Table 11: Latin America Market Value (US$ Mn) Forecast by Country, 2017-2032

Table 12: Latin America Market Value (US$ Mn) Forecast by Technology, 2017-2032

Table 13: Latin America Market Value (US$ Mn) Forecast by Component, 2017-2032

Table 14: Latin America Market Value (US$ Mn) Forecast by Service, 2017-2032

Table 15: Latin America Market Value (US$ Mn) Forecast by End-user Application, 2017-2032

Table 16: Europe Market Value (US$ Mn) Forecast by Country, 2017-2032

Table 17: Europe Market Value (US$ Mn) Forecast by Technology, 2017-2032

Table 18: Europe Market Value (US$ Mn) Forecast by Component, 2017-2032

Table 19: Europe Market Value (US$ Mn) Forecast by Service, 2017-2032

Table 20: Europe Market Value (US$ Mn) Forecast by End-user Application, 2017-2032

Table 21: Asia Pacific Market Value (US$ Mn) Forecast by Country, 2017-2032

Table 22: Asia Pacific Market Value (US$ Mn) Forecast by Technology, 2017-2032

Table 23: Asia Pacific Market Value (US$ Mn) Forecast by Component, 2017-2032

Table 24: Asia Pacific Market Value (US$ Mn) Forecast by Service, 2017-2032

Table 25: Asia Pacific Market Value (US$ Mn) Forecast by End-user Application, 2017-2032

Table 26: MEA Market Value (US$ Mn) Forecast by Country, 2017-2032

Table 27: MEA Market Value (US$ Mn) Forecast by Technology, 2017-2032

Table 28: MEA Market Value (US$ Mn) Forecast by Component, 2017-2032

Table 29: MEA Market Value (US$ Mn) Forecast by Service, 2017-2032

Table 30: MEA Market Value (US$ Mn) Forecast by End-user Application, 2017-2032

List of Figures

Figure 1: Global Market Value (US$ Mn) by Technology, 2022-2032

Figure 2: Global Market Value (US$ Mn) by Component, 2022-2032

Figure 3: Global Market Value (US$ Mn) by Service, 2022-2032

Figure 4: Global Market Value (US$ Mn) by End-user Application, 2022-2032

Figure 5: Global Market Value (US$ Mn) by Region, 2022-2032

Figure 6: Global Market Value (US$ Mn) Analysis by Region, 2017-2032

Figure 7: Global Market Value Share (%) and BPS Analysis by Region, 2022-2032

Figure 8: Global Market Y-o-Y Growth (%) Projections by Region, 2022-2032

Figure 9: Global Market Value (US$ Mn) Analysis by Technology, 2017-2032

Figure 10: Global Market Value Share (%) and BPS Analysis by Technology, 2022-2032

Figure 11: Global Market Y-o-Y Growth (%) Projections by Technology, 2022-2032

Figure 12: Global Market Value (US$ Mn) Analysis by Component, 2017-2032

Figure 13: Global Market Value Share (%) and BPS Analysis by Component, 2022-2032

Figure 14: Global Market Y-o-Y Growth (%) Projections by Component, 2022-2032

Figure 15: Global Market Value (US$ Mn) Analysis by Service, 2017-2032

Figure 16: Global Market Value Share (%) and BPS Analysis by Service, 2022-2032

Figure 17: Global Market Y-o-Y Growth (%) Projections by Service, 2022-2032

Figure 18: Global Market Value (US$ Mn) Analysis by End-user Application, 2017-2032

Figure 19: Global Market Value Share (%) and BPS Analysis by End-user Application, 2022-2032

Figure 20: Global Market Y-o-Y Growth (%) Projections by End-user Application, 2022-2032

Figure 21: Global Market Attractiveness by Technology, 2022-2032

Figure 22: Global Market Attractiveness by Component, 2022-2032

Figure 23: Global Market Attractiveness by Service, 2022-2032

Figure 24: Global Market Attractiveness by End-user Application, 2022-2032

Figure 25: Global Market Attractiveness by Region, 2022-2032

Figure 26: North America Market Value (US$ Mn) by Technology, 2022-2032

Figure 27: North America Market Value (US$ Mn) by Component, 2022-2032

Figure 28: North America Market Value (US$ Mn) by Service, 2022-2032

Figure 29: North America Market Value (US$ Mn) by End-user Application, 2022-2032

Figure 30: North America Market Value (US$ Mn) by Country, 2022-2032

Figure 31: North America Market Value (US$ Mn) Analysis by Country, 2017-2032

Figure 32: North America Market Value Share (%) and BPS Analysis by Country, 2022-2032

Figure 33: North America Market Y-o-Y Growth (%) Projections by Country, 2022-2032

Figure 34: North America Market Value (US$ Mn) Analysis by Technology, 2017-2032

Figure 35: North America Market Value Share (%) and BPS Analysis by Technology, 2022-2032

Figure 36: North America Market Y-o-Y Growth (%) Projections by Technology, 2022-2032

Figure 37: North America Market Value (US$ Mn) Analysis by Component, 2017-2032

Figure 38: North America Market Value Share (%) and BPS Analysis by Component, 2022-2032

Figure 39: North America Market Y-o-Y Growth (%) Projections by Component, 2022-2032

Figure 40: North America Market Value (US$ Mn) Analysis by Service, 2017-2032

Figure 41: North America Market Value Share (%) and BPS Analysis by Service, 2022-2032

Figure 42: North America Market Y-o-Y Growth (%) Projections by Service, 2022-2032

Figure 43: North America Market Value (US$ Mn) Analysis by End-user Application, 2017-2032

Figure 44: North America Market Value Share (%) and BPS Analysis by End-user Application, 2022-2032

Figure 45: North America Market Y-o-Y Growth (%) Projections by End-user Application, 2022-2032

Figure 46: North America Market Attractiveness by Technology, 2022-2032

Figure 47: North America Market Attractiveness by Component, 2022-2032

Figure 48: North America Market Attractiveness by Service, 2022-2032

Figure 49: North America Market Attractiveness by End-user Application, 2022-2032

Figure 50: North America Market Attractiveness by Country, 2022-2032

Figure 51: Latin America Market Value (US$ Mn) by Technology, 2022-2032

Figure 52: Latin America Market Value (US$ Mn) by Component, 2022-2032

Figure 53: Latin America Market Value (US$ Mn) by Service, 2022-2032

Figure 54: Latin America Market Value (US$ Mn) by End-user Application, 2022-2032

Figure 55: Latin America Market Value (US$ Mn) by Country, 2022-2032

Figure 56: Latin America Market Value (US$ Mn) Analysis by Country, 2017-2032

Figure 57: Latin America Market Value Share (%) and BPS Analysis by Country, 2022-2032

Figure 58: Latin America Market Y-o-Y Growth (%) Projections by Country, 2022-2032

Figure 59: Latin America Market Value (US$ Mn) Analysis by Technology, 2017-2032

Figure 60: Latin America Market Value Share (%) and BPS Analysis by Technology, 2022-2032

Figure 61: Latin America Market Y-o-Y Growth (%) Projections by Technology, 2022-2032

Figure 62: Latin America Market Value (US$ Mn) Analysis by Component, 2017-2032

Figure 63: Latin America Market Value Share (%) and BPS Analysis by Component, 2022-2032

Figure 64: Latin America Market Y-o-Y Growth (%) Projections by Component, 2022-2032

Figure 65: Latin America Market Value (US$ Mn) Analysis by Service, 2017-2032

Figure 66: Latin America Market Value Share (%) and BPS Analysis by Service, 2022-2032

Figure 67: Latin America Market Y-o-Y Growth (%) Projections by Service, 2022-2032

Figure 68: Latin America Market Value (US$ Mn) Analysis by End-user Application, 2017-2032

Figure 69: Latin America Market Value Share (%) and BPS Analysis by End-user Application, 2022-2032

Figure 70: Latin America Market Y-o-Y Growth (%) Projections by End-user Application, 2022-2032

Figure 71: Latin America Market Attractiveness by Technology, 2022-2032

Figure 72: Latin America Market Attractiveness by Component, 2022-2032

Figure 73: Latin America Market Attractiveness by Service, 2022-2032

Figure 74: Latin America Market Attractiveness by End-user Application, 2022-2032

Figure 75: Latin America Market Attractiveness by Country, 2022-2032

Figure 76: Europe Market Value (US$ Mn) by Technology, 2022-2032

Figure 77: Europe Market Value (US$ Mn) by Component, 2022-2032

Figure 78: Europe Market Value (US$ Mn) by Service, 2022-2032

Figure 79: Europe Market Value (US$ Mn) by End-user Application, 2022-2032

Figure 80: Europe Market Value (US$ Mn) by Country, 2022-2032

Figure 81: Europe Market Value (US$ Mn) Analysis by Country, 2017-2032

Figure 82: Europe Market Value Share (%) and BPS Analysis by Country, 2022-2032

Figure 83: Europe Market Y-o-Y Growth (%) Projections by Country, 2022-2032

Figure 84: Europe Market Value (US$ Mn) Analysis by Technology, 2017-2032

Figure 85: Europe Market Value Share (%) and BPS Analysis by Technology, 2022-2032

Figure 86: Europe Market Y-o-Y Growth (%) Projections by Technology, 2022-2032

Figure 87: Europe Market Value (US$ Mn) Analysis by Component, 2017-2032

Figure 88: Europe Market Value Share (%) and BPS Analysis by Component, 2022-2032

Figure 89: Europe Market Y-o-Y Growth (%) Projections by Component, 2022-2032

Figure 90: Europe Market Value (US$ Mn) Analysis by Service, 2017-2032

Figure 91: Europe Market Value Share (%) and BPS Analysis by Service, 2022-2032

Figure 92: Europe Market Y-o-Y Growth (%) Projections by Service, 2022-2032

Figure 93: Europe Market Value (US$ Mn) Analysis by End-user Application, 2017-2032

Figure 94: Europe Market Value Share (%) and BPS Analysis by End-user Application, 2022-2032

Figure 95: Europe Market Y-o-Y Growth (%) Projections by End-user Application, 2022-2032

Figure 96: Europe Market Attractiveness by Technology, 2022-2032

Figure 97: Europe Market Attractiveness by Component, 2022-2032

Figure 98: Europe Market Attractiveness by Service, 2022-2032

Figure 99: Europe Market Attractiveness by End-user Application, 2022-2032

Figure 100: Europe Market Attractiveness by Country, 2022-2032

Figure 101: Asia Pacific Market Value (US$ Mn) by Technology, 2022-2032

Figure 102: Asia Pacific Market Value (US$ Mn) by Component, 2022-2032

Figure 103: Asia Pacific Market Value (US$ Mn) by Service, 2022-2032

Figure 104: Asia Pacific Market Value (US$ Mn) by End-user Application, 2022-2032

Figure 105: Asia Pacific Market Value (US$ Mn) by Country, 2022-2032

Figure 106: Asia Pacific Market Value (US$ Mn) Analysis by Country, 2017-2032

Figure 107: Asia Pacific Market Value Share (%) and BPS Analysis by Country, 2022-2032

Figure 108: Asia Pacific Market Y-o-Y Growth (%) Projections by Country, 2022-2032

Figure 109: Asia Pacific Market Value (US$ Mn) Analysis by Technology, 2017-2032

Figure 110: Asia Pacific Market Value Share (%) and BPS Analysis by Technology, 2022-2032

Figure 111: Asia Pacific Market Y-o-Y Growth (%) Projections by Technology, 2022-2032

Figure 112: Asia Pacific Market Value (US$ Mn) Analysis by Component, 2017-2032

Figure 113: Asia Pacific Market Value Share (%) and BPS Analysis by Component, 2022-2032

Figure 114: Asia Pacific Market Y-o-Y Growth (%) Projections by Component, 2022-2032

Figure 115: Asia Pacific Market Value (US$ Mn) Analysis by Service, 2017-2032

Figure 116: Asia Pacific Market Value Share (%) and BPS Analysis by Service, 2022-2032

Figure 117: Asia Pacific Market Y-o-Y Growth (%) Projections by Service, 2022-2032

Figure 118: Asia Pacific Market Value (US$ Mn) Analysis by End-user Application, 2017-2032

Figure 119: Asia Pacific Market Value Share (%) and BPS Analysis by End-user Application, 2022-2032

Figure 120: Asia Pacific Market Y-o-Y Growth (%) Projections by End-user Application, 2022-2032

Figure 121: Asia Pacific Market Attractiveness by Technology, 2022-2032

Figure 122: Asia Pacific Market Attractiveness by Component, 2022-2032

Figure 123: Asia Pacific Market Attractiveness by Service, 2022-2032

Figure 124: Asia Pacific Market Attractiveness by End-user Application, 2022-2032

Figure 125: Asia Pacific Market Attractiveness by Country, 2022-2032

Figure 126: MEA Market Value (US$ Mn) by Technology, 2022-2032

Figure 127: MEA Market Value (US$ Mn) by Component, 2022-2032

Figure 128: MEA Market Value (US$ Mn) by Service, 2022-2032

Figure 129: MEA Market Value (US$ Mn) by End-user Application, 2022-2032

Figure 130: MEA Market Value (US$ Mn) by Country, 2022-2032

Figure 131: MEA Market Value (US$ Mn) Analysis by Country, 2017-2032

Figure 132: MEA Market Value Share (%) and BPS Analysis by Country, 2022-2032

Figure 133: MEA Market Y-o-Y Growth (%) Projections by Country, 2022-2032

Figure 134: MEA Market Value (US$ Mn) Analysis by Technology, 2017-2032

Figure 135: MEA Market Value Share (%) and BPS Analysis by Technology, 2022-2032

Figure 136: MEA Market Y-o-Y Growth (%) Projections by Technology, 2022-2032

Figure 137: MEA Market Value (US$ Mn) Analysis by Component, 2017-2032

Figure 138: MEA Market Value Share (%) and BPS Analysis by Component, 2022-2032

Figure 139: MEA Market Y-o-Y Growth (%) Projections by Component, 2022-2032

Figure 140: MEA Market Value (US$ Mn) Analysis by Service, 2017-2032

Figure 141: MEA Market Value Share (%) and BPS Analysis by Service, 2022-2032

Figure 142: MEA Market Y-o-Y Growth (%) Projections by Service, 2022-2032

Figure 143: MEA Market Value (US$ Mn) Analysis by End-user Application, 2017-2032

Figure 144: MEA Market Value Share (%) and BPS Analysis by End-user Application, 2022-2032

Figure 145: MEA Market Y-o-Y Growth (%) Projections by End-user Application, 2022-2032

Figure 146: MEA Market Attractiveness by Technology, 2022-2032

Figure 147: MEA Market Attractiveness by Component, 2022-2032

Figure 148: MEA Market Attractiveness by Service, 2022-2032

Figure 149: MEA Market Attractiveness by End-user Application, 2022-2032

Figure 150: MEA Market Attractiveness by Country, 2022-2032

Frequently Asked Questions

What is the Growth Outlook for the Optical Transport Network Market?

The optical transport network market is likely to advance at a CAGR of 9.9% through 2032.

Which Region Holds an Optical Transport Network Market Share?

The North American region holds an optical transport network market share of 38.1% by 2032.

What is the Current Valuation of the Optical Transport Network Market?

The optical transport network market is anticipated to expect USD 20 Billion in 2022.

What is the Future of the Optical Transport Network Market?

The optical transport network market is expected to account for USD 51.4 Billion by 2032.

Explore Similar Insights

Future Market Insights

Optical Transport Network Market