Reports

- Global Locations -

Headquarters

Future Market Insights, Inc.

Christiana Corporate, 200
Continental Drive, Suite 401,
Newark, Delaware - 19713,
United States

T: +1-845-579-5705

Americas

Future Market Insights, Inc.

616 Corporate Way, Suite 2-9018,
Valley Cottage, NY 10989, United States

T: +1-347-918-3531

MEA

Future Market Insights

1602-6 Jumeirah Bay X2 Tower, Plot No: JLT-PH2-X2A,
Jumeirah Lakes Towers, Dubai,
United Arab Emirates

Europe

Future Market Insights

3rd Floor, 207 Regent Street,
W1B 3HH London
United Kingdom

T: + 44 (0) 20 8123 9659
D: +44 (0) 20 3287 4268

Asia Pacific

Future Market Insights

IndiaLand Global Tech Park, Unit UG-1, Behind Grand HighStreet, Phase 1, Hinjawadi, MH, Pune – 411057, India

Network Slicing Market Outlook (2022 to 2032)

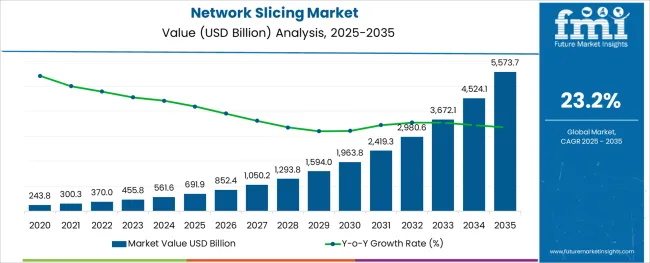
[306 Pages Report]The network slicing market is anticipated to record a CAGR of 23.2% during the forecast period (2022 to 2032).

The network slicing market is expected to be valued at US$ 370 Million in 2022 and is projected to reach US$ 3 Billion by 2032.

The network slicing market growth is projected to get influenced by the commercialization of 5G services and the availability of unlicensed and shared spectrum around the world.

The demand for network slicing solutions is anticipated to grow due to the advancement of cellular network technology, which provides greater data rates and lower latency.

Consumer demand for video and the change in industry toward the usage of cloud services have both contributed to the rapid increase in the adoption of network slicing.

Attributes Details
Network Slicing Market CAGR (2022 to 2032) 23.2%
Network Slicing Market Value (2022) US$ 370 Million
Network Slicing Market Value (2032) US$ 3 Billion

Don't pay for what you don't need

Customize your report by selecting specific countries or regions and save 30%!

What is the COVID-19 Impact on the Network Slicing Market?

The COVID-19 pandemic had a negative impact on the network-slicing market share. Lockdowns, social distancing, and quarantines used to combat COVID-19 have had a negative influence on various vendors of network slicing around the world.

The demand for network-slicing solutions is rising as enterprise virtual private network (VPN) servers have become lifelines for organizations/schools, with most employees working from home and students learning digitally.

According to the United Nations Educational, Scientific, and Cultural Organization (UNESCO), 850 million students are now learning and attending classes from home, while several million workers have abruptly converted to remote working, resulting in a massive shift in communication network utilization.

As most people have been confined to their homes, network traffic in Europe has surged by about 50%. As a result of the rising adoption of network slicing, the market is projected to witness multiple growth opportunities for network-slicing vendors or service providers.

Due to COVID-19, 3GPP, the global organization creating 5G technology, announced a three-month delay in the completion of 5G specifications in March 2020. The commercial development, demand for network slicing solutions, and 5G deployments have been hindered by delayed releases.

Supply chain interruptions and delays in the release of 5G technology have negatively impacted the network-slicing market size during the COVID-19 pandemic. Leading industry participants, on the other hand, are working hard to get the network-slicing market share back on track.

The adoption of network slicing is projected to rise as local governments are adopting a number of steps to offset COVID-19's harmful effects. As a result, the demand for network-slicing solutions is projected to rise rapidly during the forecast period.

What is the Key Dynamics Governing the Growth of the Network Slicing Market?

The adoption of network slicing is growing as it is reshaping various industries by connecting all types of devices, appliances, systems, and services, IoT adoption, and continuous developments in Machine-to-Machine (M2M) communication networks. Network slicing-enabled 5G would serve a variety of IoT use cases, allowing communication between massive numbers of sensors and linked devices. As a result of this, the demand for network-slicing solutions is predicted to grow rapidly during the forecast period.

The adoption of network slicing is increasing due to the developments in IoT technology. High-power, low-latency applications (such as mobile video surveillance) and low-power, low-latency, long-range IoT apps are two types of IoT applications (smart cities and smart factories).

The evolution of 5G technology is projected to accelerate in order to meet these needs for growing IoT applications, which are classified as huge machine-type communication and mission-critical applications.

The adoption of network slicing in every line of the industry has altered substantially as a result of Industry 4.0, automation, and digitalization. Most industries have experienced digital transformations to meet the increased demand for network-slicing solutions to maintain operational agility among customers and organizations.

There is a rising demand for network-slicing solutions among businesses to support their digital transformation efforts. The adoption of network slicing is projected to rise due to multiple technological breakthroughs and the growth in dynamic ecosystems. These factors have paved the path for new commercial applications to emerge in a variety of industries that are responsible for growth in network slicing market size.

Fixed network slices can be grown up by adding more hardware resources, however, RAN slicing is difficult to scale up since it quickly runs into a physical constraint owing to spectrum scarcity. Individual slices can be assigned dedicated carriers to bypass this issue.

The allotment of some carriers, on the other hand, would limit the network's ability to reap multiplexing advantages through the scaled-up slice. These factors are likely to limit the network-slicing market growth over the forecast period.

CIOs are mostly concerned about network slicing security, which can result in significant losses for organizations and service providers. SDN, NFV, and cloud-native architecture are used to construct the new network infrastructure, supporting the adoption of network slicing in multiple industries.

Network functions are separated from the underpinning infrastructure and distributed among local, regional, and central data centers. The demand for network slicing solutions is rising as the majority of network services in a cloud-based 5G network are implemented over public and private cloud infrastructure.

Sudip Saha
Sudip Saha

Principal Consultant

Talk to Analyst

Find your sweet spots for generating winning opportunities in this market.

Comparative View of Adjacent Network Slicing Market 

Network Slicing Market:

Attributes Network Slicing Market
CAGR (2022 to 2032) 23.2%
Market Value (2026) US$ 3 Billion
Growth Factor Growing mobile data traffic volumes, network virtualization, expanding demand for 5G network commercialization, and IoT installations, are all factors driving growth.
Opportunity The evolution of 5G technology is projected to accelerate in order to meet the demand for growing IoT applications
Key Trends Advancement of cellular network technology, which delivers better data speeds and lower latency.

5G Network Slicing Market:

Attributes 5G Network Slicing Market
CAGR (2022 to 2032) 20.8%
Market Value (2026) US$ 446.33 Billion
Growth Factor The market is expanding as leading carriers are integrating network optimization techniques such as network slicing into their OSS/BSS systems.
Opportunity Using 5G network slicing to improve capabilities for virtual network operators (VNO), might lead to new business development.
Key Trends Market trends include remote monitoring, supply chain management, asset management, real-time monitoring, and network monitoring

Internet of Things (IoT) Market:

Attributes Internet of Things (IoT) Market
CAGR (2022 to 2032) 26.4%
Market Value (2026) US$ 1.22 Billion
Growth Factor Smart homes and buildings, smart infrastructures, smart manufacturing, and Industry 4.0 initiatives are all on the rise.
Opportunity Increasing demand for efficient connected devices platforms to provide opportunities to market vendors.
Key Trends Consumers are increasingly adopting smart city technologies such as smart utility meters, smart grids, smart air quality controllers, smart trash management, and smart transportation.

With real-time data warnings, the adoption of network slicing is projected to rise as it improves assisted driving and transportation services, especially traffic. It is also anticipated to increase the safety of aided driving and decrease the time it takes to make key judgments while driving.

In dense urban regions and high-speed applications, 5G network slicing provides ultra-reliable connectivity with minimal latency for vehicle-to-vehicle communication. Low latency is also becoming a game-changer in virtual and augmented reality applications, fueling the demand for network-slicing solutions.

Nonetheless, due to severe latency concerns, numerous businesses are still unable to fully exploit the potential of network slicing. 5G network slicing, on the other hand, provides ultra-low latency for an upgraded user experience with its fast data transmission features, raising its demand across mission-critical applications.

Low-latency telemedicine apps can access real-time data without delays during life-critical scenarios and remote robotic surgery is increasingly becoming a priority for hospitals and healthcare professionals. For such applications, the demand for network-slicing solutions is anticipated to be quite advantageous.

In the same way, the adoption of network slicing is rising as it aids manufacturers in scaling up their linked robotic workforce. All of these elements are likely to make industrial IoT devices and connected machinery more efficient.

What is the Segmentation Outlook for the Network Slicing Market?

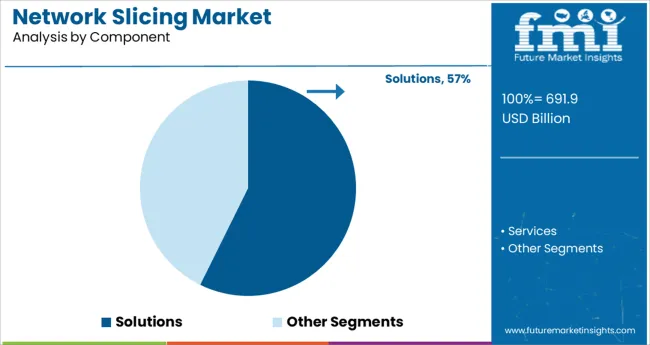
During the forecast period, the network slicing market is anticipated to be dominated by the solutions sector with a CAGR of 21.1%. The growing demand for high-speed and extensive network coverage, increasing mobile data traffic volumes, increasing demand for ultra-low latency, and expanding use of network virtualization are all driving this segment's growth.

The usefulness, criticality, and ease of implementation of network-slicing solutions all contribute to the segment's growth. Due to the benefits that network slicing solutions give, various suppliers are investing in Research and Development to improve and make them cheaper, especially for small and medium-sized businesses. As a result of this, the global network slicing market share is projected to rise during the forecast period.

Which Segment is likely to Lead the Network Slicing Market by Services?

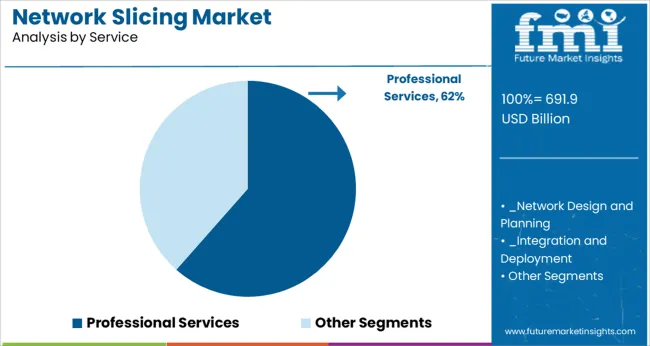
By services, the professional services segment is anticipated to hold the largest share with a CAGR of 21.1% during the forecast period. This growth is due to the increasing demand for smart monitoring and the steady increase in the remote operation of processes and applications.
Get the data you need at a Fraction of the cost

Personalize your report by choosing insights you need
and save 40%!

What is the Regional Analysis for the Network Slicing Market?

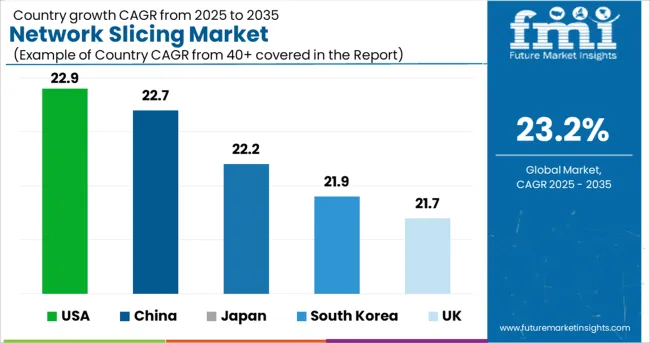
Regions CAGR (2022 to 2032)
USA Market 22.9%
UK Market 21.7%
China Market 22.7%
Japan Market 22.2%
South Korea Market 21.9%

The Asia Pacific region is anticipated to hold the highest proportion of the global network slicing market with an average CAGR of 22.4%. The presence of important firms delivering innovative network-slicing solutions and services to many sectors is responsible for the region's large share.

Some businesses and governments in this region have expressed an increased interest in commercializing the next-generation 5G network. Furthermore, the region's dominance in the network slicing market is likely to be maintained during the forecast period, thanks to rising demand for network virtualization, a favorable environment for start-ups, and strong government initiatives.

Increasing usage of technologies such as cloud computing, network function virtualization, and IoT is likely to propel the network slicing market in North America to new heights over the forecast period. Furthermore, the increased demand for broadband services across North America is expected to significantly boost the network-slicing market growth in the coming years.
How is the Competition in the Network Slicing Market?

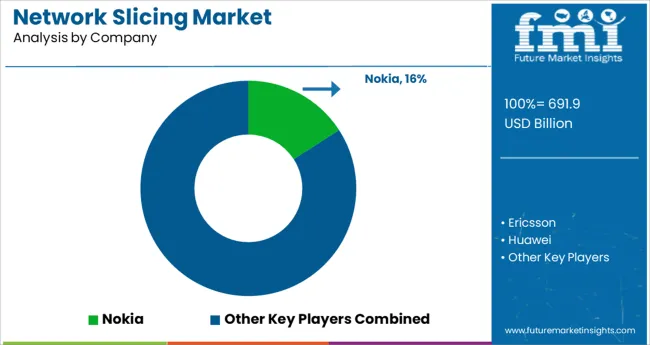
The network slicing market is fragmented, with different players collaborating to provide the required availability, latency, data rate, and security. Carriers can use network slice management technologies to implement network slice lifecycle management in preparation for 5G.

Recent Developments in the Network Slicing Market

  • Dish Network Corporation teamed with Blue Planet in September 2020 to automate network slices using Blue Planet's cloud-native inventory and service order management technology.
  • Telefonica Deutschland launched an autonomous network with Blue Planet in September 2020. Blue Planet allowed service providers to reduce their Operating Expenses (OPEX) while improving their network to provide services like 5G, video streaming, and online gaming.
  • Brillio and Blue Planet announced a partnership in April 2019 to deliver network automation to the enterprise and expedite digital transformation.

Key Players

  • Nokia
  • Ericsson
  • Huawei
  • ZTE
  • Samsung

Key Segments

By Components:

  • Solutions
  • Services

By Solutions:

  • Professional services
  • Managed Services

By Professional services:

  • Network design and planning
  • Integration and Deployment
  • Support and Maintenance

By End-user:

  • Telecom operators
  • Enterprises

By Applications:

  • Healthcare
  • Energy and Utilities
  • Transportation and Logistics
  • Manufacturing
  • Media and Entertainment
  • Automotive
  • Government
  • Others

By Region:

  • North America
  • Europe
  • Asia-Pacific (APAC)
  • Middle East and Africa (MEA)
  • Latin America

Frequently Asked Questions

What is the CAGR of the Network Slicing Market?

The network slicing market is anticipated to record a CAGR of 23.2% during the forecast period (2022 to 2032).

Which is the Leading Region in the Network Slicing Market?

The Asia-Pacific region is anticipated to hold the highest proportion of the global network slicing market.

Which Segment leads in the Network Slicing Market by End User?

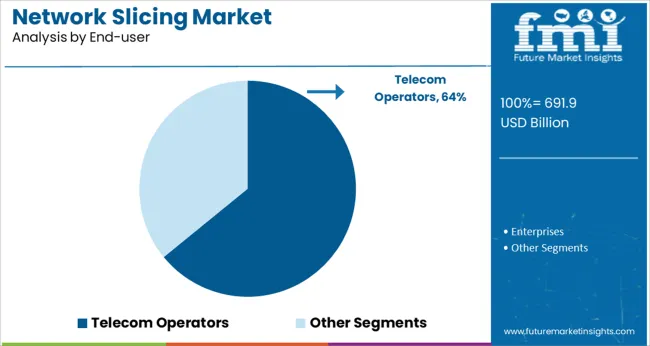
By end user, the telecom operators sector led the global network slicing market share in 2021 and is likely to continue to do so in the coming years.

What is the Growth Estimated for the Network Slicing Market by 2032?

The network slicing market is expected to be valued at US$ 3 Billion by 2032.

Which Region has the Highest Growth Potential?

North America is expected to significantly boost network slicing market growth in the coming years.

Table of Content

1. Executive Summary | Network Slicing Market

    1.1. Global Market Outlook

    1.2. Summary of Statistics

    1.3. Key Market Characteristics & Attributes

    1.4. FMI Analysis and Recommendations

2. Market Overview

    2.1. Market Coverage

    2.2. Market Definition

3. Market Risks and Trends Assessment 

    3.1. Risk Assessment

        3.1.1. COVID-19 Crisis and Impact on the Market

        3.1.2. COVID-19 Impact Benchmark with Previous Crisis

        3.1.3. Impact on Market Value (US$ Million)

        3.1.4. Assessment by Key Countries

        3.1.5. Assessment by Key Market Segments

        3.1.6. Action Points and Recommendation for Suppliers

    3.2. Key Trends Impacting the Market

    3.3. Formulation and Product Development Trends

4. Market Background

    4.1. Market, by Key Countries

    4.2. Market Opportunity Assessment (US$ Million)

        4.2.1. Total Available Market

        4.2.2. Serviceable Addressable Market

        4.2.3. Serviceable Obtainable Market

    4.3. Market Scenario Forecast

        4.3.1. Demand in Optimistic Scenario

        4.3.2. Demand in Likely Scenario

        4.3.3. Demand in Conservative Scenario

    4.4. Investment Feasibility Analysis

        4.4.1. Investment in Established Markets

            4.4.1.1. In Short Term

            4.4.1.2. In Long Term

        4.4.2. Investment in Emerging Markets

            4.4.2.1. In Short Term

            4.4.2.2. In Long Term

    4.5. Forecast Factors - Relevance & Impact

        4.5.1. Top Companies Historical Growth

        4.5.2. Growth in Automation, By Country

        4.5.3. Market Adoption Rate, By Country

    4.6. Market Dynamics

        4.6.1. Market Driving Factors and Impact Assessment

        4.6.2. Prominent Market Challenges and Impact Assessment

        4.6.3. Market Opportunities

        4.6.4. Prominent Trends in the Global Market & Their Impact Assessment

5. Key Success Factors

    5.1. Manufacturers’ Focus on Low Penetration High Growth Markets

    5.2. Banking on with Segments High Incremental Opportunity

    5.3. Peer Benchmarking

6. Global Market Demand Analysis 2015 to 2021 and Forecast, 2022 to 2032

    6.1. Historical Market Analysis, 2015 to 2021

    6.2. Current and Future Market Projections, 2022 to 2032

    6.3. Y-o-Y Growth Trend Analysis

7. Global Market Value Analysis 2015 to 2021 and Forecast, 2022 to 2032

    7.1. Historical Market Value (US$ Million) Analysis, 2015 to 2021

    7.2. Current and Future Market Value (US$ Million) Projections, 2022 to 2032

        7.2.1. Y-o-Y Growth Trend Analysis

        7.2.2. Absolute $ Opportunity Analysis

8. Global Market Analysis 2015 to 2021 and Forecast 2022 to 2032, By Component

    8.1. Introduction / Key Findings

    8.2. Historical Market Size (US$ Million) Analysis By Component, 2015 to 2021

    8.3. Current and Future Market Size (US$ Million) Analysis and Forecast By Component, 2022 to 2032

        8.3.1. Solutions

        8.3.2. Services

    8.4. Market Attractiveness Analysis By Component

9. Global Market Analysis 2015 to 2021 and Forecast 2022 to 2032, By Service

    9.1. Introduction / Key Findings

    9.2. Historical Market Size (US$ Million) Analysis By Service, 2015 to 2021

    9.3. Current and Future Market Size (US$ Million) Analysis and Forecast By Service, 2022 to 2032

        9.3.1. Professional services

            9.3.1.1. Network design and planning

            9.3.1.2. Integration and Deployment

            9.3.1.3. Support and Maintenance

        9.3.2. Managed Services

    9.4. Market Attractiveness Analysis By Service

10. Global Market Analysis 2015 to 2021 and Forecast 2022 to 2032, By End-user

    10.1. Introduction / Key Findings

    10.2. Historical Market Size (US$ Million) Analysis By End-user, 2015 to 2021

    10.3. Current and Future Market Size (US$ Million) Analysis and Forecast By End-user, 2022 to 2032

        10.3.1. Telecom operators

        10.3.2. Enterprises

    10.4. Market Attractiveness Analysis By End-user

11. Global Market Analysis 2015 to 2021 and Forecast 2022 to 2032, By Application

    11.1. Introduction / Key Findings

    11.2. Historical Market Size (US$ Million) Analysis By Application, 2015 to 2021

    11.3. Current and Future Market Size (US$ Million) Analysis and Forecast By Application, 2022 to 2032

        11.3.1. Healthcare

        11.3.2. Energy and Utilities

        11.3.3. Transportation and Logistics

        11.3.4. Manufacturing

        11.3.5. Media and Entertainment

        11.3.6. Automotive

        11.3.7. Government

        11.3.8. Others

    11.4. Market Attractiveness Analysis By Application

12. Global Market Analysis 2015 to 2021 and Forecast 2022 to 2032, By Region

    12.1. Introduction

    12.2. Historical Market Size (US$ Million) Analysis By Region, 2015 to 2021

    12.3. Current Market Size (US$ Million) & Analysis and Forecast By Region, 2022 to 2032

        12.3.1. North America

        12.3.2. Latin America

        12.3.3. Europe

        12.3.4. Asia Pacific

        12.3.5. Middle East and Africa (MEA)

    12.4. Market Attractiveness Analysis By Region

13. North America Market Analysis 2015 to 2021 and Forecast 2022 to 2032

    13.1. Introduction

    13.2. Pricing Analysis

    13.3. Historical Market Value (US$ Million) Trend Analysis By Market Taxonomy, 2015 to 2021

    13.4. Market Value (US$ Million) & Forecast By Market Taxonomy, 2022 to 2032

        13.4.1. By Country

            13.4.1.1. United States of America

            13.4.1.2. Canada

            13.4.1.3. Rest of North America

        13.4.2. By Component

        13.4.3. By Service

        13.4.4. By Application

        13.4.5. By End-user

    13.5. Market Attractiveness Analysis

        13.5.1. By Country

        13.5.2. By Component

        13.5.3. By Service

        13.5.4. By Application

        13.5.5. By End-user

14. Latin America Market Analysis 2015 to 2021 and Forecast 2022 to 2032

    14.1. Introduction

    14.2. Pricing Analysis

    14.3. Historical Market Value (US$ Million) Trend Analysis By Market Taxonomy, 2015 to 2021

    14.4. Market Value (US$ Million) & Forecast By Market Taxonomy, 2022 to 2032

        14.4.1. By Country

            14.4.1.1. Brazil

            14.4.1.2. Mexico

            14.4.1.3. Rest of Latin America

        14.4.2. By Component

        14.4.3. By Service

        14.4.4. By Application

        14.4.5. By End-user

    14.5. Market Attractiveness Analysis

        14.5.1. By Country

        14.5.2. By Component

        14.5.3. By Service

        14.5.4. By Application

        14.5.5. By End-user

15. Europe Market Analysis 2015 to 2021 and Forecast 2022 to 2032

    15.1. Introduction

    15.2. Pricing Analysis

    15.3. Historical Market Value (US$ Million) Trend Analysis By Market Taxonomy, 2015 to 2021

    15.4. Market Value (US$ Million) & Forecast By Market Taxonomy, 2022 to 2032

        15.4.1. By Country

            15.4.1.1. Germany

            15.4.1.2. France

            15.4.1.3. United Kingdom

            15.4.1.4. Italy

            15.4.1.5. Benelux

            15.4.1.6. Nordic Countries

            15.4.1.7. Rest of Europe

        15.4.2. By Component

        15.4.3. By Service

        15.4.4. By Application

        15.4.5. By End-user

    15.5. Market Attractiveness Analysis

        15.5.1. By Country

        15.5.2. By Component

        15.5.3. By Service

        15.5.4. By Application

        15.5.5. By End-user

16. Asia Pacific Market Analysis 2015 to 2021 and Forecast 2022 to 2032

    16.1. Introduction

    16.2. Pricing Analysis

    16.3. Historical Market Value (US$ Million) Trend Analysis By Market Taxonomy, 2015 to 2021

    16.4. Market Value (US$ Million) & Forecast By Market Taxonomy, 2022 to 2032

        16.4.1. By Country

            16.4.1.1. China

            16.4.1.2. Japan

            16.4.1.3. South Korea

            16.4.1.4. Rest of Asia Pacific

        16.4.2. By Component

        16.4.3. By Service

        16.4.4. By Application

        16.4.5. By End-user

    16.5. Market Attractiveness Analysis

        16.5.1. By Country

        16.5.2. By Component

        16.5.3. By Service

        16.5.4. By Application

        16.5.5. By End-user

17. Middle East and Africa Market Analysis 2015 to 2021 and Forecast 2022 to 2032

    17.1. Introduction

    17.2. Pricing Analysis

    17.3. Historical Market Value (US$ Million) Trend Analysis By Market Taxonomy, 2015 to 2021

    17.4. Market Value (US$ Million) & Forecast By Market Taxonomy, 2022 to 2032

        17.4.1. By Country

            17.4.1.1. GCC Countries

            17.4.1.2. South Africa

            17.4.1.3. Turkey

            17.4.1.4. Rest of Middle East and Africa

        17.4.2. By Component

        17.4.3. By Service

        17.4.4. By Application

        17.4.5. By End-user

    17.5. Market Attractiveness Analysis

        17.5.1. By Country

        17.5.2. By Component

        17.5.3. By Service

        17.5.4. By Application

        17.5.5. By End-user

18. Key Countries Market Analysis 2015 to 2021 and Forecast 2022 to 2032

    18.1. Introduction

        18.1.1. Market Value Proportion Analysis, By Key Countries

        18.1.2. Global Vs. Country Growth Comparison

    18.2. US Market Analysis

        18.2.1. Value Proportion Analysis by Market Taxonomy

        18.2.2. Value Analysis and Forecast by Market Taxonomy, 2015 to 2032

            18.2.2.1. By Component

            18.2.2.2. By Service

            18.2.2.3. By Application

            18.2.2.4. By End-user

    18.3. Canada Market Analysis

        18.3.1. Value Proportion Analysis by Market Taxonomy

        18.3.2. Value Analysis and Forecast by Market Taxonomy, 2015 to 2032

            18.3.2.1. By Component

            18.3.2.2. By Service

            18.3.2.3. By Application

            18.3.2.4. By End-user

    18.4. Mexico Market Analysis

        18.4.1. Value Proportion Analysis by Market Taxonomy

        18.4.2. Value Analysis and Forecast by Market Taxonomy, 2015 to 2032

            18.4.2.1. By Component

            18.4.2.2. By Service

            18.4.2.3. By Application

            18.4.2.4. By End-user

    18.5. Brazil Market Analysis

        18.5.1. Value Proportion Analysis by Market Taxonomy

        18.5.2. Value Analysis and Forecast by Market Taxonomy, 2015 to 2032

            18.5.2.1. By Component

            18.5.2.2. By Service

            18.5.2.3. By Application

            18.5.2.4. By End-user

    18.6. Germany Market Analysis

        18.6.1. Value Proportion Analysis by Market Taxonomy

        18.6.2. Value Analysis and Forecast by Market Taxonomy, 2015 to 2032

            18.6.2.1. By Component

            18.6.2.2. By Service

            18.6.2.3. By Application

            18.6.2.4. By End-user

    18.7. France Market Analysis

        18.7.1. Value Proportion Analysis by Market Taxonomy

        18.7.2. Value Analysis and Forecast by Market Taxonomy, 2015 to 2032

            18.7.2.1. By Component

            18.7.2.2. By Service

            18.7.2.3. By Application

            18.7.2.4. By End-user

    18.8. Italy Market Analysis

        18.8.1. Value Proportion Analysis by Market Taxonomy

        18.8.2. Value Analysis and Forecast by Market Taxonomy, 2015 to 2032

            18.8.2.1. By Component

            18.8.2.2. By Service

            18.8.2.3. By Application

            18.8.2.4. By End-user

    18.9. BENELUX Market Analysis

        18.9.1. Value Proportion Analysis by Market Taxonomy

        18.9.2. Value Analysis and Forecast by Market Taxonomy, 2015 to 2032

            18.9.2.1. By Component

            18.9.2.2. By Service

            18.9.2.3. By Application

            18.9.2.4. By End-user

    18.10. UK Market Analysis

        18.10.1. Value Proportion Analysis by Market Taxonomy

        18.10.2. Value Analysis and Forecast by Market Taxonomy, 2015 to 2032

            18.10.2.1. By Component

            18.10.2.2. By Service

            18.10.2.3. By Application

            18.10.2.4. By End-user

    18.11. Nordic Countries Market Analysis

        18.11.1. Value Proportion Analysis by Market Taxonomy

        18.11.2. Value Analysis and Forecast by Market Taxonomy, 2015 to 2032

            18.11.2.1. By Component

            18.11.2.2. By Service

            18.11.2.3. By Application

            18.11.2.4. By End-user

    18.12. China Market Analysis

        18.12.1. Value Proportion Analysis by Market Taxonomy

        18.12.2. Value Analysis and Forecast by Market Taxonomy, 2015 to 2032

            18.12.2.1. By Component

            18.12.2.2. By Service

            18.12.2.3. By Application

            18.12.2.4. By End-user

    18.13. Japan Market Analysis

        18.13.1. Value Proportion Analysis by Market Taxonomy

        18.13.2. Value Analysis and Forecast by Market Taxonomy, 2015 to 2032

            18.13.2.1. By Component

            18.13.2.2. By Service

            18.13.2.3. By Application

            18.13.2.4. By End-user

    18.14. South Korea Market Analysis

        18.14.1. Value Proportion Analysis by Market Taxonomy

        18.14.2. Value Analysis and Forecast by Market Taxonomy, 2015 to 2032

            18.14.2.1. By Component

            18.14.2.2. By Service

            18.14.2.3. By Application

            18.14.2.4. By End-user

    18.15. GCC Countries Market Analysis

        18.15.1. Value Proportion Analysis by Market Taxonomy

        18.15.2. Value Analysis and Forecast by Market Taxonomy, 2015 to 2032

            18.15.2.1. By Component

            18.15.2.2. By Service

            18.15.2.3. By Application

            18.15.2.4. By End-user

    18.16. South Africa Market Analysis

        18.16.1. Value Proportion Analysis by Market Taxonomy

        18.16.2. Value Analysis and Forecast by Market Taxonomy, 2015 to 2032

            18.16.2.1. By Component

            18.16.2.2. By Service

            18.16.2.3. By Application

            18.16.2.4. By End-user

    18.17. Turkey Market Analysis

        18.17.1. Value Proportion Analysis by Market Taxonomy

        18.17.2. Value Analysis and Forecast by Market Taxonomy, 2015 to 2032

            18.17.2.1. By Component

            18.17.2.2. By Service

            18.17.2.3. By Application

            18.17.2.4. By End-user

        18.17.3. Competition Landscape and Player Concentration in the Country

19. Market Structure Analysis

    19.1. Market Analysis by Tier of Companies

    19.2. Market Concentration

    19.3. Market Share Analysis of Top Players

    19.4. Market Presence Analysis

        19.4.1. By Regional Footprint of Players

        19.4.2. Product Footprint by Players

20. Competition Analysis

    20.1. Competition Dashboard

    20.2. Competition Benchmarking

    20.3. Competition Deep Dive

        20.3.1. Nokia

            20.3.1.1. Overview

            20.3.1.2. Product Portfolio

            20.3.1.3. Sales Footprint

            20.3.1.4. Strategy Overview

        20.3.2. Ericsson

            20.3.2.1. Overview

            20.3.2.2. Product Portfolio

            20.3.2.3. Sales Footprint

            20.3.2.4. Strategy Overview

        20.3.3. Huawei

            20.3.3.1. Overview

            20.3.3.2. Product Portfolio

            20.3.3.3. Sales Footprint

            20.3.3.4. Strategy Overview

        20.3.4. ZTE

            20.3.4.1. Overview

            20.3.4.2. Product Portfolio

            20.3.4.3. Sales Footprint

            20.3.4.4. Strategy Overview

        20.3.5. Samsung

            20.3.5.1. Overview

            20.3.5.2. Product Portfolio

            20.3.5.3. Sales Footprint

            20.3.5.4. Strategy Overview

        20.3.6. Blue Planet

            20.3.6.1. Overview

            20.3.6.2. Product Portfolio

            20.3.6.3. Sales Footprint

            20.3.6.4. Strategy Overview

        20.3.7. Parallel Wireless

            20.3.7.1. Overview

            20.3.7.2. Product Portfolio

            20.3.7.3. Sales Footprint

            20.3.7.4. Strategy Overview

        20.3.8. Affirmed Networks

            20.3.8.1. Overview

            20.3.8.2. Product Portfolio

            20.3.8.3. Sales Footprint

            20.3.8.4. Strategy Overview

        20.3.9. Mavenir

            20.3.9.1. Overview

            20.3.9.2. Product Portfolio

            20.3.9.3. Sales Footprint

            20.3.9.4. Strategy Overview

        20.3.10. Argela

            20.3.10.1. Overview

            20.3.10.2. Product Portfolio

            20.3.10.3. Sales Footprint

            20.3.10.4. Strategy Overview

        20.3.11. Cisco

            20.3.11.1. Overview

            20.3.11.2. Product Portfolio

            20.3.11.3. Sales Footprint

            20.3.11.4. Strategy Overview

        20.3.12. HPE

            20.3.12.1. Overview

            20.3.12.2. Product Portfolio

            20.3.12.3. Sales Footprint

            20.3.12.4. Strategy Overview

        20.3.13. Tambora Systems

            20.3.13.1. Overview

            20.3.13.2. Product Portfolio

            20.3.13.3. Sales Footprint

            20.3.13.4. Strategy Overview

        20.3.14. AMDOCS

            20.3.14.1. Overview

            20.3.14.2. Product Portfolio

            20.3.14.3. Sales Footprint

            20.3.14.4. Strategy Overview

        20.3.15. Aria Networks

            20.3.15.1. Overview

            20.3.15.2. Product Portfolio

            20.3.15.3. Sales Footprint

            20.3.15.4. Strategy Overview

21. Assumptions and Acronyms Used

22. Research Methodology

Don't pay for what you don't need

Customize your report by selecting specific countries or regions and save 30%!

List of Tables

Table 1: Global Market Value (US$ Million), By Component, 2015 to 2021

Table 2: Global Market Value (US$ Million), By Component, 2022 to 2032

Table 3: Global Market Value (US$ Million), By Service, 2015 to 2021

Table 4: Global Market Value (US$ Million), By Service, 2022 to 2032

Table 5: Global Market Value (US$ Million), By End-user, 2015 to 2021

Table 6: Global Market Value (US$ Million), By End-user, 2022 to 2032

Table 7: Global Market Value (US$ Million), By Application, 2015 to 2021

Table 8: Global Market Value (US$ Million), By Application, 2022 to 2032

Table 9: Global Market, By Region, 2015 to 2021

Table 10: Global Market, By Region, 2022 to 2032

Table 11: North America Market Value (US$ Million), By Component, 2015 to 2021

Table 12: North America Market Value (US$ Million), By Component, 2022 to 2032

Table 13: North America Market Value (US$ Million), By Service, 2015 to 2021

Table 14: North America Market Value (US$ Million), By Service, 2022 to 2032

Table 15: North America Market Value (US$ Million), By End-user, 2015 to 2021

Table 16: North America Market Value (US$ Million), By End-user, 2022 to 2032

Table 17: North America Market Value (US$ Million), By Application, 2015 to 2021

Table 18: North America Market Value (US$ Million), By Application, 2022 to 2032

Table 19: North America Market, By Country, 2015 to 2021

Table 20: North America Market, By Country, 2022 to 2032

Table 21: Latin America Market Value (US$ Million), By Component, 2015 to 2021

Table 22: Latin America Market Value (US$ Million), By Component, 2022 to 2032

Table 23: Latin America Market Value (US$ Million), By Service, 2015 to 2021

Table 24: Latin America Market Value (US$ Million), By Service, 2022 to 2032

Table 25: Latin America Market Value (US$ Million), By End-user, 2015 to 2021

Table 26: Latin America Market Value (US$ Million), By End-user, 2022 to 2032

Table 27: Latin America Market Value (US$ Million), By Application, 2015 to 2021

Table 28: Latin America Market Value (US$ Million), By Application, 2022 to 2032

Table 29: Latin America Market, By Country, 2015 to 2021

Table 30: Latin America Market, By Country, 2022 to 2032

Table 31: Europe Market Value (US$ Million), By Component, 2015 to 2021

Table 32: Europe Market Value (US$ Million), By Component, 2022 to 2032

Table 33: Europe Market Value (US$ Million), By Service, 2015 to 2021

Table 34: Europe Market Value (US$ Million), By Service, 2022 to 2032

Table 35: Europe Market Value (US$ Million), By End-user, 2015 to 2021

Table 36: Europe Market Value (US$ Million), By End-user, 2022 to 2032

Table 37: Europe Market Value (US$ Million), By Application, 2015 to 2021

Table 38: Europe Market Value (US$ Million), By Application, 2022 to 2032

Table 39: Europe Market, By Country, 2015 to 2021

Table 40: Europe Market, By Country, 2022 to 2032

Table 41: Asia Pacific Market Value (US$ Million), By Component, 2015 to 2021

Table 42: Asia Pacific Market Value (US$ Million), By Component, 2022 to 2032

Table 43: Asia Pacific Market Value (US$ Million), By Service, 2015 to 2021

Table 44: Asia Pacific Market Value (US$ Million), By Service, 2022 to 2032

Table 45: Asia Pacific Market Value (US$ Million), By End-user, 2015 to 2021

Table 46: Asia Pacific Market Value (US$ Million), By End-user, 2022 to 2032

Table 47: Asia Pacific Market Value (US$ Million), By Application, 2015 to 2021

Table 48: Asia Pacific Market Value (US$ Million), By Application, 2022 to 2032

Table 49: Asia Pacific Market, By Country, 2015 to 2021

Table 50: Asia Pacific Market, By Country, 2022 to 2032

Table 51: MEA Market Value (US$ Million), By Component, 2015 to 2021

Table 52: MEA Market Value (US$ Million), By Component, 2022 to 2032

Table 53: MEA Market Value (US$ Million), By Service, 2015 to 2021

Table 54: MEA Market Value (US$ Million), By Service, 2022 to 2032

Table 55: MEA Market Value (US$ Million), By End-user, 2015 to 2021

Table 56: MEA Market Value (US$ Million), By End-user, 2022 to 2032

Table 57: MEA Market Value (US$ Million), By Application, 2015 to 2021

Table 58: MEA Market Value (US$ Million), By Application, 2022 to 2032

Table 59: MEA Market, By Country, 2015 to 2021

Table 60: MEA Market, By Country, 2022 to 2032
Sudip Saha
Sudip Saha

Principal Consultant

Talk to Analyst

Find your sweet spots for generating winning opportunities in this market.

List of Charts

Figure 1: Global Market Value (US$ Million) and Year-on-Year Growth, 2015 to 2032

Figure 2: Global Market Absolute $ Historical Gain (2015 to 2021) and Opportunity (2022 to 2032), US$ Million

Figure 3: Global Market Share, By Component, 2022 & 2032

Figure 4: Global Market Y-o-Y Growth Projections, By Component - 2022 to 2032

Figure 5: Global Market Attractiveness Index, By Component - 2022 to 2032

Figure 6: Global Market Share, By Service, 2022 & 2032

Figure 7: Global Market Y-o-Y Growth Projections, By Service - 2022 to 2032

Figure 8: Global Market Attractiveness Index, By Service - 2022 to 2032

Figure 9: Global Market Share, By Application, 2022 & 2032

Figure 10: Global Market Y-o-Y Growth Projections, By Application - 2022 to 2032

Figure 11: Global Market Attractiveness Index, By Application - 2022 to 2032

Figure 12: Global Market Share, By End-user, 2022 & 2032

Figure 13: Global Market Y-o-Y Growth Projections, By End-user - 2022 to 2032

Figure 14: Global Market Attractiveness Index, By End-user - 2022 to 2032

Figure 15: Global Market Share, By Region, 2022 & 2032

Figure 16: Global Market Y-o-Y Growth Projections, By Region - 2022 to 2032

Figure 17: Global Market Attractiveness Index, By Region - 2022 to 2032

Figure 18: North America Market Value (US$ Million) and Year-on-Year Growth, 2015 to 2032

Figure 19: North America Market Absolute $ Opportunity Historical (2015 to 2021) and Forecast Period (2022 to 2032), US$ Million

Figure 20: North America Market Share, By Component, 2022 & 2032

Figure 21: North America Market Y-o-Y Growth Projections, By Component - 2022 to 2032

Figure 22: North America Market Attractiveness Index, By Component - 2022 to 2032

Figure 23: North America Market Share, By Service, 2022 & 2032

Figure 24: North America Market Y-o-Y Growth Projections, By Service - 2022 to 2032

Figure 25: North America Market Attractiveness Index, By Service - 2022 to 2032

Figure 26: North America Market Share, By Application, 2022 & 2032

Figure 27: North America Market Y-o-Y Growth Projections, By Application - 2022 to 2032

Figure 28: North America Market Attractiveness Index, By Application - 2022 to 2032

Figure 29: North America Market Share, By End-user, 2022 & 2032

Figure 30: North America Market Y-o-Y Growth Projections, By End-user - 2022 to 2032

Figure 31: North America Market Attractiveness Index, By End-user - 2022 to 2032

Figure 32: North America Market Share, By Country, 2022 & 2032

Figure 33: North America Market Y-o-Y Growth Projections, By Country - 2022 to 2032

Figure 34: North America Market Attractiveness Index, By Country - 2022 to 2032

Figure 35: Latin America Market Value (US$ Million) and Year-on-Year Growth, 2015 to 2032

Figure 36: Latin America Market Absolute $ Opportunity Historical (2015 to 2021) and Forecast Period (2022 to 2032), US$ Million

Figure 37: Latin America Market Share, By Component, 2022 & 2032

Figure 38: Latin America Market Y-o-Y Growth Projections, By Component - 2022 to 2032

Figure 39: Latin America Market Attractiveness Index, By Component - 2022 to 2032

Figure 40: Latin America Market Share, By Service, 2022 & 2032

Figure 41: Latin America Market Y-o-Y Growth Projections, By Service - 2022 to 2032

Figure 42: Latin America Market Attractiveness Index, By Service - 2022 to 2032

Figure 43: Latin America Market Share, By Application, 2022 & 2032

Figure 44: Latin America Market Y-o-Y Growth Projections, By Application - 2022 to 2032

Figure 45: Latin America Market Attractiveness Index, By Application - 2022 to 2032

Figure 46: Latin America Market Share, By End-user, 2022 & 2032

Figure 47: Latin America Market Y-o-Y Growth Projections, By End-user - 2022 to 2032

Figure 48: Latin America Market Attractiveness Index, By End-user - 2022 to 2032

Figure 49: Latin America Market Share, By Country, 2022 & 2032

Figure 50: Latin America Market Y-o-Y Growth Projections, By Country - 2022 to 2032

Figure 51: Latin America Market Attractiveness Index, By Country - 2022 to 2032

Figure 52: Europe Market Value (US$ Million) and Year-on-Year Growth, 2015 to 2032

Figure 53: Europe Market Absolute $ Opportunity Historical (2015 to 2021) and Forecast Period (2022 to 2032), US$ Million

Figure 54: Europe Market Share, By Component, 2022 & 2032

Figure 55: Europe Market Y-o-Y Growth Projections, By Component - 2022 to 2032

Figure 56: Europe Market Attractiveness Index, By Component - 2022 to 2032

Figure 57: Europe Market Share, By Service, 2022 & 2032

Figure 58: Europe Market Y-o-Y Growth Projections, By Service - 2022 to 2032

Figure 59: Europe Market Attractiveness Index, By Service - 2022 to 2032

Figure 60: Europe Market Share, By Application, 2022 & 2032

Figure 61: Europe Market Y-o-Y Growth Projections, By Application - 2022 to 2032

Figure 62: Europe Market Attractiveness Index, By Application - 2022 to 2032

Figure 63: Europe Market Share, By End-user, 2022 & 2032

Figure 64: Europe Market Y-o-Y Growth Projections, By End-user - 2022 to 2032

Figure 65: Europe Market Attractiveness Index, By End-user - 2022 to 2032

Figure 66: Europe Market Share, By Country, 2022 & 2032

Figure 67: Europe Market Y-o-Y Growth Projections, By Country - 2022 to 2032

Figure 68: Europe Market Attractiveness Index, By Country - 2022 to 2032

Figure 69: MEA Market Value (US$ Million) and Year-on-Year Growth, 2015 to 2032

Figure 70: MEA Market Absolute $ Opportunity Historical (2015 to 2021) and Forecast Period (2022 to 2032), US$ Million

Figure 71: MEA Market Share, By Component, 2022 & 2032

Figure 72: MEA Market Y-o-Y Growth Projections, By Component - 2022 to 2032

Figure 73: MEA Market Attractiveness Index, By Component - 2022 to 2032

Figure 74: MEA Market Share, By Service, 2022 & 2032

Figure 75: MEA Market Y-o-Y Growth Projections, By Service - 2022 to 2032

Figure 76: MEA Market Attractiveness Index, By Service - 2022 to 2032

Figure 77: MEA Market Share, By Application, 2022 & 2032

Figure 78: MEA Market Y-o-Y Growth Projections, By Application - 2022 to 2032

Figure 79: MEA Market Attractiveness Index, By Application - 2022 to 2032

Figure 80: MEA Market Share, By End-user, 2022 & 2032

Figure 81: MEA Market Y-o-Y Growth Projections, By End-user - 2022 to 2032

Figure 82: MEA Market Attractiveness Index, By End-user - 2022 to 2032

Figure 83: MEA Market Share, By Country, 2022 & 2032

Figure 84: MEA Market Y-o-Y Growth Projections, By Country - 2022 to 2032

Figure 85: MEA Market Attractiveness Index, By Country - 2022 to 2032

Figure 86: Asia Pacific Market Value (US$ Million) and Year-on-Year Growth, 2015 to 2032

Figure 87: Asia Pacific Market Absolute $ Opportunity Historical (2015 to 2021) and Forecast Period (2022 to 2032), US$ Million

Figure 88: Asia Pacific Market Share, By Component, 2022 & 2032

Figure 89: Asia Pacific Market Y-o-Y Growth Projections, By Component - 2022 to 2032

Figure 90: Asia Pacific Market Attractiveness Index, By Component - 2022 to 2032

Figure 91: Asia Pacific Market Share, By Service, 2022 & 2032

Figure 92: Asia Pacific Market Y-o-Y Growth Projections, By Service - 2022 to 2032

Figure 93: Asia Pacific Market Attractiveness Index, By Service - 2022 to 2032

Figure 94: Asia Pacific Market Share, By Application, 2022 & 2032

Figure 95: Asia Pacific Market Y-o-Y Growth Projections, By Application - 2022 to 2032

Figure 96: Asia Pacific Market Attractiveness Index, By Application - 2022 to 2032

Figure 97: Asia Pacific Market Share, By End-user, 2022 & 2032

Figure 98: Asia Pacific Market Y-o-Y Growth Projections, By End-user - 2022 to 2032

Figure 99: Asia Pacific Market Attractiveness Index, By End-user - 2022 to 2032

Figure 100: Asia Pacific Market Share, By Country, 2022 & 2032

Figure 101: Asia Pacific Market Y-o-Y Growth Projections, By Country - 2022 to 2032

Figure 102: Asia Pacific Market Attractiveness Index, By Country - 2022 to 2032

Recommendations

Technology

Gigabit Passive Optical Network (GPON) Market

Published : May 2023

Technology

Smart Grid Home Area Network (HAN) Market

Published : December 2022

Explore Technology Insights

View Reports