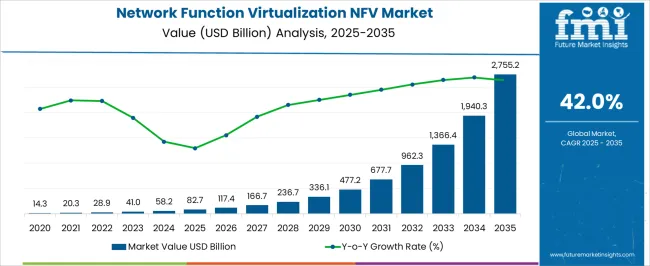
The Network Function Virtualization (NFV) Market is estimated to be valued at USD 82.7 billion in 2025 and is projected to reach USD 2755.2 billion by 2035, registering a compound annual growth rate (CAGR) of 42.0% over the forecast period. Between 2020 and 2030, the market value rises from USD 14.3 billion to around USD 336.1 billion, reflecting a strong upward trajectory driven by increasing adoption of cloud-native technologies, demand for flexible and scalable network architectures, and growing need for cost-efficient network operations.
This initial growth phase benefits from advancements in virtualization technology, increasing deployment of software-defined networking (SDN), and the proliferation of 5G networks that require dynamic and programmable network functions. From 2030 to 2035, the market accelerates dramatically from USD 477.2 billion to USD 2,755.2 billion, supported by widespread integration of NFV with emerging technologies such as artificial intelligence, machine learning, and edge computing.
These developments enable enhanced network automation, security, and performance, meeting the demands of IoT, cloud services, and digital transformation initiatives globally. Emerging economies contribute significantly due to expanding telecommunication infrastructure and government initiatives promoting digital connectivity. Overall, the NFV market is positioned for exponential and sustained growth through 2035, fueled by continuous technological innovation, evolving industry requirements, and the global push for next-generation network solutions.
| Metric | Value |
|---|---|
| Network Function Virtualization (NFV) Market Estimated Value in (2025 E) | USD 82.7 billion |
| Network Function Virtualization (NFV) Market Forecast Value in (2035 F) | USD 2755.2 billion |
| Forecast CAGR (2025 to 2035) | 42.0% |
Telecom operators and enterprises are prioritizing the shift from proprietary hardware to virtualized network functions to improve agility, simplify infrastructure, and reduce capital expenditure.
Government initiatives promoting 5G rollouts and industry collaborations on open standards are further enhancing adoption. With cloud-native frameworks becoming central to modern network design, NFV is playing a pivotal role in enabling dynamic service provisioning and reducing deployment timelines.
Future opportunities are expected to be driven by AI-powered orchestration, low-latency network slicing, and vendor-neutral virtualization platforms that improve multi-vendor interoperability.
The network function virtualization (NFV) market is segmented by component, application, and geographic regions. The component of the network function virtualization (NFV) market is divided into NFV servers, Hardware, Storage, Switches, Software, NFV MANO, VNF software, Service, Training and consulting, Integration and maintenance, and managed service.
In terms of application of the network function virtualization (NFV) market, it is classified into IT & Telecom, BFSI, Healthcare, Retail & consumer goods, Government, Manufacturing, and Other applications. Regionally, the network function virtualization (NFV) industry is classified into North America, Latin America, Western Europe, Eastern Europe, Balkan & Baltic Countries, Russia & Belarus, Central Asia, East Asia, South Asia & Pacific, and the Middle East & Africa.
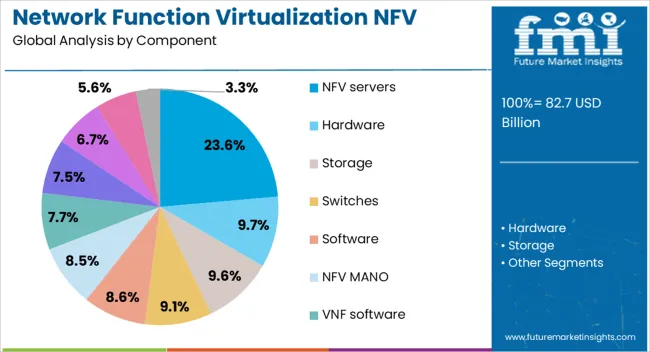
NFV servers are projected to account for 23.60% of total revenue in the NFV market by 2025, making them the leading component segment. This position is being reinforced by rising demand for general-purpose computing infrastructure that supports software-defined networking functions in both core and edge environments.
NFV servers offer high processing capacity, flexible scaling, and compatibility with open-source virtualization frameworks, which are crucial for service agility and workload portability. Their role in reducing reliance on specialized hardware, while enabling centralized management and dynamic configuration, has been instrumental in improving time-to-market for telecom service providers.
Continued investment in high-performance multi-core processors, energy-efficient designs, and edge-ready compute platforms is expected to sustain the growth of this segment.
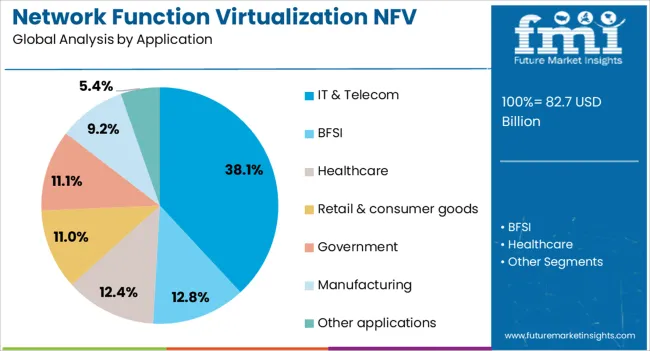
The IT & telecom sector is expected to contribute 38.10% of the total revenue in the NFV market by 2025, establishing it as the dominant application segment. This leadership stems from the industry’s accelerated shift toward virtualized, service-centric network models to accommodate increased demand for bandwidth, automation, and 5G deployment readiness.
Telecom operators are deploying NFV to virtualize core functions such as firewalls, routers, and load balancers, reducing hardware dependencies while improving operational scalability. The ability to deliver network services on demand, integrate with software-defined wide area networks (SD-WAN), and support containerized network functions has been a key driver in the IT and telecom domains.
With increasing traffic from IoT and streaming applications, NFV adoption is expected to intensify, ensuring more resilient, programmable, and efficient networks.
The NFV market is driven by the need for network efficiency, 5G integration, cost savings, and flexibility, but faces challenges related to legacy system integration. As organizations transition to more agile, software-based networks, NFV adoption continues to expand.
The growing demand for efficient network management is a major driver in the NFV market. Enterprises and telecom providers are increasingly adopting NFV to improve flexibility, reduce operational costs, and simplify infrastructure management. NFV allows the decoupling of network functions from proprietary hardware, leading to enhanced scalability and reduced physical hardware requirements. Telecom companies, in particular, use NFV to optimize network service delivery and improve the quality of service. The shift towards virtualization offers better network automation, enabling faster provisioning of services, which is essential in today’s rapidly evolving digital landscape.
The deployment of 5G networks is accelerating the adoption of NFV. NFV technology plays a crucial role in enabling network slicing, a key feature of 5G, where operators can create custom virtual networks for various use cases. As telecom providers transition to 5G, NFV helps support the demands of high-bandwidth applications and low-latency communication. It allows operators to efficiently allocate resources based on the specific requirements of different services and optimize network performance. This integration not only facilitates faster 5G rollouts but also enables better cost control, agility, and flexibility for telecom companies.
Cost efficiency and operational flexibility are central to NFV adoption. By virtualizing network functions, companies can reduce the need for expensive hardware, lower operational expenses, and manage network services more effectively. NFV helps businesses minimize their infrastructure investments and operational overhead, as software-based solutions replace traditional hardware appliances. Additionally, NFV enables better resource utilization, as virtualized functions can be dynamically adjusted to meet changing network demands. This flexibility is especially valuable in industries that require rapid network scalability, such as cloud service providers, data centers, and large enterprises.
Despite its numerous benefits, the integration of NFV with legacy network systems presents a challenge for many organizations. Older network infrastructures often rely on hardware-based systems, and transitioning to a software-defined environment requires significant upfront investment and a strategic overhaul. Compatibility issues between new NFV solutions and existing systems can result in implementation delays and complexity. Additionally, organizations must address concerns around system security, data integrity, and service reliability during the transition phase. However, overcoming these challenges is necessary for businesses to realize the full potential of NFV in their network management strategies.
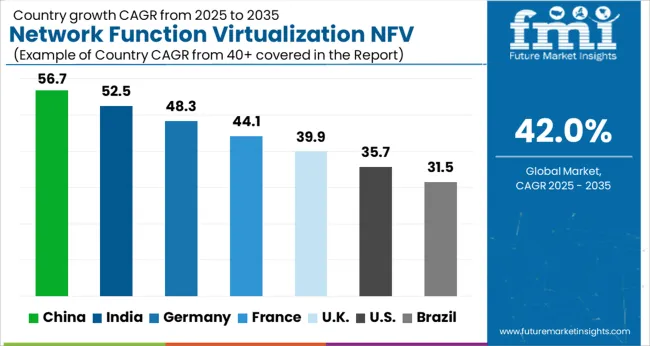
The Network Function Virtualization (NFV) market is projected to grow globally at an impressive CAGR of 42.0% from 2025 to 2035, driven by the increasing demand for cloud-based solutions, scalable networks, and digital transformation across industries. China leads with a CAGR of 56.7%, fueled by rapid technological advancements, large-scale 5G deployments, and the country's heavy investments in telecom infrastructure. India follows closely with a CAGR of 52.5%, driven by growing internet penetration, digital infrastructure expansion, and the rising adoption of NFV in telecommunications and service providers.
France grows at 44.1%, supported by the increasing demand for cloud networking solutions and NFV adoption in network operators. The United Kingdom achieves a CAGR of 39.9%, driven by increasing investments in telecom infrastructure and a growing focus on automation in network management. The United States records a CAGR of 35.7%, supported by strong demand for NFV from telecom operators, data centers, and enterprises focusing on network efficiency. This growth trajectory underscores the increasing reliance on NFV to optimize network performance, reduce costs, and enhance scalability in the telecommunications and IT sectors globally.
The UK’s NFV market grew at a CAGR of 33.2% from 2020 to 2024 and is expected to rise to 39.9% during 2025-2035. The market’s growth during 2020-2024 was moderate, driven by the increasing need for efficient, scalable, and cost-effective telecom networks, as well as rising investments in cloud infrastructure and 5G technology. The expected rise in the coming decade is due to the acceleration of 5G adoption, ongoing digital transformation, and the growing demand for more agile and flexible network management solutions. As the UK continues to invest heavily in cloud services, telecom modernization, and network automation, the NFV market is poised for higher growth, supported by both government and private sector investments. Additionally, the rise of network slicing and virtualized network functions will further fuel the adoption of NFV solutions in the UK.
China’s NFV market is projected to grow at a CAGR of 56.7% during 2025-2035, exceeding the global CAGR of 42.0%. The market grew at a CAGR of 47.2% during 2020-2024, driven by China’s ambitious 5G rollout, growing demand for cloud-based solutions, and large-scale investments in telecom infrastructure. The next decade will witness a significant rise in NFV adoption due to the Chinese government's commitment to digital transformation, the development of smart cities, and the increasing adoption of 5G technologies across industries. As Chinese telecom providers and enterprises embrace NFV to enable more flexible, scalable, and efficient networks, demand for NFV solutions will continue to accelerate.
India’s NFV market is expected to grow at a CAGR of 52.5% from 2025 to 2035, significantly higher than the global average of 42.0%. The market grew at a CAGR of 44.2% during 2020-2024, driven by the expansion of telecom infrastructure, rising internet penetration, and the adoption of 4G and 5G technologies. The market's growth in the coming decade will be fueled by India’s focus on digital transformation, the rise of cloud services, and the increasing demand for more agile, efficient, and flexible networks. Additionally, as Indian telecom providers upgrade their infrastructure to meet the demand for 5G, NFV will play a critical role in modernizing and optimizing networks.
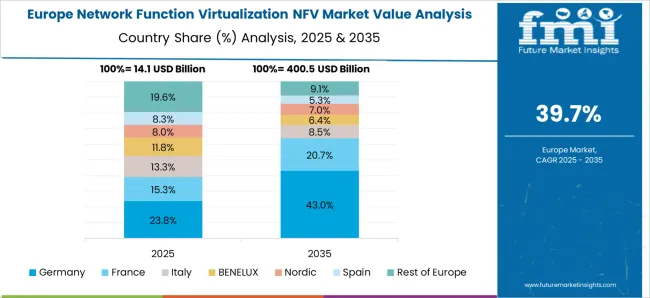
France’s NFV market is projected to grow at a CAGR of 44.1% during 2025-2035. The market grew at a CAGR of 35.8% during 2020-2024, driven by the country’s investments in telecom modernization, the adoption of cloud-based services, and the increasing need for scalable, flexible network infrastructure. The acceleration in the coming decade is attributed to France’s focus on the development of 5G networks, the rise of smart cities, and growing demand for virtualized network functions in telecommunications and other sectors. As France continues to invest in NFV to enable agile, cost-effective, and efficient network management, the market for NFV will see rapid expansion in the next few years.
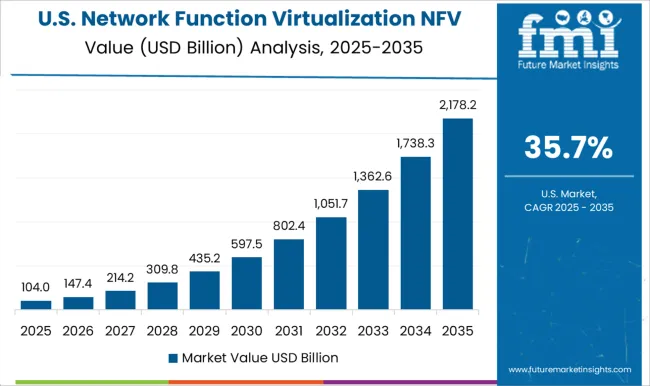
The USA NFV market is projected to grow at a CAGR of 35.7% during 2025-2035. The market grew at a CAGR of 28.5% during 2020-2024, supported by increasing demand for flexible, scalable, and efficient network solutions in both telecom and enterprise sectors. The growth in the next decade will be driven by the adoption of 5G technologies, digital transformation efforts, and a growing shift toward cloud-based services and network automation. As telecom providers and businesses continue to embrace NFV to improve network agility and reduce operational costs, the demand for NFV solutions will continue to rise.
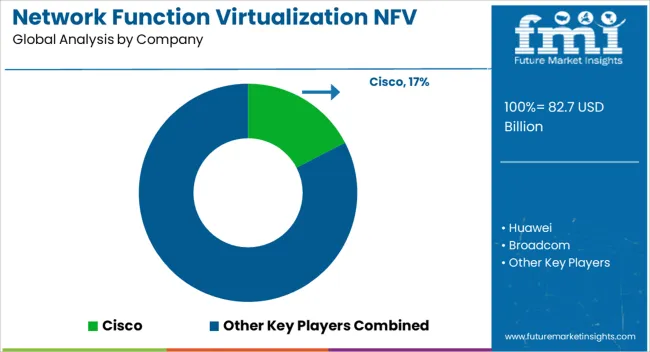
The Network Function Virtualization (NFV) Market is shaped by key players such as Cisco, Huawei, and Ericsson, who lead the competition with their comprehensive portfolio of networking solutions, virtualization technologies, and robust service offerings. Cisco is known for its high-performance NFV solutions that offer scalable network automation and service delivery across various industries, including telecom and enterprise sectors.
Huawei excels with its advanced NFV infrastructure and services, enabling efficient deployment and management of virtualized network functions in both public and private cloud environments. Ericsson provides cutting-edge NFV solutions for telecom operators, focusing on improving network flexibility, reducing operational costs, and supporting 5G network slicing capabilities. Other prominent players like Juniper, AT&T, and Nokia emphasize the importance of performance and reliability in their NFV offerings, delivering network automation, virtualized security, and high-quality service orchestration to telecom providers.
F5 Networks and Citrix specialize in virtualized application delivery controllers, providing efficient traffic management and security for NFV environments. Companies such as Riverbed, 6Wind, and VMware focus on providing high-performance virtualized infrastructure and network management solutions, ensuring seamless operation and scaling of NFV systems.
Companies like Verizon, Pluribus, and Arista are gaining traction with their innovative solutions for SDN and NFV integration, enabling seamless and flexible network management for service providers. Amdocs, NFWare, and IBM contribute to the NFV ecosystem by providing enhanced management, orchestration, and virtualization platforms tailored for telecom and enterprise service providers, ensuring efficient service delivery and optimized network performance.
Leading players in the NFV market are forming strategic partnerships and engaging in acquisitions to expand their NFV offerings. For example, Cisco and Juniper Networks are partnering with cloud providers to enhance NFV solutions that can be seamlessly integrated into public and private clouds. These collaborations are helping to accelerate the development of 5G networks and edge computing services.
| Item | Value |
|---|---|
| Quantitative Units | USD 82.7 Billion |
| Component | NFV servers, Hardware, Storage, Switches, Software, NFV MANO, VNF software, Service, Training and consulting, Integration and maintenance, and Managed service |
| Application | IT & Telecom, BFSI, Healthcare, Retail & consumer goods, Government, Manufacturing, and Other applications |
| Regions Covered | North America, Europe, Asia-Pacific, Latin America, Middle East & Africa |
| Country Covered | United States, Canada, Germany, France, United Kingdom, China, Japan, India, Brazil, South Africa |
| Key Companies Profiled | Cisco, Huawei, Broadcom, Ericsson, Juniper, AT&T, Nokia, F5 Networks, HP, Citrix, Riverbed, 6Wind, VMware, Verizon, Pluribus, Arista, Amdocs, NFWare, and IBM |
| Additional Attributes | Dollar sales, market share of top players, growth projections, demand drivers across sectors like telecom and enterprise, regulatory impact, technological innovations, and competitive landscape analysis. |


Our Research Products

The "Full Research Suite" delivers actionable market intel, deep dives on markets or technologies, so clients act faster, cut risk, and unlock growth.

The Leaderboard benchmarks and ranks top vendors, classifying them as Established Leaders, Leading Challengers, or Disruptors & Challengers.

Locates where complements amplify value and substitutes erode it, forecasting net impact by horizon

We deliver granular, decision-grade intel: market sizing, 5-year forecasts, pricing, adoption, usage, revenue, and operational KPIs—plus competitor tracking, regulation, and value chains—across 60 countries broadly.

Spot the shifts before they hit your P&L. We track inflection points, adoption curves, pricing moves, and ecosystem plays to show where demand is heading, why it is changing, and what to do next across high-growth markets and disruptive tech

Real-time reads of user behavior. We track shifting priorities, perceptions of today’s and next-gen services, and provider experience, then pace how fast tech moves from trial to adoption, blending buyer, consumer, and channel inputs with social signals (#WhySwitch, #UX).

Partner with our analyst team to build a custom report designed around your business priorities. From analysing market trends to assessing competitors or crafting bespoke datasets, we tailor insights to your needs.
Supplier Intelligence
Discovery & Profiling
Capacity & Footprint
Performance & Risk
Compliance & Governance
Commercial Readiness
Who Supplies Whom
Scorecards & Shortlists
Playbooks & Docs
Category Intelligence
Definition & Scope
Demand & Use Cases
Cost Drivers
Market Structure
Supply Chain Map
Trade & Policy
Operating Norms
Deliverables
Buyer Intelligence
Account Basics
Spend & Scope
Procurement Model
Vendor Requirements
Terms & Policies
Entry Strategy
Pain Points & Triggers
Outputs
Pricing Analysis
Benchmarks
Trends
Should-Cost
Indexation
Landed Cost
Commercial Terms
Deliverables
Brand Analysis
Positioning & Value Prop
Share & Presence
Customer Evidence
Go-to-Market
Digital & Reputation
Compliance & Trust
KPIs & Gaps
Outputs
Full Research Suite comprises of:
Market outlook & trends analysis
Interviews & case studies
Strategic recommendations
Vendor profiles & capabilities analysis
5-year forecasts
8 regions and 60+ country-level data splits
Market segment data splits
12 months of continuous data updates
DELIVERED AS:
PDF EXCEL ONLINE
Analyzing Network Function Virtualization (NFV) Market Share & Industry Leaders
Network Function Virtualization (NFV) Market by Component, by Enterprise Size and by End User & Region Forecast till 2035
UK Network Function Virtualization (NFV) Market Insights – Demand, Size & Industry Trends 2025-2035
GCC Network Function Virtualization (NFV) Market Report – Trends & Innovations 2025-2035
USA Network Function Virtualization (NFV) Market Insights – Size, Share & Growth 2025-2035
Japan Network Function Virtualization (NFV) Market Trends – Growth, Demand & Forecast 2025-2035
Germany Network Function Virtualization (NFV) Market Analysis – Size, Share & Forecast 2025-2035
Software Defined Networking (SDN) And Network Function Virtualization (NFV) Market Size and Share Forecast Outlook 2025 to 2035
Network Simulator Software Market Size and Share Forecast Outlook 2025 to 2035
Network Connectivity Tester Market Size and Share Forecast Outlook 2025 to 2035
Network Analyzers Market Size and Share Forecast Outlook 2025 to 2035
Network as a Service (NaaS) Market Size and Share Forecast Outlook 2025 to 2035
Network Analytics Market Size and Share Forecast Outlook 2025 to 2035
Network Devices Market Size and Share Forecast Outlook 2025 to 2035
Network Sandboxing Market Size and Share Forecast Outlook 2025 to 2035
Network Access Control (NAC) Market Size and Share Forecast Outlook 2025 to 2035
Network Monitoring Market Size and Share Forecast Outlook 2025 to 2035
Network Encryption Market Size and Share Forecast Outlook 2025 to 2035
Network Packet Broker Market Size and Share Forecast Outlook 2025 to 2035
Network Traffic Analytics Market Size and Share Forecast Outlook 2025 to 2035

Thank you!
You will receive an email from our Business Development Manager. Please be sure to check your SPAM/JUNK folder too.
Chat With
MaRIA