Cordless Sanders Market Size and Share Forecast Outlook 2025 to 2035

The global cordless sanders market is projected to reach a value of USD 2.6 billion by 2035, rising from USD 1.5 billion in 2025. This represents an absolute growth of USD 1.1 billion over the forecast period, translating to a 73.3% increase in value. The market is expected to grow at a CAGR of 5.4%, with the total size expanding nearly 1.73X by the end of the decade.
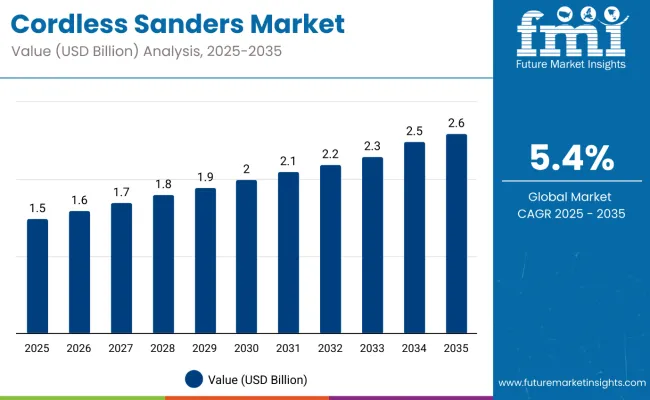
Quick Stats For Cordless Sanders Market

  • Industry Value (2025): USD 1.5 billion
  • Forecast Value (2035): USD 2.6 billion
  • Forecast CAGR: 5.4%
  • Leading Segment (2025): Random Orbital Sanders (30% share)
  • Key Growth Region: China, United States
  • Top Key Players: TTI, DeWalt, Festool GmbH, Makita, Koki Holdings Co.

Cordless Sander Market

Metric Value
Industry Size (2025E) USD 1.5 billion
Industry Size (2035F) USD 2.6 billion
CAGR (2025-2035) 5.4%

From 2025 to 2030, the market is projected to rise from USD 1.5 billion to USD 2.0 billion, led by increased adoption of brushless motor tools, compact form factors, and battery pack innovations. Residential DIY trends, furniture refurbishing, and cordless flexibility in confined spaces are encouraging user migration from corded to cordless formats.

Between 2030 and 2035, the market is forecast to grow from USD 2.0 billion to USD 2.6 billion, adding another USD 0.6 billion. Growth during this period is likely to stem from new product launches with smart battery systems, ergonomic design improvements, and expanded use across commercial vehicle body shops, woodcraft SMEs, and specialty metal finishing contractors.

Between 2020 and 2025, the cordless sanders market expanded steadily from USD 1.2 billion to USD 1.5 billion, reflecting a value addition of USD 300 million and an annualized growth rate of approximately 4.6%. This period marked the gradual shift of sanding applications from corded and pneumatic systems to battery-powered tools across residential, commercial, and light-industrial sectors.

The COVID-19 pandemic temporarily disrupted the supply of lithium-ion cells and power tool components during 2020 and early 2021. However, pent-up demand from home improvement projects and the rapid growth of online tool retail helped stabilize volumes. DIY professionals and contractors increasingly adopted cordless sanders for interior wood finishing, drywall work, and painted surface preparation, encouraged by compact tool designs and reduced setup times.

Manufacturers responded with enhanced offerings that included variable speed controls, dust extraction systems, and high-efficiency motors. The steady decline in battery prices and improvements in charging efficiency supported broader product penetration across developed markets in North America, Europe, and Japan.

Why the Cordless Sanders Market is Growing?

The growth of the cordless sanders market is being propelled by a confluence of user-centric design improvements, enhanced battery performance, and rising demand for flexible power tools across consumer and professional segments. End users are increasingly prioritizing maneuverability, reduced setup time, and safe operation attributes where cordless sanders offer significant advantages over their corded counterparts.

The widespread availability of lithium-ion batteries with faster charging times, longer runtimes, and higher energy densities has removed major performance limitations, enabling users to execute prolonged sanding tasks without frequent recharging. Manufacturers are investing in brushless motor technology and ergonomic tool housings, making cordless sanders more appealing for use in cabinetry, furniture making, auto refinishing, and construction.

The DIY culture, reinforced by increased home renovation activities and digital tool-buying platforms, has led to a surge in consumer adoption of cordless tools. Parallelly, construction contractors and renovation professionals are integrating cordless sanders into standard toolkits to improve on-site productivity and reduce dependency on external power sources.

Segmentation Overview

The cordless sander market is segmented by product type into orbital, random orbital, belt, detail, and spindle sanders, reflecting varying use-cases from coarse sanding to intricate detailing. Power source segmentation includes battery-powered, rechargeable, cordless electric, and gas-powered options, each supporting distinct runtime and torque requirements. End-user applications span professional contractors, woodworking and carpentry, automobile restoration, metal fabrication, construction, and DIY users, reflecting a wide application footprint across industries and user expertise levels.
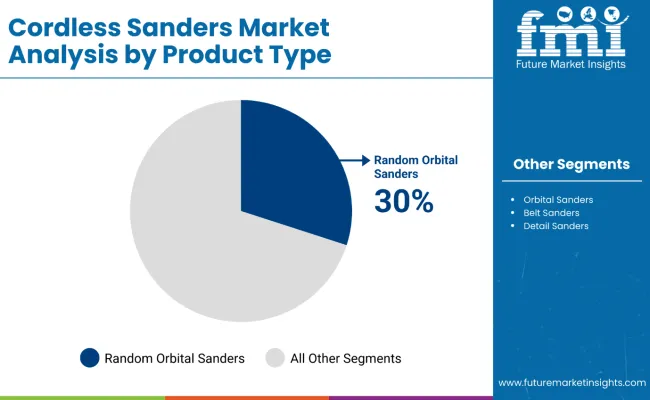
Random orbital sanders continue to dominate precision finishing applications

Cordless Sander Market By Product

Random orbital sanders are projected to account for 30% of global demand in 2025 and are expected to grow at a CAGR of 5.9% through 2035. Their ability to deliver a swirl-free finish makes them ideal for both professional and hobbyist users. The segment benefits from increasing demand in surface preparation, particularly in furniture making, cabinetry, and auto refinishing. Enhanced motor design, dust collection systems, and variable speed control features are being adopted widely. Manufacturers are also offering compact, ergonomic designs to reduce operator fatigue, supporting increased uptake in fine finishing tasks.
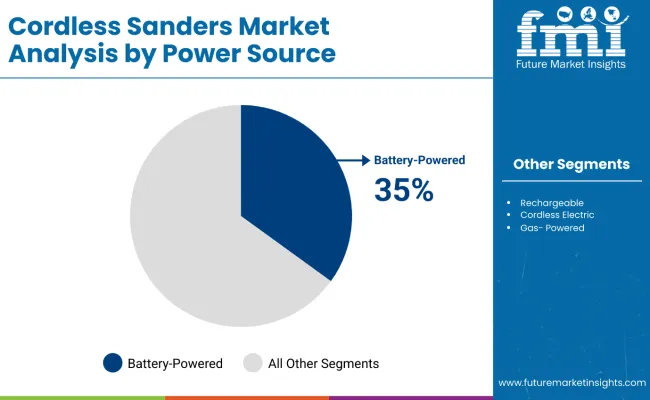
Battery-powered variants are preferred for cordless operation across work sites

Cordless Sander Market By Power Source

Battery-powered sanders are estimated to command 35% of the global market in 2025 and are forecast to expand at a CAGR of 6.1% over the next decade. Their growing popularity is attributed to the convenience of cable-free operation, enhanced runtime, and portability. Integration of lithium-ion batteries has significantly improved performance and operational time. Contractors and professional users increasingly favor these models for their ability to deliver consistent torque and maneuverability in jobsite conditions. Universal battery platforms across tool ecosystems are further encouraging wider adoption.
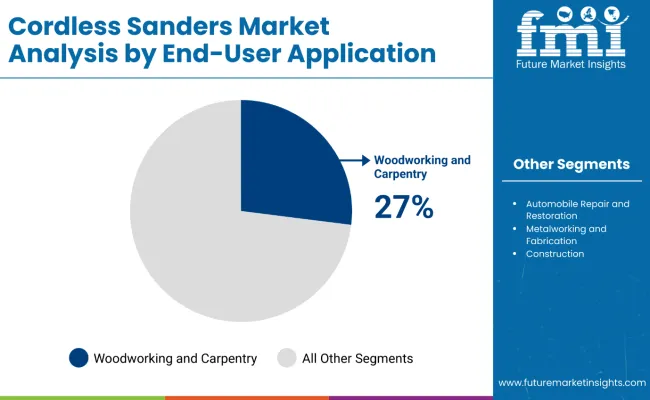
Woodworking and carpentry remains the largest end-user application

Cordless Sander Market By End User

Woodworking and carpentry are expected to represent 27% of market share in 2025, growing at a CAGR of 6.0% through 2035. These applications involve sanding of furniture, cabinetry, trim, and wood panels where cordless mobility improves workflow and reduces downtime. Demand is supported by growth in renovation and interior woodwork activities. High-precision models with low vibration and dust control are being adopted by craftsmen and small-scale manufacturers. Increasing DIY activity in developed regions is also contributing to the consistent demand in this segment.

Key Trends Shaping the Market

The cordless sanders market is witnessing consistent expansion due to increasing product innovation, battery advancements, and changing consumer preferences favoring mobility and ease of use. However, growth is tempered by limitations in continuous usage time and higher upfront costs compared to corded tools. Industry players are navigating challenges around heat generation, torque delivery, and application-specific power needs while ensuring product durability across diverse end-user segments.

Lithium-Ion Battery Optimization Drives Long-Term Adoption

The integration of high-capacity lithium-ion batteries into cordless sanders is enabling longer runtime, consistent torque, and faster charging factors that are significantly improving user experience across both DIY and professional use cases. Battery packs with smart management systems are gaining traction in premium models, supporting sustained demand in compact job sites and renovation projects.

DIY and Home Renovation Culture Influencing Market Expansion

A growing preference for self-service home improvement, fueled by online tutorials and e-commerce availability, is contributing to the increasing sales of cordless sanders among homeowners. Lightweight models with variable speed settings and dust collection features are appealing to consumers seeking professional-grade results without outsourcing.

Tool Integration and Modular Compatibility Enhance Commercial Usage

Contractors are opting for cordless sander models that integrate seamlessly into modular battery platforms shared across tool ecosystems. This trend is being reinforced by power tool manufacturers offering cross-compatible battery packs for drills, grinders, and sanders, reducing inventory complexity and total ownership costs for professionals.

Europe Market Split by Country

Countries 2025 Share
Germany 30%
UK 18%
France 15%
Italy 10%
Spain 8%
BENELUX 7%
Russia 4%
Rest of Europe 8%
Countries 2035 Share
Germany 28%
UK 17%
France 16%
Italy 11%
Spain 9%
BENELUX 8%
Russia 3%
Rest of Europe 8%

The European cordless sanders market is expected to grow from USD 293.3 million in 2025 to USD 482.3 million by 2035, reflecting a CAGR of 5.1%. Germany will continue to lead the regional market with a projected 28% share in 2035, driven by high adoption of battery-powered hand tools in the professional woodworking and furniture segments. The United Kingdom is estimated to hold 17% share, supported by strong DIY uptake and e-commerce-based distribution.

France is forecast to slightly increase its share to 16%, backed by state-backed energy-efficient home renovation programs. Italy and Spain are expected to see moderate growth from 10% and 8% in 2025 to 11% and 9% by 2035 respectively, with rising penetration in residential refurbishing and artisan workshops. BENELUX countries will improve their regional share to 8%, while Russia’s share is set to decline to 3% due to trade and import constraints.
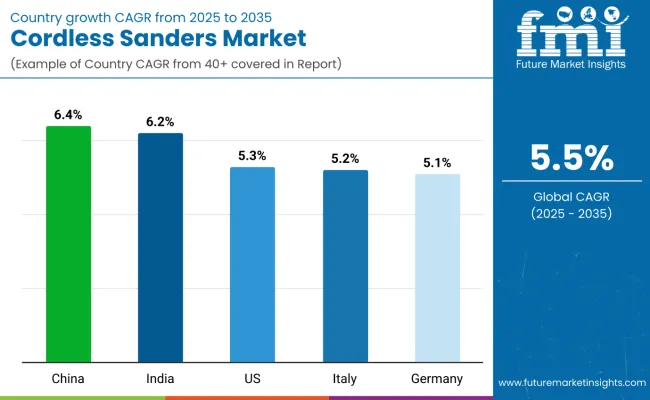
Key Countries Growth Outlook

Cordless Sander Market By Country

Cordless sanders gain popularity in China with growing demand from furniture, construction, and consumer DIY markets

China is expected to lead growth in the cordless sanders market between 2025 and 2035. The expansion of domestic tool manufacturers, combined with strong retail and e-commerce penetration, is driving high product visibility across urban and semi-urban clusters. Local players are introducing low-cost cordless models targeting furniture and renovation professionals.

  • Domestic tool manufacturers are expanding distribution through e-commerce.
  • DIY trends are rising in middle-income households and youth demographics.
  • Localized innovation in battery performance is fueling usage in rural construction.
  • Urban renovation schemes are pushing the demand for ergonomic cordless tools.
  • Cordless sander exports are also growing due to low-cost advantages.

India witnesses strong uptake of cordless sanders as battery-operated tools penetrate semi-professional and urban household segments

India is poised for rapid adoption of cordless sanders, supported by MSME growth, infrastructure investments, and availability of compact power tools across offline and online platforms. Construction contractors and small-scale furniture makers are transitioning to battery-powered sanding solutions due to inconsistent power supply in several regions.
  • Retail distribution of global brands is deepening across Tier-2 and Tier-3 cities.
  • State-level skill development programs are enabling tradesmen to use cordless tools.
  • Domestic manufacturers are launching affordable lithium-based tool kits.
  • Portable tool demand is rising among interior contractors and carpenters.
  • Service life improvements in batteries are increasing adoption in dusty environments.

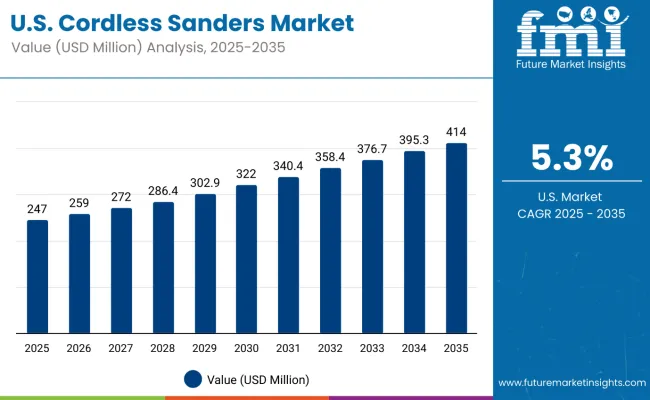
The USA market for cordless sanders expands steadily, supported by professional-grade innovations and refurbishment activities

Cordless Sander Market Usa

The USA cordless sanders market continues to grow steadily, driven by a well-established consumer base, frequent DIY renovations, and commercial contractor upgrades. Innovation in brushless motor designs and universal battery compatibility is helping increase replacement cycles. Retail promotions and bundled tool kits are contributing to volume sales.

  • Cordless tools are replacing pneumatic and corded sanders in commercial settings.
  • Users demand enhanced dust control and lightweight form factors.
  • Leading brands offer warranty-backed ecosystem tools for workshop consolidation.
  • E-commerce platforms drive recurring purchases through bundled discounts.
  • The aftermarket for battery packs and accessories remains highly profitable.

Italy continues to rely on compact cordless sanders in woodcraft, metal finishing, and artisanal exports

Italy represents a moderately growing market driven by construction SMEs, traditional carpentry businesses, and home restoration services. Users seek cordless sanders for precision work, noise-sensitive environments, and off-grid operations. Local demand is shifting from corded to compact battery-powered variants, especially in woodwork-heavy regions.

  • Professional usage dominates in interior finishing and cabinetry services.
  • Growth in battery runtime is encouraging shift from plug-in models.
  • Retailers emphasize ergonomic design and easy control in product pitches.
  • Workshop mobility and plug-free operation are cited as key buyer priorities.
  • Regional artisans and contractors prefer European-certified cordless models.

Germany maintains stable demand for cordless sanders across carpentry, automotive refinishing, and interior installations

Germany remains one of the most advanced markets for cordless sanders, driven by precision engineering demand, active renovation cycles, and robust retail channels. Professional woodworkers and manufacturing technicians increasingly favor cordless systems with interchangeable batteries. Integration with smart diagnostics is also gaining traction in B2B sales.

  • Contractors prefer German-built models for consistency and runtime accuracy.
  • Brands emphasize user safety, vibration control, and dust extraction features.
  • Retailers report steady growth in cordless kit purchases by prosumers.
  • Renovation subsidies and energy-efficient home upgrades aid tool sales.
  • Higher investment in sustainable manufacturing also affects procurement preferences.

Battery-powered models dominate Japan's cordless sanding landscape

In Japan, battery-powered sanders account for 65% of the cordless sander market in 2025, driven by high portability needs in home improvement, modular furniture assembly, and electronics casing applications. The demand for rechargeable sanders, which hold a 20% share, is also growing among semi-professional users in small workshops and residential renovation setups. Cordless electric sanders, while limited to 10%, find favor in constrained indoor spaces that benefit from low-noise operations. Gas-powered sanders, with just 5% share, are primarily used in niche industrial restoration projects where consistent high-torque output is essential.

  • Rising demand from compact home renovation and tool rental platforms
  • Preference for brushless motor variants with fast recharge cycles
  • Retailers focus on lightweight, ergonomic sanding tools suited for apartment use
  • Japan's space efficiency and tech-driven design sensibility support cordless growth

South Korea sees diverse application across professional and consumer segments

South Korea's cordless sander market is characterized by a balanced application profile. Professional contractors form the largest segment at 30%, using sanders for finishing tasks in interior and exterior worksites. Woodworking and carpentry applications command 20% share, with high-end sanders used in precision wood shaping. The automobile repair and restoration segment holds 15%, leveraging compact sanders for body refinishing. Construction accounts for another 15%, followed by metalworking and fabrication (10%) and DIY enthusiasts (10%), who are increasingly adopting cordless tools through e-commerce and lifestyle retail.
  • Multi-functional sanders bundled with smart batteries gaining ground
  • Increasing investment in workshop upgrades and mobile jobsite kits
  • K-DIY and maker culture fueling consumer-grade cordless sanding tools
  • Growth supported by Korean brands innovating around motor efficiency and dust control

Competition Outlook

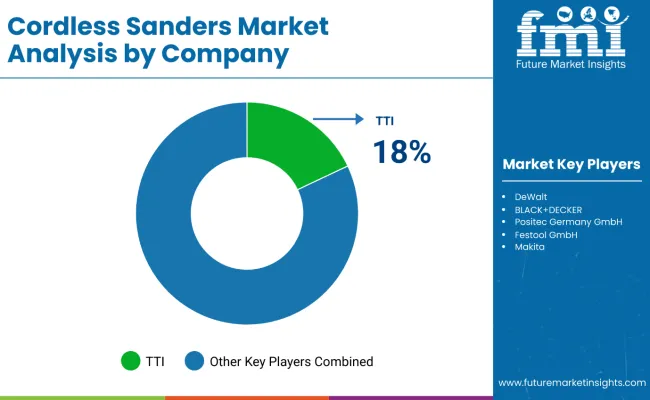
Cordless Sander Market By Company

Competition in the cordless sanders market is being driven by the introduction of feature-rich, high-performance tools. New launches are focusing on enhancing jobsite efficiency, user comfort, and precision through innovations such as integrated LED lighting, variable speed control, and multi-mode sanding capabilities.

Cordless designs are being optimized to match or surpass corded performance, targeting professionals in woodworking, automotive body shops, and remodeling sectors. Manufacturers are emphasizing ergonomics, portability, and versatility to differentiate offerings, while continual improvements in battery technology and power management are enabling longer runtimes and consistent output.

  • In May 2025, Festool launched its first cordless sander featuring an integrated LED light system to improve sanding visibility and surface precision. The product is designed to enhance jobsite efficiency for professionals in woodworking, remodeling, and painting sectors.
  • In May 2024, Evergrade introduced two new cordless sanders optimized for body shop environments. These models were designed to reduce hand fatigue, offer variable speed control, and support multiple sanding modes for detailed finishing work.
  • In January 2024, Ridgid released a new range of cordless sanders under its 18V power tool lineup. The models include random orbital and quarter-sheet variants, aimed at professionals and serious DIYers looking for cord-free convenience with performance comparable to corded tools.

Companies

  • TTI
  • DeWalt
  • BLACK+DECKER
  • Positec Germany GmbH
  • Festool GmbH
  • Makita
  • Koki Holdings Co.
  • Greenworks

Scope of the Report

Item Value
Quantitative Units USD 1.5 Billion (2025)
By Product Type Orbital Sanders, Random Orbital Sanders, Belt Sanders, Detail Sanders, Spindle Sanders
By Power Source Battery-powered Sanders, Rechargeable Sanders, Cordless Electric Sanders, Gas-powered Sanders
By End-User Application Professional Contractors, Woodworking and Carpentry, Automobile Repair and Restoration, Metalworking and Fabrication, Construction, DIY Enthusiasts
Regions Covered North America, Europe, East Asia, South Asia & Pacific, Latin America, Middle East & Africa
Countries Covered United States, Germany, United Kingdom, Japan, South Korea
Key Companies Profiled Makita Corporation, Stanley Black & Decker, Bosch Power Tools, Techtronic Industries Co. Ltd. (TTI), Festool GmbH, Hilti Group, Metabo, Positec Group, Ryobi Tools, WORX

Key Segments

By Product Types:

  • Orbital Sanders
  • Random Orbital Sanders
  • Belt Sanders
  • Detail Sanders
  • Spindle Sanders

By Power Source Types:

  • Battery-powered Sanders
  • Rechargeable Sanders
  • Cordless Electric Sanders

By End User Application:

  • Professional Contractors
  • Woodworking and Carpentry
  • Automobile Repair and Restoration
  • Metalworking and Fabrication
  • Construction
  • DIY Enthusiasts

By Enterprise Size:

  • Large Enterprises
  • Small & Medium-sized Enterprises (SMEs)

By Region:

  • North America
  • Latin America
  • Western Europe
  • Eastern Europe
  • East Asia
  • South Asia & Pacific
  • Middle East & Africa

Table of Content

  1. Executive Summary
    • Global Market Outlook
    • Demand-side Trends
    • Supply-side Trends
    • Technology Roadmap Analysis
    • Analysis and Recommendations
  2. Market Overview
    • Market Coverage / Taxonomy
    • Market Definition / Scope / Limitations
  3. Market Background
    • Market Dynamics
      • Drivers
      • Restraints
      • Opportunity
      • Trends
    • Scenario Forecast
      • Demand in Optimistic Scenario
      • Demand in Likely Scenario
      • Demand in Conservative Scenario
    • Key Success Factors
    • Industry Developments
    • Supply Chain Analysis
      • Sourcing and Procurement
        • Raw Material / Component Suppliers
        • Technology Providers
      • Product Manufacturers
      • Channel Partners
      • End Users / Customers
    • Market Assessment Factors
      • Macro-economic Factors
      • Forecast Factors
  4. 3.10. Parent Market Outlook
  5. Global Market Analysis 2020 to 2024 and Forecast, 2025 to 2035
    • Historical Market Size Value (USD Billion) Analysis, 2020 to 2024
    • Current and Future Market Size Value (USD Billion) Projections, 2025 to 2035
      • Y-o-Y Growth Trend Analysis
      • Absolute $ Opportunity Analysis
  6. Global Market Pricing Analysis 2020 to 2024 and Forecast 2025 to 2035
  7. Global Market Analysis 2020 to 2024 and Forecast 2025 to 2035, By Product Types
    • Introduction / Key Findings
    • Historical Market Size Value (USD Billion) Analysis By Product Types, 2020 to 2024
    • Current and Future Market Size Value (USD Billion) Analysis and Forecast By Product Types, 2025 to 2035
      • Orbital Sanders
      • Random Orbital Sanders
      • Belt Sanders
      • Detail Sanders
      • Spindle Sanders
    • Y-o-Y Growth Trend Analysis By Product Types, 2020 to 2024
    • Absolute $ Opportunity Analysis By Product Types, 2025 to 2035
  8. Global Market Analysis 2020 to 2024 and Forecast 2025 to 2035, By Power Source Types
    • Introduction / Key Findings
    • Historical Market Size Value (USD Billion) Analysis By Power Source Types , 2020 to 2024
    • Current and Future Market Size Value (USD Billion) Analysis and Forecast By Power Source Types , 2025 to 2035
      • Battery-powered Sanders
      • Rechargeable Sanders
      • Cordless Electric Sanders
    • Y-o-Y Growth Trend Analysis By Power Source Types , 2020 to 2024
    • Absolute $ Opportunity Analysis By Power Source Types , 2025 to 2035
  9. Global Market Analysis 2020 to 2024 and Forecast 2025 to 2035, By End User Application
    • Introduction / Key Findings
    • Historical Market Size Value (USD Billion) Analysis By End User Application , 2020 to 2024
    • Current and Future Market Size Value (USD Billion) Analysis and Forecast By End User Application , 2025 to 2035
      • Professional Contractors
      • Woodworking and Carpentry
      • Automobile Repair and Restoration
      • Metalworking and Fabrication
      • Construction
      • DIY Enthusiasts
    • Y-o-Y Growth Trend Analysis By End User Application , 2020 to 2024
    • Absolute $ Opportunity Analysis By End User Application , 2025 to 2035
  10. Global Market Analysis 2020 to 2024 and Forecast 2025 to 2035, By Enterprise Size
    • Introduction / Key Findings
    • Historical Market Size Value (USD Billion) Analysis By Enterprise Size, 2020 to 2024
    • Current and Future Market Size Value (USD Billion) Analysis and Forecast By Enterprise Size, 2025 to 2035
      • Large Enterprises
      • Small & Medium-sized Enterprises (SMEs)
    • Y-o-Y Growth Trend Analysis By Enterprise Size, 2020 to 2024
    • Absolute $ Opportunity Analysis By Enterprise Size, 2025 to 2035
  11. Global Market Analysis 2020 to 2024 and Forecast 2025 to 2035, By Region
    • Introduction
    • Historical Market Size Value (USD Billion) Analysis By Region, 2020 to 2024
    • Current Market Size Value (USD Billion) Analysis and Forecast By Region, 2025 to 2035
      • North America
      • Latin America
      • Western Europe
      • Eastern Europe
      • East Asia
      • South Asia & Pacific
      • Middle East & Africa
    • Market Attractiveness Analysis By Region
  12. North America Market Analysis 2020 to 2024 and Forecast 2025 to 2035, By Country
    • Historical Market Size Value (USD Billion) Trend Analysis By Market Taxonomy, 2020 to 2024
    • Market Size Value (USD Billion) Forecast By Market Taxonomy, 2025 to 2035
      • By Country
        • USA
        • Canada
        • Mexico
      • By Product Types
      • By Power Source Types
      • By End User Application
      • By Enterprise Size
    • Market Attractiveness Analysis
      • By Country
      • By Product Types
      • By Power Source Types
      • By End User Application
      • By Enterprise Size
    • Key Takeaways
  13. Latin America Market Analysis 2020 to 2024 and Forecast 2025 to 2035, By Country
    • Historical Market Size Value (USD Billion) Trend Analysis By Market Taxonomy, 2020 to 2024
    • Market Size Value (USD Billion) Forecast By Market Taxonomy, 2025 to 2035
      • By Country
        • Brazil
        • Argentina
        • Rest of Latin America
      • By Product Types
      • By Power Source Types
      • By End User Application
      • By Enterprise Size
    • Market Attractiveness Analysis
      • By Country
      • By Product Types
      • By Power Source Types
      • By End User Application
      • By Enterprise Size
    • Key Takeaways
  14. Western Europe Market Analysis 2020 to 2024 and Forecast 2025 to 2035, By Country
    • Historical Market Size Value (USD Billion) Trend Analysis By Market Taxonomy, 2020 to 2024
    • Market Size Value (USD Billion) Forecast By Market Taxonomy, 2025 to 2035
      • By Country
        • Germany
        • Italy
        • France
        • UK
        • Spain
        • BENELUX
        • Nordics
        • Rest of W. Europe
      • By Product Types
      • By Power Source Types
      • By End User Application
      • By Enterprise Size
    • Market Attractiveness Analysis
      • By Country
      • By Product Types
      • By Power Source Types
      • By End User Application
      • By Enterprise Size
    • Key Takeaways
  15. Eastern Europe Market Analysis 2020 to 2024 and Forecast 2025 to 2035, By Country
    • Historical Market Size Value (USD Billion) Trend Analysis By Market Taxonomy, 2020 to 2024
    • Market Size Value (USD Billion) Forecast By Market Taxonomy, 2025 to 2035
      • By Country
        • Hungary
        • Poland
        • Russia
        • Balkan & Baltics
        • Rest of E.Europe
      • By Product Types
      • By Power Source Types
      • By End User Application
      • By Enterprise Size
    • Market Attractiveness Analysis
      • By Country
      • By Product Types
      • By Power Source Types
      • By End User Application
      • By Enterprise Size
    • Key Takeaways
  16. East Asia Market Analysis 2020 to 2024 and Forecast 2025 to 2035, By Country
    • Historical Market Size Value (USD Billion) Trend Analysis By Market Taxonomy, 2020 to 2024
    • Market Size Value (USD Billion) Forecast By Market Taxonomy, 2025 to 2035
      • By Country
        • China
        • Japan
        • South Korea
      • By Product Types
      • By Power Source Types
      • By End User Application
      • By Enterprise Size
    • Market Attractiveness Analysis
      • By Country
      • By Product Types
      • By Power Source Types
      • By End User Application
      • By Enterprise Size
    • Key Takeaways
  17. South Asia & Pacific Market Analysis 2020 to 2024 and Forecast 2025 to 2035, By Country
    • Historical Market Size Value (USD Billion) Trend Analysis By Market Taxonomy, 2020 to 2024
    • Market Size Value (USD Billion) Forecast By Market Taxonomy, 2025 to 2035
      • By Country
        • India
        • ASEAN
        • Australia & New Zealand
      • By Product Types
      • By Power Source Types
      • By End User Application
      • By Enterprise Size
    • Market Attractiveness Analysis
      • By Country
      • By Product Types
      • By Power Source Types
      • By End User Application
      • By Enterprise Size
    • Key Takeaways
  18. Middle East & Africa Market Analysis 2020 to 2024 and Forecast 2025 to 2035, By Country
    • Historical Market Size Value (USD Billion) Trend Analysis By Market Taxonomy, 2020 to 2024
    • Market Size Value (USD Billion) Forecast By Market Taxonomy, 2025 to 2035
      • By Country
        • GCC Countries
        • Turkiye
        • Northern Africa
        • South Africa
        • Rest of MEA
      • By Product Types
      • By Power Source Types
      • By End User Application
      • By Enterprise Size
    • Market Attractiveness Analysis
      • By Country
      • By Product Types
      • By Power Source Types
      • By End User Application
      • By Enterprise Size
    • Key Takeaways
  19. Key Countries Market Analysis
    • USA
      • Pricing Analysis
      • Market Share Analysis, 2024
        • By Product Types
        • By Power Source Types
        • By End User Application
        • By Enterprise Size
    • Canada
      • Pricing Analysis
      • Market Share Analysis, 2024
        • By Product Types
        • By Power Source Types
        • By End User Application
        • By Enterprise Size
    • Mexico
      • Pricing Analysis
      • Market Share Analysis, 2024
        • By Product Types
        • By Power Source Types
        • By End User Application
        • By Enterprise Size
    • Brazil
      • Pricing Analysis
      • Market Share Analysis, 2024
        • By Product Types
        • By Power Source Types
        • By End User Application
        • By Enterprise Size
    • Argentina
      • Pricing Analysis
      • Market Share Analysis, 2024
        • By Product Types
        • By Power Source Types
        • By End User Application
        • By Enterprise Size
    • Germany
      • Pricing Analysis
      • Market Share Analysis, 2024
        • By Product Types
        • By Power Source Types
        • By End User Application
        • By Enterprise Size
    • Italy
      • Pricing Analysis
      • Market Share Analysis, 2024
        • By Product Types
        • By Power Source Types
        • By End User Application
        • By Enterprise Size
    • France
      • Pricing Analysis
      • Market Share Analysis, 2024
        • By Product Types
        • By Power Source Types
        • By End User Application
        • By Enterprise Size
    • UK
      • Pricing Analysis
      • Market Share Analysis, 2024
        • By Product Types
        • By Power Source Types
        • By End User Application
        • By Enterprise Size
    • Spain
      • Pricing Analysis
      • Market Share Analysis, 2024
        • By Product Types
        • By Power Source Types
        • By End User Application
        • By Enterprise Size
    • BENELUX
      • Pricing Analysis
      • Market Share Analysis, 2024
        • By Product Types
        • By Power Source Types
        • By End User Application
        • By Enterprise Size
    • Nordics
      • Pricing Analysis
      • Market Share Analysis, 2024
        • By Product Types
        • By Power Source Types
        • By End User Application
        • By Enterprise Size
    • Russia
      • Pricing Analysis
      • Market Share Analysis, 2024
        • By Product Types
        • By Power Source Types
        • By End User Application
        • By Enterprise Size
    • Hungary
      • Pricing Analysis
      • Market Share Analysis, 2024
        • By Product Types
        • By Power Source Types
        • By End User Application
        • By Enterprise Size
    • Poland
      • Pricing Analysis
      • Market Share Analysis, 2024
        • By Product Types
        • By Power Source Types
        • By End User Application
        • By Enterprise Size
    • Balkan & Baltics
      • Pricing Analysis
      • Market Share Analysis, 2024
        • By Product Types
        • By Power Source Types
        • By End User Application
        • By Enterprise Size
    • China
      • Pricing Analysis
      • Market Share Analysis, 2024
        • By Product Types
        • By Power Source Types
        • By End User Application
        • By Enterprise Size
    • Japan
      • Pricing Analysis
      • Market Share Analysis, 2024
        • By Product Types
        • By Power Source Types
        • By End User Application
        • By Enterprise Size
    • South Korea
      • Pricing Analysis
      • Market Share Analysis, 2024
        • By Product Types
        • By Power Source Types
        • By End User Application
        • By Enterprise Size
    • India
      • Pricing Analysis
      • Market Share Analysis, 2024
        • By Product Types
        • By Power Source Types
        • By End User Application
        • By Enterprise Size
    • ASEAN
      • Pricing Analysis
      • Market Share Analysis, 2024
        • By Product Types
        • By Power Source Types
        • By End User Application
        • By Enterprise Size
    • Australia & New Zealand
      • Pricing Analysis
      • Market Share Analysis, 2024
        • By Product Types
        • By Power Source Types
        • By End User Application
        • By Enterprise Size
    • GCC Countries
      • Pricing Analysis
      • Market Share Analysis, 2024
        • By Product Types
        • By Power Source Types
        • By End User Application
        • By Enterprise Size
    • Turkiye
      • Pricing Analysis
      • Market Share Analysis, 2024
        • By Product Types
        • By Power Source Types
        • By End User Application
        • By Enterprise Size
    • Northern Africa
      • Pricing Analysis
      • Market Share Analysis, 2024
        • By Product Types
        • By Power Source Types
        • By End User Application
        • By Enterprise Size
    • South Africa
      • Pricing Analysis
      • Market Share Analysis, 2024
        • By Product Types
        • By Power Source Types
        • By End User Application
        • By Enterprise Size
  20. Market Structure Analysis
    • Competition Dashboard
    • Competition Benchmarking
    • Market Share Analysis of Top Players
      • By Regional
      • By Product Types
      • By Power Source Types
      • By End User Application
      • By Enterprise Size
  21. Competition Analysis
    • Competition Deep Dive
      • TTI
        • Overview
        • Product Portfolio
        • Profitability by Market Segments
        • Sales Footprint
        • Strategy Overview
      • DeWalt
        • Overview
        • Product Portfolio
        • Profitability by Market Segments
        • Sales Footprint
        • Strategy Overview
      • BLACK+DECKER
        • Overview
        • Product Portfolio
        • Profitability by Market Segments
        • Sales Footprint
        • Strategy Overview
      • Positec Germany GmbH
        • Overview
        • Product Portfolio
        • Profitability by Market Segments
        • Sales Footprint
        • Strategy Overview
      • Festool GmbH
        • Overview
        • Product Portfolio
        • Profitability by Market Segments
        • Sales Footprint
        • Strategy Overview
      • Makita
        • Overview
        • Product Portfolio
        • Profitability by Market Segments
        • Sales Footprint
        • Strategy Overview
      • Koki Holdings Co.
        • Overview
        • Product Portfolio
        • Profitability by Market Segments
        • Sales Footprint
        • Strategy Overview
      • Greenworks
        • Overview
        • Product Portfolio
        • Profitability by Market Segments
        • Sales Footprint
        • Strategy Overview
  22. Assumptions & Acronyms Used
  23. Research Methodology

List of Tables

  • Table 1: Global Market Value (USD Billion) Forecast by Region, 2020-2035
  • Table 2: Global Market Value (USD Billion) Forecast by Product Types, 2020-2035
  • Table 3: Global Market Value (USD Billion) Forecast by Power Source Types , 2020-2035
  • Table 4: Global Market Value (USD Billion) Forecast by End User Application , 2020-2035
  • Table 5: Global Market Value (USD Billion) Forecast by Enterprise Size, 2020-2035
  • Table 6: North America Market Value (USD Billion) Forecast by Country, 2020-2035
  • Table 7: North America Market Value (USD Billion) Forecast by Product Types, 2020-2035
  • Table 8: North America Market Value (USD Billion) Forecast by Power Source Types , 2020-2035
  • Table 9: North America Market Value (USD Billion) Forecast by End User Application , 2020-2035
  • Table 10: North America Market Value (USD Billion) Forecast by Enterprise Size, 2020-2035
  • Table 11: Latin America Market Value (USD Billion) Forecast by Country, 2020-2035
  • Table 12: Latin America Market Value (USD Billion) Forecast by Product Types, 2020-2035
  • Table 13: Latin America Market Value (USD Billion) Forecast by Power Source Types , 2020-2035
  • Table 14: Latin America Market Value (USD Billion) Forecast by End User Application , 2020-2035
  • Table 15: Latin America Market Value (USD Billion) Forecast by Enterprise Size, 2020-2035
  • Table 16: Western Europe Market Value (USD Billion) Forecast by Country, 2020-2035
  • Table 17: Western Europe Market Value (USD Billion) Forecast by Product Types, 2020-2035
  • Table 18: Western Europe Market Value (USD Billion) Forecast by Power Source Types , 2020-2035
  • Table 19: Western Europe Market Value (USD Billion) Forecast by End User Application , 2020-2035
  • Table 20: Western Europe Market Value (USD Billion) Forecast by Enterprise Size, 2020-2035
  • Table 21: Eastern Europe Market Value (USD Billion) Forecast by Country, 2020-2035
  • Table 22: Eastern Europe Market Value (USD Billion) Forecast by Product Types, 2020-2035
  • Table 23: Eastern Europe Market Value (USD Billion) Forecast by Power Source Types , 2020-2035
  • Table 24: Eastern Europe Market Value (USD Billion) Forecast by End User Application , 2020-2035
  • Table 25: Eastern Europe Market Value (USD Billion) Forecast by Enterprise Size, 2020-2035
  • Table 26: East Asia Market Value (USD Billion) Forecast by Country, 2020-2035
  • Table 27: East Asia Market Value (USD Billion) Forecast by Product Types, 2020-2035
  • Table 28: East Asia Market Value (USD Billion) Forecast by Power Source Types , 2020-2035
  • Table 29: East Asia Market Value (USD Billion) Forecast by End User Application , 2020-2035
  • Table 30: East Asia Market Value (USD Billion) Forecast by Enterprise Size, 2020-2035
  • Table 31: South Asia & Pacific Market Value (USD Billion) Forecast by Country, 2020-2035
  • Table 32: South Asia & Pacific Market Value (USD Billion) Forecast by Product Types, 2020-2035
  • Table 33: South Asia & Pacific Market Value (USD Billion) Forecast by Power Source Types , 2020-2035
  • Table 34: South Asia & Pacific Market Value (USD Billion) Forecast by End User Application , 2020-2035
  • Table 35: South Asia & Pacific Market Value (USD Billion) Forecast by Enterprise Size, 2020-2035
  • Table 36: Middle East & Africa Market Value (USD Billion) Forecast by Country, 2020-2035
  • Table 37: Middle East & Africa Market Value (USD Billion) Forecast by Product Types, 2020-2035
  • Table 38: Middle East & Africa Market Value (USD Billion) Forecast by Power Source Types , 2020-2035
  • Table 39: Middle East & Africa Market Value (USD Billion) Forecast by End User Application , 2020-2035
  • Table 40: Middle East & Africa Market Value (USD Billion) Forecast by Enterprise Size, 2020-2035

List of Figures

  • Figure 1: Global Market Pricing Analysis
  • Figure 2: Global Market Value (USD Billion) Forecast 2020-2035
  • Figure 3: Global Market Value Share and BPS Analysis by Product Types, 2025 and 2035
  • Figure 4: Global Market Y-o-Y Growth Comparison by Product Types, 2025-2035
  • Figure 5: Global Market Attractiveness Analysis by Product Types
  • Figure 6: Global Market Value Share and BPS Analysis by Power Source Types , 2025 and 2035
  • Figure 7: Global Market Y-o-Y Growth Comparison by Power Source Types , 2025-2035
  • Figure 8: Global Market Attractiveness Analysis by Power Source Types
  • Figure 9: Global Market Value Share and BPS Analysis by End User Application , 2025 and 2035
  • Figure 10: Global Market Y-o-Y Growth Comparison by End User Application , 2025-2035
  • Figure 11: Global Market Attractiveness Analysis by End User Application
  • Figure 12: Global Market Value Share and BPS Analysis by Enterprise Size, 2025 and 2035
  • Figure 13: Global Market Y-o-Y Growth Comparison by Enterprise Size, 2025-2035
  • Figure 14: Global Market Attractiveness Analysis by Enterprise Size
  • Figure 15: Global Market Value (USD Billion) Share and BPS Analysis by Region, 2025 and 2035
  • Figure 16: Global Market Y-o-Y Growth Comparison by Region, 2025-2035
  • Figure 17: Global Market Attractiveness Analysis by Region
  • Figure 18: North America Market Incremental $ Opportunity, 2025-2035
  • Figure 19: Latin America Market Incremental $ Opportunity, 2025-2035
  • Figure 20: Western Europe Market Incremental $ Opportunity, 2025-2035
  • Figure 21: Eastern Europe Market Incremental $ Opportunity, 2025-2035
  • Figure 22: East Asia Market Incremental $ Opportunity, 2025-2035
  • Figure 23: South Asia & Pacific Market Incremental $ Opportunity, 2025-2035
  • Figure 24: Middle East & Africa Market Incremental $ Opportunity, 2025-2035
  • Figure 25: North America Market Value Share and BPS Analysis by Country, 2025 and 2035
  • Figure 26: North America Market Value Share and BPS Analysis by Product Types, 2025 and 2035
  • Figure 27: North America Market Y-o-Y Growth Comparison by Product Types, 2025-2035
  • Figure 28: North America Market Attractiveness Analysis by Product Types
  • Figure 29: North America Market Value Share and BPS Analysis by Power Source Types , 2025 and 2035
  • Figure 30: North America Market Y-o-Y Growth Comparison by Power Source Types , 2025-2035
  • Figure 31: North America Market Attractiveness Analysis by Power Source Types
  • Figure 32: North America Market Value Share and BPS Analysis by End User Application , 2025 and 2035
  • Figure 33: North America Market Y-o-Y Growth Comparison by End User Application , 2025-2035
  • Figure 34: North America Market Attractiveness Analysis by End User Application
  • Figure 35: North America Market Value Share and BPS Analysis by Enterprise Size, 2025 and 2035
  • Figure 36: North America Market Y-o-Y Growth Comparison by Enterprise Size, 2025-2035
  • Figure 37: North America Market Attractiveness Analysis by Enterprise Size
  • Figure 38: Latin America Market Value Share and BPS Analysis by Country, 2025 and 2035
  • Figure 39: Latin America Market Value Share and BPS Analysis by Product Types, 2025 and 2035
  • Figure 40: Latin America Market Y-o-Y Growth Comparison by Product Types, 2025-2035
  • Figure 41: Latin America Market Attractiveness Analysis by Product Types
  • Figure 42: Latin America Market Value Share and BPS Analysis by Power Source Types , 2025 and 2035
  • Figure 43: Latin America Market Y-o-Y Growth Comparison by Power Source Types , 2025-2035
  • Figure 44: Latin America Market Attractiveness Analysis by Power Source Types
  • Figure 45: Latin America Market Value Share and BPS Analysis by End User Application , 2025 and 2035
  • Figure 46: Latin America Market Y-o-Y Growth Comparison by End User Application , 2025-2035
  • Figure 47: Latin America Market Attractiveness Analysis by End User Application
  • Figure 48: Latin America Market Value Share and BPS Analysis by Enterprise Size, 2025 and 2035
  • Figure 49: Latin America Market Y-o-Y Growth Comparison by Enterprise Size, 2025-2035
  • Figure 50: Latin America Market Attractiveness Analysis by Enterprise Size
  • Figure 51: Western Europe Market Value Share and BPS Analysis by Country, 2025 and 2035
  • Figure 52: Western Europe Market Value Share and BPS Analysis by Product Types, 2025 and 2035
  • Figure 53: Western Europe Market Y-o-Y Growth Comparison by Product Types, 2025-2035
  • Figure 54: Western Europe Market Attractiveness Analysis by Product Types
  • Figure 55: Western Europe Market Value Share and BPS Analysis by Power Source Types , 2025 and 2035
  • Figure 56: Western Europe Market Y-o-Y Growth Comparison by Power Source Types , 2025-2035
  • Figure 57: Western Europe Market Attractiveness Analysis by Power Source Types
  • Figure 58: Western Europe Market Value Share and BPS Analysis by End User Application , 2025 and 2035
  • Figure 59: Western Europe Market Y-o-Y Growth Comparison by End User Application , 2025-2035
  • Figure 60: Western Europe Market Attractiveness Analysis by End User Application
  • Figure 61: Western Europe Market Value Share and BPS Analysis by Enterprise Size, 2025 and 2035
  • Figure 62: Western Europe Market Y-o-Y Growth Comparison by Enterprise Size, 2025-2035
  • Figure 63: Western Europe Market Attractiveness Analysis by Enterprise Size
  • Figure 64: Eastern Europe Market Value Share and BPS Analysis by Country, 2025 and 2035
  • Figure 65: Eastern Europe Market Value Share and BPS Analysis by Product Types, 2025 and 2035
  • Figure 66: Eastern Europe Market Y-o-Y Growth Comparison by Product Types, 2025-2035
  • Figure 67: Eastern Europe Market Attractiveness Analysis by Product Types
  • Figure 68: Eastern Europe Market Value Share and BPS Analysis by Power Source Types , 2025 and 2035
  • Figure 69: Eastern Europe Market Y-o-Y Growth Comparison by Power Source Types , 2025-2035
  • Figure 70: Eastern Europe Market Attractiveness Analysis by Power Source Types
  • Figure 71: Eastern Europe Market Value Share and BPS Analysis by End User Application , 2025 and 2035
  • Figure 72: Eastern Europe Market Y-o-Y Growth Comparison by End User Application , 2025-2035
  • Figure 73: Eastern Europe Market Attractiveness Analysis by End User Application
  • Figure 74: Eastern Europe Market Value Share and BPS Analysis by Enterprise Size, 2025 and 2035
  • Figure 75: Eastern Europe Market Y-o-Y Growth Comparison by Enterprise Size, 2025-2035
  • Figure 76: Eastern Europe Market Attractiveness Analysis by Enterprise Size
  • Figure 77: East Asia Market Value Share and BPS Analysis by Country, 2025 and 2035
  • Figure 78: East Asia Market Value Share and BPS Analysis by Product Types, 2025 and 2035
  • Figure 79: East Asia Market Y-o-Y Growth Comparison by Product Types, 2025-2035
  • Figure 80: East Asia Market Attractiveness Analysis by Product Types
  • Figure 81: East Asia Market Value Share and BPS Analysis by Power Source Types , 2025 and 2035
  • Figure 82: East Asia Market Y-o-Y Growth Comparison by Power Source Types , 2025-2035
  • Figure 83: East Asia Market Attractiveness Analysis by Power Source Types
  • Figure 84: East Asia Market Value Share and BPS Analysis by End User Application , 2025 and 2035
  • Figure 85: East Asia Market Y-o-Y Growth Comparison by End User Application , 2025-2035
  • Figure 86: East Asia Market Attractiveness Analysis by End User Application
  • Figure 87: East Asia Market Value Share and BPS Analysis by Enterprise Size, 2025 and 2035
  • Figure 88: East Asia Market Y-o-Y Growth Comparison by Enterprise Size, 2025-2035
  • Figure 89: East Asia Market Attractiveness Analysis by Enterprise Size
  • Figure 90: South Asia & Pacific Market Value Share and BPS Analysis by Country, 2025 and 2035
  • Figure 91: South Asia & Pacific Market Value Share and BPS Analysis by Product Types, 2025 and 2035
  • Figure 92: South Asia & Pacific Market Y-o-Y Growth Comparison by Product Types, 2025-2035
  • Figure 93: South Asia & Pacific Market Attractiveness Analysis by Product Types
  • Figure 94: South Asia & Pacific Market Value Share and BPS Analysis by Power Source Types , 2025 and 2035
  • Figure 95: South Asia & Pacific Market Y-o-Y Growth Comparison by Power Source Types , 2025-2035
  • Figure 96: South Asia & Pacific Market Attractiveness Analysis by Power Source Types
  • Figure 97: South Asia & Pacific Market Value Share and BPS Analysis by End User Application , 2025 and 2035
  • Figure 98: South Asia & Pacific Market Y-o-Y Growth Comparison by End User Application , 2025-2035
  • Figure 99: South Asia & Pacific Market Attractiveness Analysis by End User Application
  • Figure 100: South Asia & Pacific Market Value Share and BPS Analysis by Enterprise Size, 2025 and 2035
  • Figure 101: South Asia & Pacific Market Y-o-Y Growth Comparison by Enterprise Size, 2025-2035
  • Figure 102: South Asia & Pacific Market Attractiveness Analysis by Enterprise Size
  • Figure 103: Middle East & Africa Market Value Share and BPS Analysis by Country, 2025 and 2035
  • Figure 104: Middle East & Africa Market Value Share and BPS Analysis by Product Types, 2025 and 2035
  • Figure 105: Middle East & Africa Market Y-o-Y Growth Comparison by Product Types, 2025-2035
  • Figure 106: Middle East & Africa Market Attractiveness Analysis by Product Types
  • Figure 107: Middle East & Africa Market Value Share and BPS Analysis by Power Source Types , 2025 and 2035
  • Figure 108: Middle East & Africa Market Y-o-Y Growth Comparison by Power Source Types , 2025-2035
  • Figure 109: Middle East & Africa Market Attractiveness Analysis by Power Source Types
  • Figure 110: Middle East & Africa Market Value Share and BPS Analysis by End User Application , 2025 and 2035
  • Figure 111: Middle East & Africa Market Y-o-Y Growth Comparison by End User Application , 2025-2035
  • Figure 112: Middle East & Africa Market Attractiveness Analysis by End User Application
  • Figure 113: Middle East & Africa Market Value Share and BPS Analysis by Enterprise Size, 2025 and 2035
  • Figure 114: Middle East & Africa Market Y-o-Y Growth Comparison by Enterprise Size, 2025-2035
  • Figure 115: Middle East & Africa Market Attractiveness Analysis by Enterprise Size
  • Figure 116: Global Market - Tier Structure Analysis
  • Figure 117: Global Market - Company Share Analysis

Frequently Asked Questions

What is the estimated value of the Cordless Sanders Market in 2025?

The global Cordless Sanders Market is expected to reach a value of USD 1.5 billion in 2025, driven by the increasing shift toward cordless, high-efficiency sanding tools in both professional and DIY settings.

How much is the market projected to grow by 2035?

The market is forecast to reach approximately USD 2.6 billion by 2035, supported by advances in battery technology, dust management, and ergonomic tool design.

What is the compound annual growth rate (CAGR) between 2025 and 2035?

The Cordless Sanders Market is projected to grow at a CAGR of 5.4% between 2025 and 2035, with demand rising steadily across woodworking, construction, and automotive applications.

Which product type holds the highest market share in 2025?

Random Orbital Sanders are expected to lead the market in 2025 due to their versatility, high surface coverage, and smoother finish quality across multiple materials.

Who are the key players in the global cordless sander landscape?

Leading players include Makita, Bosch, Stanley Black & Decker, TTI (Milwaukee), Festool, and Hilti, all focusing on lithium-powered platforms, brushless motors, and smart tool integration for professional and consumer use.

Explore Similar Insights

Future Market Insights

Cordless Sander Market