The global customized premix market is poised for robust expansion, with its value estimated at USD 10.3 billion in 2025 and projected to reach USD 18.6 billion by 2035. This market is expected to grow at a CAGR of 6.1% over the forecast period.
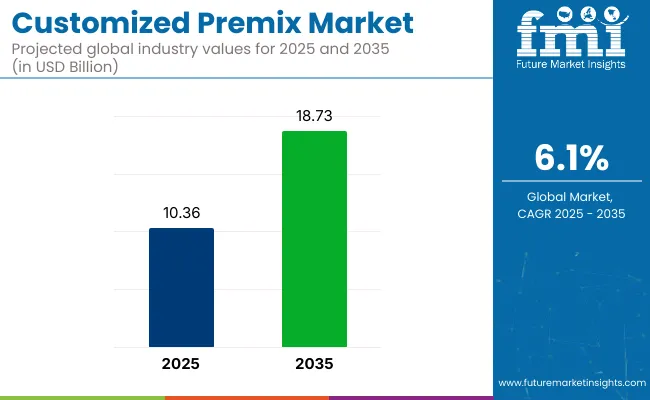
This upward trajectory reflects growing interest in health-oriented eating and functional food solutions across developed and emerging markets alike. Products that combine multiple micronutrients like vitamins, minerals, amino acids, and other functional ingredients are increasingly being adopted in the formulation of foods, beverages, pharmaceuticals, and dietary supplements tailored to specific consumer needs.
Manufacturers are capitalizing on this trend by offering targeted nutritional solutions that address health priorities such as immunity, energy, digestion, and cognitive function.
The market accounts for varying degrees of share across its parent markets, contributing 18-22% of the functional food ingredients market, 15-18% of the nutraceuticals market, and around 10-12% of the dietary supplements market, owing to its role in blending essential micronutrients tailored for health-focused products.
Within the food additives market, its share is more modest, at about 5-7%, since this category includes a broad range of additives beyond nutrients. In the fortified and enriched food and beverage market, customized premixes account for an estimated 20-25%, driven by their widespread use in processed foods, infant nutrition, and beverages. The growing preference for targeted nutrition and ease of formulation continues to elevate the role of premixes within these overlapping sectors.
The consumption of customized premixes surged primarily due to heightened global health consciousness triggered by the COVID-19 pandemic between 2020 and 2024. Consumers actively sought preventive health solutions, pushing demand for fortified products across food, beverages, and supplements.
The period also witnessed sharp growth in e-commerce and DTC (direct-to-consumer) nutrition brands, enabling greater access to personalized formulations. This demand was largely reactionary, driven by immediate immune support and general well-being. In 2025 to 2035 period is set to experience more structured and sustained growth.
Consumption patterns will be influenced less by short-term health crises and more by longer-term shifts in public health policy, technological innovations in nutrition science, and demographic factors like aging populations and rising lifestyle diseases. Growth will be more strategically driven by personalized nutrition, clinical nutrition, and industry partnerships to deliver precision-formulated products tailored to specific consumer needs, use cases, and regional health gaps.
Only a few large economies generate noticeable per‑capita customized premix intake through wheat flour. The United States and Canada each see around 12 grams per person per year, while the United Kingdom averages slightly higher at 12.75 grams per person annually. India records a small figure of 0.69 grams per person, and all other major markets, including China, Japan, and Germany, remain below 0.20 grams per capita because fortification programs are absent or limited.
Only the United States, Canada, and the United Kingdom consistently deliver double‑digit per‑capita customized premix usage through mandatory wheat flour fortification. India contributes marginally through its pilot programs, while China, Japan, and European markets without mandates remain negligible. Even with additional fortified carriers like edible oils or salt, most of these economies show little overall customized premix consumption.
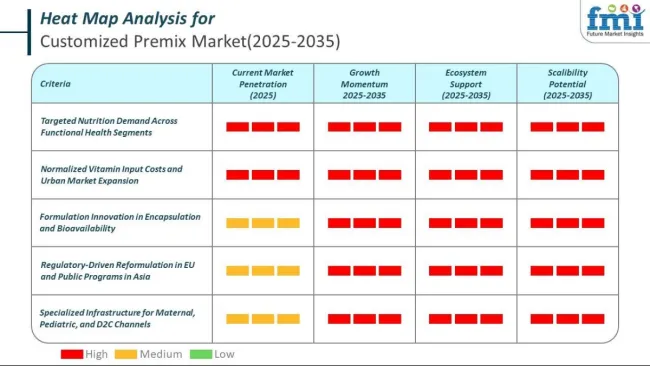
The customized premix market is led by premix blends/direct-to-consumer solutions with a 71% share in 2025, driven by ease of formulation and rising demand for personalized nutrition. Powder form 67% dominates due to its versatility, while vitamin premixes, 45% lead ingredient types for their essential health benefits. Bone health, 29% and pharma OTC drugs, 39% are key functional and application segments fueled by preventive healthcare trends.
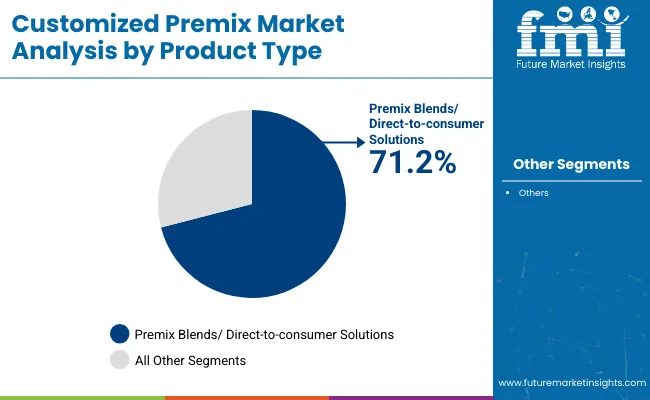
Premix Blends/Direct-to-Consumer (DTC) Solutions is the leading product type segment in the market, accounting for a commanding 71% market share in 2025. This dominance reflects the growing demand for ready-to-use nutritional solutions among smaller manufacturers and health-conscious consumers.
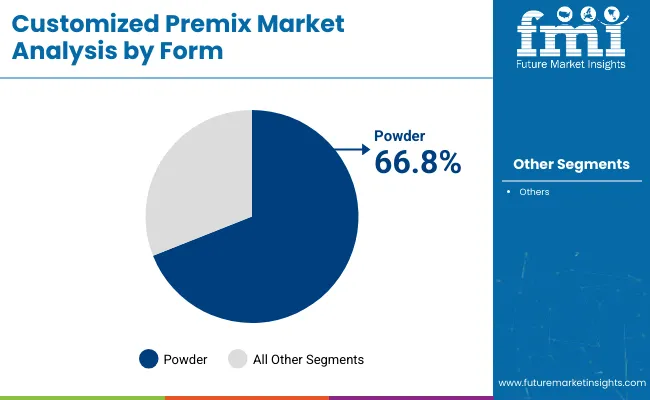
The powder segment leads the market with a significant 67% market share in 2025, owing to its versatility, stability, and ease of integration across a wide range of end-use applications.
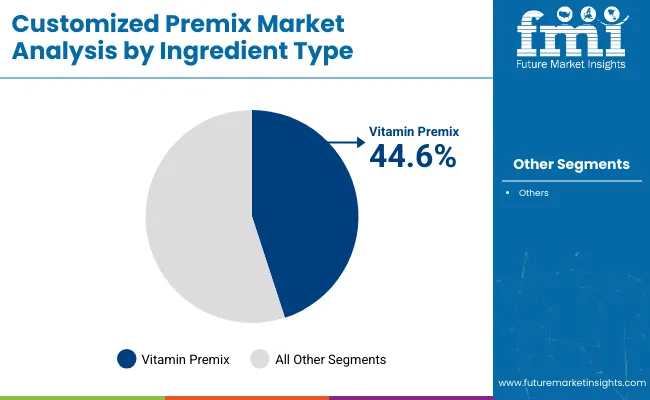
The vitamin premix segment is the leading ingredient type in the market, accounting for a 45% market share in 2025. This leadership is driven by the widespread inclusion of essential vitamins such as A, B-complex, D, and E in functional foods, beverages, supplements, and pharmaceutical applications.
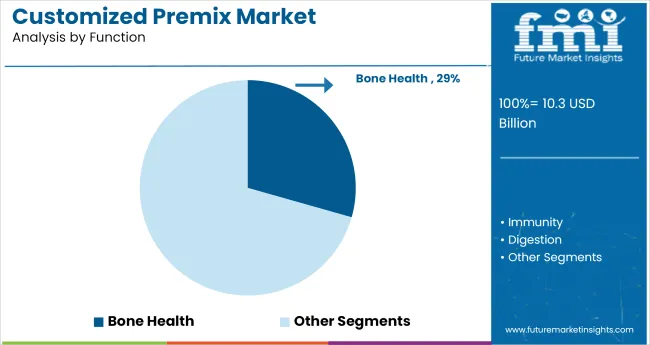
The bone health segment is the leading functional category in the market, capturing a 29% market share in 2025.
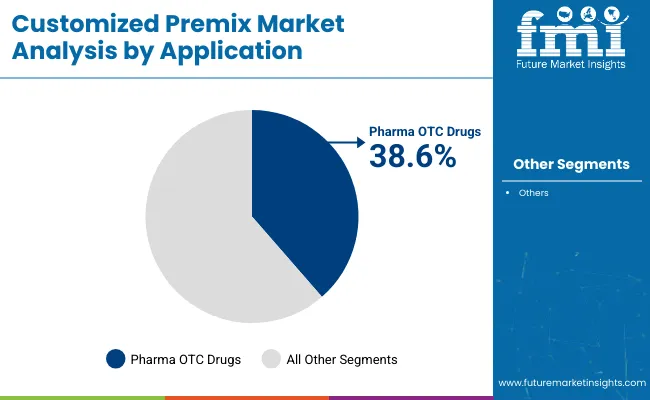
The pharma OTC drugs segment leads the application landscape of the market, accounting for a substantial 39% market share in 2025. This dominance stems from the accelerating demand for self-care and preventive healthcare solutions among consumers.
Health-conscious consumers and fortified product launches are driving customized premix demand, with over 58% of new health-positioned SKUs now containing premixes. Meanwhile, evolving regulatory norms and clinical nutrition priorities are reshaping supplier contracts, especially in the EU and India.
Health-Driven Formulation Shifts Fuel Customized Premix Demand
Consumer demand for functional and fortified foods is accelerating product volume growth, especially in the food, beverage, and nutraceutical industries. In 2025, over 58% of new health-positioned food product launches in North America contained premix solutions, up from 41% in 2023.
Retail-ready formulations featuring vitamin and mineral premixes saw a 23% increase in supermarket shelf presence due to rising consumer preference for clean-label, immune-supporting products. In Asia, fortified beverages and cereals led B2C demand, with powdered premix shipments climbing 17.6% YoY due to growth in health-conscious urban households.
Regulatory Pressure and Clinical Nutrition Needs Reshape Supplier Contracts
Supply dynamics are increasingly shaped by regulatory standards on nutrition labeling, mandatory fortification, and clinical nutrition guidelines. As of Q2 2025, 61% of fortified product manufacturers in the EU adjusted premix specifications to comply with updated nutrient reference values (NRVs).
In India, public procurement for school meal programs adopted multi-nutrient premix contracts following anemia-reduction targets, leading to a 21% rise in demand from government-linked food service operations. Large-scale food companies are also renegotiating terms with premix suppliers to align with national dietary programs and therapeutic nutrition claims for elderly and pediatric populations.
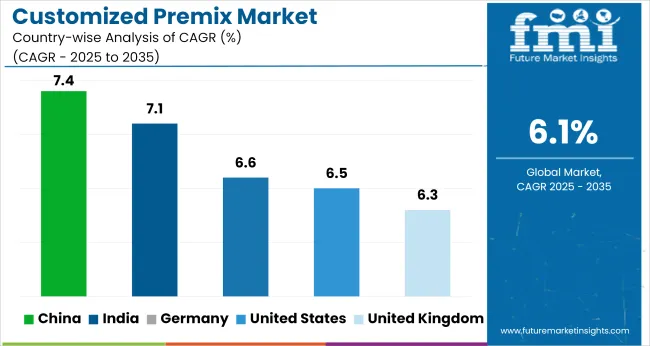
| Countries | CAGR (2025 to 2035) |
|---|---|
| United States | 6.5% |
| United Kingdom | 6.3% |
| Germany | 6.6% |
| China | 7.4% |
| India | 7.1% |
With the global customized premix market projected to grow at a CAGR of 6.1% from 2025 to 2035, notable divergence emerges across OECD and BRICS regions. China leads with 7.4%, outpacing the global average by 1.3 percentage points. Growth is fueled by increased fortification demand in functional beverages, maternal nutrition, and meal replacements.
India follows at 7.1%, driven by localized premix adoption in fortified staples, dairy, and affordable wellness SKUs. Both BRICS nations are expanding micro-encapsulation capacity and backward-integrating vitamin and mineral synthesis.
Germany, part of the OECD, slightly exceeds the global average at 6.6%, where precision nutrition is pushing growth in clinical and pediatric premixes. The United States posts 6.5%, reflecting strong demand in protein bars and ready-to-mix powders, though formulation complexity is raising production lead times.
The United Kingdom stands at 6.3%, driven by clean-label reformulations. ASEAN players like Indonesia and Malaysia, while not in the top five, are catching up through regional B2B formulation hubs.
The report covers a detailed analysis of 40+ countries, and the top five countries have been shared as a reference.
The customized premix market in the United States is projected to grow at a CAGR of 6.5% between 2025 and 2035, compared to a more modest 4.1% CAGR during 2020 to 2024. During the historical period, growth was primarily driven by fortification trends in mainstream food and beverage products, including ready-to-eat cereals and dairy alternatives.
However, in the forecast period, the expansion is being accelerated by rising consumer demand for targeted health support, such as bone, immune, and cognitive health, especially among aging demographics and younger wellness-focused consumers. OTC and clinical nutrition markets are rapidly adopting vitamin and mineral premixes, supported by evolving FDA nutrition guidelines.
Growth is also supported by the DTC (direct-to-consumer) model through functional sachets, beverages, and personalized supplements. This dual-channel model enables both startups and major players to scale efficiently.
The United Kingdom’s customized premix market registered a CAGR of 3.6% between 2020 and 2024, primarily led by early-stage applications in fortified breakfast cereals and beverages. However, a notable rise is expected in the coming years, with the market projected to grow at a CAGR of 6.3% from 2025 to 2035.
The improvement in growth rate reflects a shift from general-purpose fortification to more targeted, health-positioned formulations tailored to specific consumer needs, such as cognitive function, immunity, and cardiovascular health. NHS-backed nutritional guidelines and school fortification initiatives are driving premix integration into public meal programs.
Private-label grocery brands are also playing a significant role in expanding the reach of fortified food offerings by sourcing bespoke premix solutions. The rising awareness around clean-label supplements and functional blends among Millennials and Gen Z is fostering greater adoption of DTC premix formats in sachets, capsules, and powdered beverages.
Germany’s customized premix market recorded a CAGR of 4.2% between 2020 and 2024, primarily driven by nutrient-enriched dairy, bakery, and baby food products. For the 2025 to 2035 period, the CAGR is projected at 6.6%, reflecting a broader move toward multifunctional nutrition, particularly in clinical and preventive health segments.
The German market is also strongly influenced by EU nutrition compliance policies and growing demand for CE-labeled ingredient traceability in premix formulations. Functional health categories such as bone density, energy metabolism, and gut health are increasingly being addressed through fortified foods and OTC supplements.
Urban centers like Berlin, Hamburg, and Munich are seeing a surge in on-the-go functional beverage launches utilizing vitamin-mineral premixes. The pharmaceutical and nutraceutical industries are also incorporating multi-micronutrient blends into OTC tablets, supporting Germany’s aging population.
China’s customized premix market grew at a CAGR of 5.2% from 2020 to 2024, primarily led by mass-market demand for fortified powdered milk, energy drinks, and immunity-enhancing supplements. Looking ahead, the market is forecast to expand at a significantly higher CAGR of 7.4% between 2025 and 2035, driven by heightened interest in precision nutrition and personalized dietary formats.
China's aging population, coupled with urbanization-led shifts in dietary patterns, is pushing demand for functional foods formulated with customized vitamin and mineral blends. Government health directives encouraging child nutrition and maternal health are also expanding premix usage across public and private sector channels. A surge in clean-label, plant-based beverages and convenience-driven DTC nutrition packs is creating new demand for ready-to-use powder premixes across health retail and e-commerce platforms.
India’s customized premix market saw moderate growth at a CAGR of 4.6% from 2020 to 2024, as basic iron, iodine, and vitamin fortification programs gained traction in school meals and mid-day feeding schemes. However, the forecasted CAGR of 7.1% between 2025 and 2035 marks a significant acceleration, fueled by the broader adoption of fortified staples and the expansion of wellness-focused foods across urban and semi-urban populations.
The market is also seeing robust traction in clinical nutrition, where public health mandates related to anemia and maternal care are shaping procurement of multi-micronutrient blends. India’s growing middle class, combined with rising lifestyle-related health concerns, is triggering demand for clean-label, affordable fortified products that integrate customized premixes in forms such as instant mixes, sachets, and fortified atta (flour). Domestic and global suppliers are responding by localizing production and tailoring premix blends for region-specific needs.
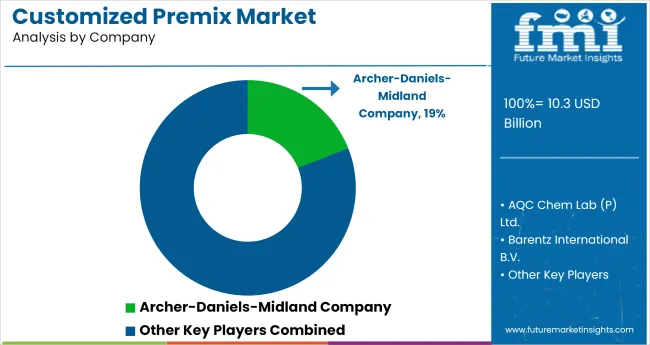
In the industry, companies are leveraging fortified nutrition trends, personalized wellness, and clinical demand to drive innovation and reach. Global leaders such as Archer Daniels Midland Company, BASF SE, Barentz International, and Koninklijke DSM N.V. are expanding their portfolios with vitamin and mineral blends tailored for food, beverage, and pharmaceutical applications.
Mid-sized firms like Hexagon Nutrition, Fenchem Biotek, and Fuerst Day Lawson are supporting regional and private-label players through formulation customization, clean-label certifications, and rapid prototype development. Indian players, including AQC Chem Lab, Jubilant Life Sciences, and Manisha Pharmo Plast, are gaining prominence by meeting government nutrition mandates.
The competitive landscape is also shaped by specialized providers like Coalescence LLC, Budenheim, and Farbest Brands, who serve niche categories such as bone health and maternal nutrition. Companies like Mühlenchemie/SternVitamin and LycoRed focus on bioavailability and delivery format innovations. Meanwhile, firms such as North America Calcium and Nutrifusion LLC cater to growing B2C and OTC demand with pre-dosed, functional ingredient systems.
| Report Attributes | Details |
|---|---|
| Market Size (2025) | USD 10.3 billion |
| Projected Market Size (2035) | USD 18.6 billion |
| CAGR (2025 to 2035) | 6.1% |
| Base Year for Estimation | 2024 |
| Historical Period | 2020 to 2024 |
| Projections Period | 2025 to 2035 |
| Quantitative Units | USD billion for value and volume in metric tons |
| Product Type Analyzed (Segment 1) | Premix Blends/ Direct-To-Consumer Solutions and Drum-To-Hopper Formulations. |
| Form Analyzed (Segment 2) | Powder and Liquid. |
| Ingredient Type Analyzed (Segment 3) | Vitamin Premix, Mineral Premix, Nucleotides Premix, Amino Acids Premix, Enzymes, Coccidiostats, Probiotics, Prebiotics, Multigrain Premix, Omega 3 Fatty Acids, Excipients, Gums, Botanicals, Sweeteners, Flavors, Proteins, and Color. |
| Function Analyzed (Segment 4) | Bone Health, Immunity, Digestion, Energy, Heart Health, Weight Management, Vision Health, Brain Health & Memory, Resistance, and Others |
| Application Analyzed (Segment 5) | Food Sector, Dietary Supplements, Pharma OTC Drugs, and Pet Food. |
| Regions Covered | North America, Europe, Asia Pacific, Middle East & Africa, Latin America |
| Countries Covered | United States, Canada, Germany, United Kingdom, France, Italy, Spain, China, Japan, South Korea, India, Australia, Brazil, Mexico, Argentina, Saudi Arabia, UAE, South Africa |
| Key Players | Archer Daniel Midland Company, AQC Chem Lab (P) Ltd., Barentz International B.V., BASF SE, Beijing Jinkangpu Food Science and Technique Co., Ltd., BNSL Limited, Budenheim, Coalescence LLC, Farbest Brands, Fenchem Biotek Ltd., Fuerst Day Lawson Pvt Ltd., North America Calcium Private Ltd, Hexagon Nutrition Pvt. Ltd., Jubilant Life Sciences, Koninklijke DSM N.V., LycoRed Limited, Manisha Pharmo Plast Pvt Ltd., Mirpain Gida San. ve Tic. A.S., Mühlenchemie / SternVitamin, Nature's Logic, Nutrifusion LLC. |
| Additional Attributes | Dollar sales, share by ingredient type, form, function, and application, regional growth hotspots, key buyer trends, regulatory shifts, and emerging B2C demand patterns. |
The industry is segmented into premix blends/ direct-to-consumer solutions and drum-to-hopper formulations.
The industry is segmented into liquid and powder.
The industry finds vitamin premix, mineral premix, nucleotides premix, amino acids premix, enzymes, coccidiostats, probiotics, prebiotics, multigrain premix, omega 3 fatty acids, excipients, gums, botanicals, sweeteners, flavors, proteins, and color.
The industry is segmented into bone health, immunity, digestion, energy, heart health, weight management, vision health, brain health & memory, resistance, and others.
The industry is segmented into food sector, dietary supplements, pharma OTC drugs, and pet food.
The industry covers regions including North America, Europe, Asia Pacific, Latin America, and the Middle East & Africa.
The industry is valued at USD 10.3 billion in 2025.
It is forecasted to reach USD 18.6 billion by 2035.
The industry is anticipated to grow at a CAGR of 6.1% during this period.
Premix blends/direct-to-consumer solutions are projected to lead the market with a 71% share in 2035.
Asia Pacific, particularly China, is expected to be the key growth region with a projected growth rate of 7.4%.


Our Research Products

The "Full Research Suite" delivers actionable market intel, deep dives on markets or technologies, so clients act faster, cut risk, and unlock growth.

The Leaderboard benchmarks and ranks top vendors, classifying them as Established Leaders, Leading Challengers, or Disruptors & Challengers.

Locates where complements amplify value and substitutes erode it, forecasting net impact by horizon

We deliver granular, decision-grade intel: market sizing, 5-year forecasts, pricing, adoption, usage, revenue, and operational KPIs—plus competitor tracking, regulation, and value chains—across 60 countries broadly.

Spot the shifts before they hit your P&L. We track inflection points, adoption curves, pricing moves, and ecosystem plays to show where demand is heading, why it is changing, and what to do next across high-growth markets and disruptive tech

Real-time reads of user behavior. We track shifting priorities, perceptions of today’s and next-gen services, and provider experience, then pace how fast tech moves from trial to adoption, blending buyer, consumer, and channel inputs with social signals (#WhySwitch, #UX).

Partner with our analyst team to build a custom report designed around your business priorities. From analysing market trends to assessing competitors or crafting bespoke datasets, we tailor insights to your needs.
Supplier Intelligence
Discovery & Profiling
Capacity & Footprint
Performance & Risk
Compliance & Governance
Commercial Readiness
Who Supplies Whom
Scorecards & Shortlists
Playbooks & Docs
Category Intelligence
Definition & Scope
Demand & Use Cases
Cost Drivers
Market Structure
Supply Chain Map
Trade & Policy
Operating Norms
Deliverables
Buyer Intelligence
Account Basics
Spend & Scope
Procurement Model
Vendor Requirements
Terms & Policies
Entry Strategy
Pain Points & Triggers
Outputs
Pricing Analysis
Benchmarks
Trends
Should-Cost
Indexation
Landed Cost
Commercial Terms
Deliverables
Brand Analysis
Positioning & Value Prop
Share & Presence
Customer Evidence
Go-to-Market
Digital & Reputation
Compliance & Trust
KPIs & Gaps
Outputs
Full Research Suite comprises of:
Market outlook & trends analysis
Interviews & case studies
Strategic recommendations
Vendor profiles & capabilities analysis
5-year forecasts
8 regions and 60+ country-level data splits
Market segment data splits
12 months of continuous data updates
DELIVERED AS:
PDF EXCEL ONLINE
Korea Customized Premix Market Analysis – Size, Share & Trends 2025 to 2035
Demand for Customized Premix in EU Size and Share Forecast Outlook 2025 to 2035
Western Europe Customized Premix Market Analysis – Size, Share & Trends 2025 to 2035
Demand and Trend Analysis of Customized Premix in Japan Size and Share Forecast Outlook 2025 to 2035
Customized Skincare Market Size and Share Forecast Outlook 2025 to 2035
Customized Avionic Systems Market Growth - Trends & Forecast 2025 to 2035
Customized Holiday Market Analysis – Trends & Forecast 2024-2034
Customized Hair Care Market Trends – Growth & Forecast 2024-2034
Premix Packaging Machine Market Size and Share Forecast Outlook 2025 to 2035
Premix Bottled Cocktails Market Trends - Growth & Consumer Shifts 2025 to 2035
Premix Bread Flour Market Growth - Trends & Applications 2025 to 2035
Premixed Cocktail Shots Market Growth - Consumer Trends 2024 to 2034
Food Premix Market Analysis - Size, Share, and Forecast 2025 to 2035
Food Premix Industry Analysis in USA Growth & Demand Forecast 2025 to 2035
Food Premix Industry Analysis in Middle East - Size and Share Forecast Outlook 2025 to 2035
Feed Premix Market Analysis - Size, Share, & Forecast Outlook 2025 to 2035
Bread Premix Market
Mineral Premix Market Analysis - Size, Share, and Forecast Outlook 2025 to 2035
Vitamin Premix Market Analysis - Size, Growth, and Forecast 2025 to 2035
Broiler Premix Market

Thank you!
You will receive an email from our Business Development Manager. Please be sure to check your SPAM/JUNK folder too.
Chat With
MaRIA