Mineral Premix Market Size, Share, and Forecast Outlook 2025 to 2035

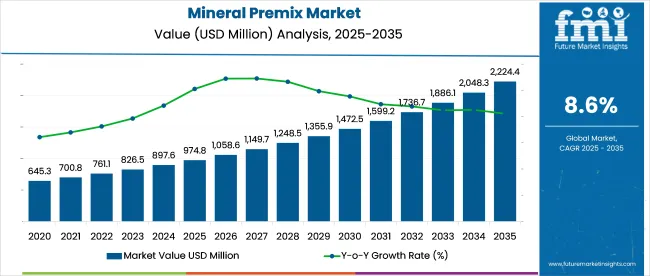
The global mineral premix market is likely to grow from USD 974.8 million in 2025 to USD 2,224.5 million by 2035, expanding at a CAGR of 8.6% during the forecast period. This growth is primarily driven by the increasing demand for high-quality animal feed, functional foods, and supplements, where mineral premixes play a crucial role in enhancing nutritional value. These premixes are used to improve the health, growth, and productivity of livestock, making them a critical component in the agricultural and food industries.

Quick Stats of Mineral Premix Market

  • Market Value (2025): USD 974.8 million
  • Forecast Value (2035): USD 2,224.5 million
  • Forecast CAGR (2025 to 2035): 8.6%
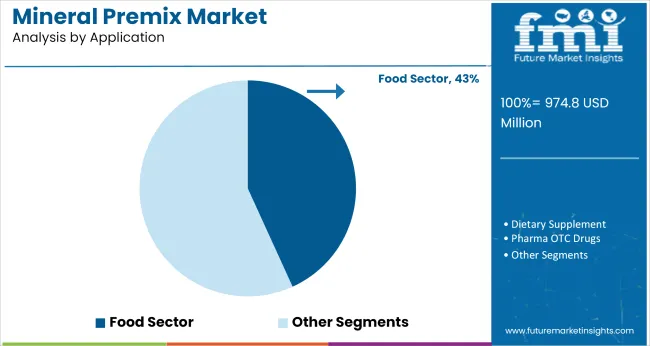
  • Leading Segment in 2025: Food Sector (43.2% market share)
  • Top Growth Region: USA (8.5% CAGR)
  • Key Players: Corbion N.V., Glanbia plc, Koninklijke DSM N.V.
Attribute Detail
Market Size (2025) USD 974.8 million
Market Size (2035) USD 2,224.5 million
CAGR (2025 to 2035) 8.6%

The global mineral premix market is projected to reach USD 974.8 million in 2025. In the animal feed additives market, it holds a notable 10-12% share, as mineral premixes play a vital role in improving feed efficiency and ensuring livestock health. The nutraceutical ingredients market sees a 3-4% contribution from mineral premixes, primarily in dietary supplements and fortified tablets.

In the functional food and beverage ingredients market, their share is estimated at 2-3%, supporting the creation of enriched cereals, bars, and beverages. Across the broader food and beverage ingredients market, mineral premixes represent about 0.3-0.5% due to their targeted application. The pet food ingredients market also includes a 5-6% share for mineral premixes, essential for balanced pet nutrition.

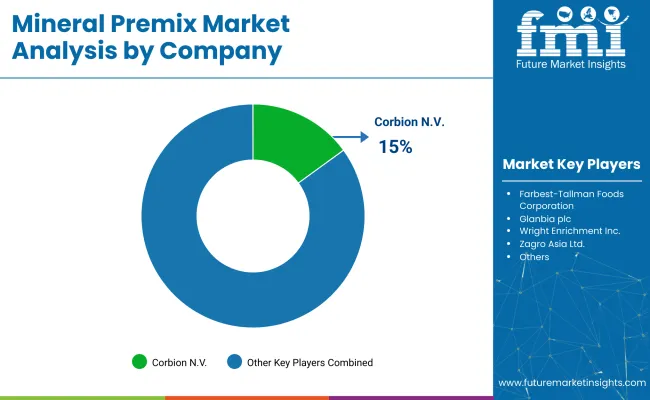
Dominating the market, the food sector will account for 43.2% of the share in 2025, followed by pet food with 18.3%. The USA is projected to experience the highest growth rate, with a CAGR of 8.5%. Leading the industry, Corbion N.V. is a leading player in the industry, holding a 16% market share.Emerging players such as SternVitamin GmbH & Co. KG are innovating with specialized formulations, while Nutreco N.V. enhances its position by acquiring Micronutrients in the animal feed premix segment.

In 2024, Adriano Marcon, CEO of Cargill Animal Nutrition discussed the growing importance of mineral premixes in supporting global food security. He emphasized, 'Mineral premixes are vital for meeting the nutritional needs of both livestock and humans.

As demand for healthy and fortified foods rises, we are committed to delivering high-quality, sustainable mineral solutions that contribute to global food safety and nutrition. This insight underscores the increasing role of mineral premixes in enhancing food quality and ensuring food security worldwide.

Semi-Annual Market Update

The below table presents a comparative assessment of the variation in CAGR over six months for the base year (2024) and current year (2025) for the global mineral premix industry. This analysis reveals crucial shifts in performance and indicates revenue realization patterns, thus providing stakeholders with a better vision of the growth trajectory over the year. The first half of the year, or H1, spans from January to June. The second half, H2, includes the months from July to December.

Particular Value CAGR
H1 (2024 to 2034) 7.3%
H2 (2024 to 2034) 7.8%
H1 (2025 to 2035) 7.5%
H2 (2025 to 2035) 8.6%

In the first half (H1) of the decade from 2025 to 2035, the business is predicted to surge at a CAGR of 5.3%, followed by a slightly higher growth rate of 6.2% in the second half (H2) of the same decade. Moving into the subsequent period, from H1 2024 to H2 2034, the CAGR is projected to increase slightly to 5.3% in the first half and remain relatively moderate at 6.2% in the second half.

Mineral Premix Market Analysis by Top Segments

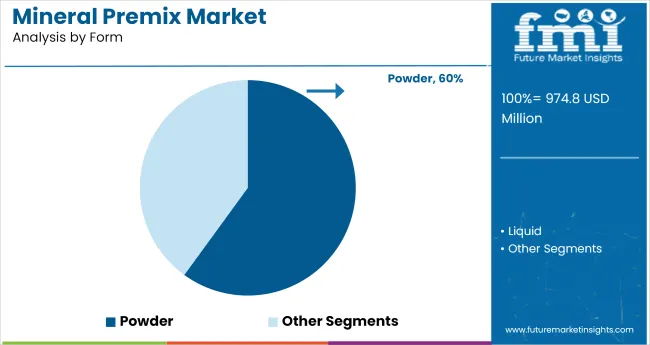
The mineral premix market is projected to grow at a steady rate, driven by increasing demand in functional foods, dietary supplements, and fortified products. In 2025, the food sector is expected to lead with a 43.2% share, while powder form will dominate at 38.3%.

Powder Form Leading the Market with Convenience and Extended Shelf Life

Powdered mineral premixes are forecasted to hold a 38.3% share of the market in 2025.

  • Versatility, affordability, and extended shelf life make powdered mineral premixes highly preferred across various health and nutrition applications.
  • Ease of handling, storage, and transportation enhances their suitability for food products, beverages, dietary supplements, and functional formulations.
  • Rising consumer interest in convenient nutritional solutions supports the continued preference for powdered forms among manufacturers.
  • Growing demand for fortified foods and personalized nutrition is expected to further accelerate the expansion of the powder form segment.

Functional Mineral Premixes Driving Health and Wellness Trends

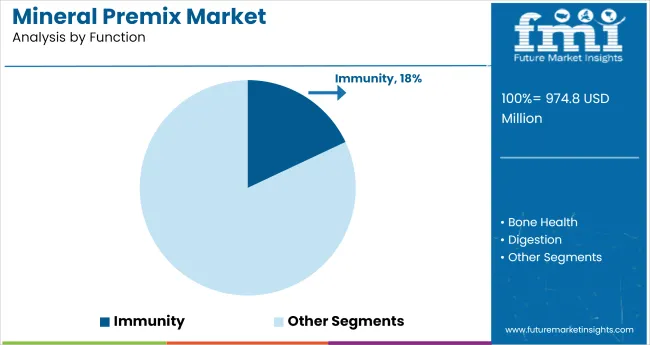
The functional segment is expected to capture a substantial 29% market share by 2025.

  • Growing consumer interest in personalized, health-enhancing products is boosting demand across food, beverage, supplement, and wellness applications.
  • The function-based segment is witnessing strong growth, with bone health, immunity, digestion, and energy management driving demand.
  • Functional mineral premixes are tailored to support specific health goals, offering targeted solutions for improving overall wellness.
  • Rising focus on bone health is increasing the use of calcium, magnesium, and vitamin D, while immunity-focused blends with zinc and vitamin C are gaining popularity.

Food Sector Leading in Application with Nutrient Fortification Demand

The food sector is expected to hold a 43.2% share of the mineral premix market by 2025, driven by rising demand for fortified foods.

  • Rising consumer demand for nutrient-dense options is encouraging the food industry to introduce fortified products focused on health and wellness.
  • Mineral premixes including calcium, iron, and magnesium enhance the nutritional profile of dairy items, snacks, beverages, and ready-to-eat meals.
  • Functional food trends are driving manufacturers to incorporate mineral premixes into formulations targeting health-conscious buyers.
  • Increasing demand for clean-label and naturally fortified products is expected to strengthen the food sector's leading position in the mineral premix market.

Key Industry Highlights

Growing Focus on Preventive Healthcare Drives Demand for Mineral Premixes in the Food Industry

The growing inclination of consumers toward preventative healthcare is a significant trend impacting the global mineral premix industry. Many people are starting to seek for fortified food products that are high in vitamins and minerals as they become more conscious of the crucial functions that nutrition plays in overall health. The need to prevent chronic diseases and maintain good health is the main driving force behind this movement.

Manufacturers are significantly improving their product lines to fulfill consumer expectations as a result of the creation of novel and inventive mineral premix solutions that would satisfy this growing need. This demonstrates unequivocally how important nutrition is to general health, making mineral premixes essential components of the modern diet.

In addition, dietary changes and urbanization are increasing consumption of processed foods, which typically lack essential nutrients. This makes it possible for mineral premixes to enhance nutrition in a variety of food applications, such as dairy products, drinks, and dietary supplements. The market is poised for significant expansion as a result of the investments made by businesses like Nutreco N.V. and Glanbia plc in the research and development of customized premix solutions.

This trend not only responds to the demands of customers now, but it is also reshaping the food industry's future to promote better and healthier nutrition worldwide. Thus, aforementioned factors are likely to influence positively the mineral premix industry analysis during the forecast period.

Customized Products Drive Growth in the Mineral Premix Market, Especially in Sports Nutrition

Companies in the mineral premix industry are introducing highly personalized goods and making frequent adjustments to meet the changing needs of consumers, particularly in the sports nutrition line where energy and low-fat drinks have become more and more popular.

In order to help replenish electrolytes lost during exercise, the "Sport Isotonic" drink premix aims to reinforce the formulas of isotonic sports beverages with essential minerals like potassium, sodium, magnesium, and calcium. Additionally, the developments make sense in terms of both revenue-generating market expansion and innovations aimed at consumers.

In the meantime, there is a growing need for specialized nutritional solutions, with several mineral premixes created especially for sportsmen. The nutritional profile of products like energy drinks and snacks is further enhanced by these premixes. For instance, the iron, calcium, and magnesium in the "Energy" premix help to eliminate weariness and improve energy metabolism.

The market for mineral premixes is expected to grow significantly due to the growing awareness of personalized nutrition, even though specific micronutrient formulations are also becoming more popular. This trend saw certain dietary needs met while muscles were being restored after exercise.

Constraints Hindering Growth in the Mineral Premixes Market: Production and Demand Challenges

The market for mineral premixes is hampered by a variety of production limitations. The chemistry of the vitamin premix becomes more complex as more substances are added, increasing the intricacy of the entire production process. High potential chemical interactions between the additives could cause caking and stability issues, which would make quality-safety tests very expensive.

When homogeneity is breached, the product becomes ineffective. Strict regulations between food and feed would make operations more challenging in terms of production costs and restrict smaller-scale companies' ability to compete and invest. Thus, these limitations would prevent the market for mineral premixes from expanding as a whole.

From a demand perspective, consumers are more hesitant to purchase pricey but durable goods. Particularly in price-focused economies where the bare minimum nutritional demands take precedence over enhancement choices, many consumers are unwilling to pay extra for foods that are believed to be fortified.

Concerns about excessive vitamin intake and its associated health repercussions are additional factors that may deter consumers from purchasing such goods. This is particularly true in less developed regions where there is a significantly lower level of nutrition knowledge. Therefore, during the forecast period, these boundaries are likely to limit the market's expansion for mineral premixes.

Market Concentration

The mineral premix industry is dominated by Tier 1 companies, which also own substantial stakes and show up as dominant players. They set the standard for innovation and industry trends worldwide. Among them are Koninklijke DSM N.V. and Glanbia plc. They use cutting-edge product formulas and a vast distribution network to deliver premium mineral premixes. This demonstrates that Glanbia is a significant manufacturer who also values sustainability and improving nutrition, aligning with the mineral premix industry outlook.

Tier 2 companies are localized businesses that have a specialty and offer specialized goods to meet local needs. Such companies use specialized marketing to sell customized, cutting-edge goods that cater to particular dietary requirements. For instance, Nutreco N.V. is highly skilled in creating mineral premixes for aquaculture and animal nutrition, and SternVitamin GmbH & Co. KG offers numerous specialized products relevant to certain uses.

Smaller businesses that operate in regional marketplaces are usually classified as Tier 3 enterprises. Examples of companies playing significant roles are Wright Enrichment Inc. and Watson Foods Co., Inc., which provide specialized mineral premixes for smaller food producers, thereby meeting regional nutritional demands.

Country-wise Insights

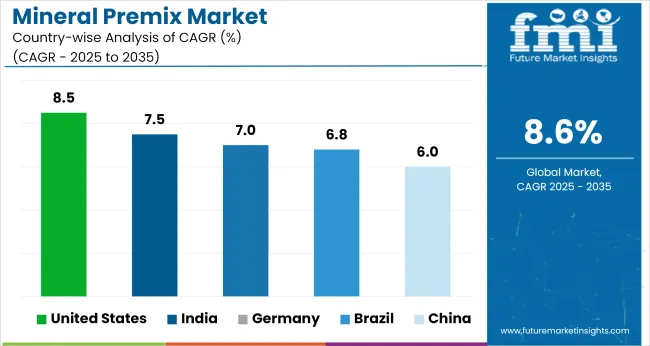
The following table shows the estimated growth rates of the top three territories. The USA, China and Germany are set to exhibit high consumption, recording CAGRs of 8.5%, 6.0% and 7.0%, respectively, through 2035.

Countries CAGR, 2025 to 2035
The USA 8.5%
China 6.0%
Germany 7.0%
India 7.5%
Brazil 6.8%

Growing Emphasis on Proactive Healthcare Fuels the USA Mineral Premix Market Growth

The market for premix minerals in the United States is expected to develop significantly as wellness and preventative health trends drive this expansion. The demand for mineral-enriched products is further increased by customers' increased willingness to actively seek health solutions and their increased awareness of nutrition, which has led users to choose fortified food items.

Mineral-rich dietary supplements and functional meals are two examples of such items. Major market participants like Corbion N.V. and Glanbia plc, who invest in creating innovative mineral premix solutions tailored to certain dietary requirements, provided impetus for the growth of the USA mineral premix industry.

The USA industry is going to see a lot of changes due to new formulation technologies and a growing focus on customized nutrition. The growing demand for functional foods and sports nutrition products presents excellent prospects for producers of mineral premixes. The USA mineral premix market appears to be a promising sector for the future, further solidifying its position as a global leader. Thus, preventive health trends and customized nutrition solutions are major factors garnering the demand for mineral premix during forecast period.

Rising Demand for Fortified Animal Feed Drives Growth in Brazil Mineral Premix Sector

The market for mineral premix in Brazil essentially exhibits enormous growth potential at the moment, given the demand from all industries, particularly food and animal nutrition. The need for more fortified products to meet dietary intake needs is rising as a result of the population's continued growth and increased awareness of nutritional deficiencies in today's world.

The demand for mineral premixes in Brazil was high among the livestock and poultry feed industries, indicating that manufacturers are looking at ways to improve animal productivity and health through specific mineral formulations. These businesses include Vitablend Nederland BV and Nutreco N.V., both of which are dedicated to creating solutions that are specifically tailored to Brazil's needs.

Brazil's mineral premix business will have plenty of customers as a result of the fast changing agricultural sector and rising consumer concerns about the sustainability of food. Food makers are being encouraged by an increasing number of health-conscious consumers to use mineral premixes into functional foods and beverages in order to enhance their nutritional content.

Product development innovation will satisfy consumer needs for quality and transparency as clean-label movements gain traction. Brazil's dedication to raising nutrition standards across all sectors will lead to the growth of the mineral premix industry.

India Market for Mineral Premix: Driven by Food Fortification Initiatives

The Indian mineral premix market is expanding rapidly, as a result of continuous attempts to fortify food and consumer demands for superior foods With the emphasis on food to alleviate nutritional deficiencies, fortified products like functional foods and nutritional supplements grew rapidly.

In order to improve the overall nutrition of a number of products, companies are innovating in the development of customized mineral blends that are matched to individual dietary demands. The market for mineral premix in India has had extraordinary growth, which greatly contributes to the worldwide market's total expansion.

Leading Mineral Premix Supplier

The mineral premix market is shaped by both established leaders and emerging players. Major players like Corbion N.V., Glanbia plc, Koninklijke DSM N.V., and Nutreco N.V. dominate with their advanced R&D and broad product offerings. Corbion’s Nutrivan line and Glanbia’s strong market position showcase their ability to meet the growing demand for customized premixes.

DSM focuses on tailored solutions for the food and beverage industries, offering diverse applications. Meanwhile, emerging players such as SternVitamin GmbH & Co. KG and Vitablend Nederland BV are carving niches with specialized formulations and functional blends that cater to specific industry needs.

The market is moderately fragmented, with entry barriers including regulatory compliance, high R&D costs, and the need for specialized manufacturing capabilities. Consolidation is occurring through strategic acquisitions, as seen with Nutreco’s acquisition of Micronutrients, further strengthening its market position. This trend highlights the market's evolving nature, where companies aim to diversify and enhance their portfolios to stay competitive and meet consumer demands for customized and innovative products.

Recent Mineral Premix Industry News

  • Nutreco N.V. recently acquired Micronutrients, a leader in the development of nutrient-dense premixes for animal feed, expanding its reach in the livestock nutrition segment.
  • Glanbia plc announced the opening of an innovation center for mineral premix research, allowing the company to improve its R&D in functional foods and better cater to the growing demand for fortified food products globally.

Leading Brands

  • Corbion N.V.,
  • Farbest-Tallman Foods Corporation
  • Glanbia plc
  • Koninklijke DSM N.V.,
  • Nutreco N.V.
  • SternVitamin GmbH & Co. KG,
  • Vitablend Nederland BV
  • Watson Foods Co., Inc.
  • Wright Enrichment Inc.
  • Zagro Asia Ltd.
  • Others

Key Segments of the Report

By Form:

As per Form, the industry has been categorized into Powder and Liquid.

By Function:

As per Function, the industry has been categorized into Bone Health, Immunity, Digestion, Energy, Heart Health, Weight Management, Vision Health, Brain Health and Memory, Resistance and Others.

By Application:

This segment is further categorized into Food Sector, Dietary Supplement, Pharma OTC Drugs, Pet Food, and Other Applications.

By Region:

Mineral Premix Industry analysis has been carried out in key countries of North America, Latin America, Europe, East Asia, South Asia, Oceania, and the Middle East & Africa.

Table of Content

  1. Executive Summary
  2. Industry Introduction, Including Taxonomy and Market Definition
  3. Market Trends and Success Factors, Including Macro-Economic Factors, Market Dynamics, and Recent Industry Developments
  4. Global Market Demand Analysis 2020 to 2024 and Forecast 2025 to 2035, including Historical Analysis and Future Projections
  5. Pricing Analysis
  6. Global Market Analysis 2020 to 2024 and Forecast 2025 to 2035
    • Form
    • Function
    • Application
    • Region
  7. Global Market Analysis 2020 to 2024 and Forecast 2025 to 2035, by Form
    • Powder
    • Liquid
  8. Global Market Analysis 2020 to 2024 and Forecast 2025 to 2035, by Function
    • Bone Health
    • Immunity
    • Digestion
    • Energy
    • Heart Health
    • Weight Management
    • Vision Health
    • Brain Health and Memory, Resistance
    • Others
  9. Global Market Analysis 2020 to 2024 and Forecast 2025 to 2035, by Application
    • Food Sector
    • Dietary Supplement
    • Pharma OTC Drugs
    • Pet Food
    • Other Applications
  10. Global Market Analysis 2020 to 2024 and Forecast 2025 to 2035, by Region
    • North America
    • Latin America
    • Western Europe
    • Eastern Europe
    • Balkans & Baltic
    • Russia & Belarus
    • Central Asia
    • East Asia
    • South Asia & Pacific
    • Middle East & Africa
  11. North America Sales Analysis 2020 to 2024 and Forecast 2025 to 2035, by Key Segments and Countries
  12. Latin America Sales Analysis 2020 to 2024 and Forecast 2025 to 2035, by Key Segments and Countries
  13. Western Europe Sales Analysis 2020 to 2024 and Forecast 2025 to 2035, by Key Segments and Countries
  14. Eastern Europe Sales Analysis 2020 to 2024 and Forecast 2025 to 2035, by Key Segments and Countries
  15. Balkans & Baltic Sales Analysis 2020 to 2024 and Forecast 2025 to 2035, by Key Segments and Countries
  16. Russia & Belarus Sales Analysis 2020 to 2024 and Forecast 2025 to 2035, by Key Segments and Countries
  17. Central Asia Sales Analysis 2020 to 2024 and Forecast 2025 to 2035, by Key Segments and Countries
  18. East Asia Sales Analysis 2020 to 2024 and Forecast 2025 to 2035, by Key Segments and Countries
  19. South Asia & Pacific Sales Analysis 2020 to 2024 and Forecast 2025 to 2035, by Key Segments and Countries
  20. Middle East & Africa Sales Analysis 2020 to 2024 and Forecast 2025 to 2035, by Key Segments and Countries
  21. Sales Forecast 2025 to 2035 by Form, Function, Application, for 30 Countries
  22. Competition Outlook, including Market Structure Analysis, Company Share Analysis by Key Players, and Competition Dashboard
  23. Company Profile
    • Corbion N.V.
    • Farbest-Tallman Foods Corporation
    • Glanbia plc
    • Koninklijke DSM N.V.
    • Nutreco N.V.
    • SternVitamin GmbH & Co. KG
    • Vitablend Nederland BV
    • Watson Foods Co., Inc.
    • Wright Enrichment Inc.
    • Zagro Asia Ltd.
    • Others

List of Tables

  • Table 01: Global Market Value (USD Million) Forecast by Region, 2020 to 2035
  • Table 02: Global Market Volume (MT) Forecast by Region, 2020 to 2035
  • Table 03: Global Market Value (USD Million) Forecast by Form, 2020 to 2035
  • Table 04: Global Market Volume (MT) Forecast by Form, 2020 to 2035
  • Table 05: Global Market Value (USD Million) Forecast by Function, 2020 to 2035
  • Table 06: Global Market Volume (MT) Forecast by Function, 2020 to 2035
  • Table 07: Global Market Value (USD Million) Forecast by Application, 2020 to 2035
  • Table 08: Global Market Volume (MT) Forecast by Application, 2020 to 2035
  • Table 09: North America Market Value (USD Million) Forecast by Country, 2020 to 2035
  • Table 10: North America Market Volume (MT) Forecast by Country, 2020 to 2035
  • Table 11: North America Market Value (USD Million) Forecast by Form, 2020 to 2035
  • Table 12: North America Market Volume (MT) Forecast by Form, 2020 to 2035
  • Table 13: North America Market Value (USD Million) Forecast by Function, 2020 to 2035
  • Table 14: North America Market Volume (MT) Forecast by Function, 2020 to 2035
  • Table 15: North America Market Value (USD Million) Forecast by Application, 2020 to 2035
  • Table 16: North America Market Volume (MT) Forecast by Application, 2020 to 2035
  • Table 17: Latin America Market Value (USD Million) Forecast by Country, 2020 to 2035
  • Table 18: Latin America Market Volume (MT) Forecast by Country, 2020 to 2035
  • Table 19: Latin America Market Value (USD Million) Forecast by Form, 2020 to 2035
  • Table 20: Latin America Market Volume (MT) Forecast by Form, 2020 to 2035
  • Table 21: Latin America Market Value (USD Million) Forecast by Function, 2020 to 2035
  • Table 22: Latin America Market Volume (MT) Forecast by Function, 2020 to 2035
  • Table 23: Latin America Market Value (USD Million) Forecast by Application, 2020 to 2035
  • Table 24: Latin America Market Volume (MT) Forecast by Application, 2020 to 2035
  • Table 25: Europe Market Value (USD Million) Forecast by Country, 2020 to 2035
  • Table 26: Europe Market Volume (MT) Forecast by Country, 2020 to 2035
  • Table 27: Europe Market Value (USD Million) Forecast by Form, 2020 to 2035
  • Table 28: Europe Market Volume (MT) Forecast by Form, 2020 to 2035
  • Table 29: Europe Market Value (USD Million) Forecast by Function, 2020 to 2035
  • Table 30: Europe Market Volume (MT) Forecast by Function, 2020 to 2035
  • Table 31: Europe Market Value (USD Million) Forecast by Application, 2020 to 2035
  • Table 32: Europe Market Volume (MT) Forecast by Application, 2020 to 2035
  • Table 33: East Asia Market Value (USD Million) Forecast by Country, 2020 to 2035
  • Table 34: East Asia Market Volume (MT) Forecast by Country, 2020 to 2035
  • Table 35: East Asia Market Value (USD Million) Forecast by Form, 2020 to 2035
  • Table 36: East Asia Market Volume (MT) Forecast by Form, 2020 to 2035
  • Table 37: East Asia Market Value (USD Million) Forecast by Function, 2020 to 2035
  • Table 38: East Asia Market Volume (MT) Forecast by Function, 2020 to 2035
  • Table 39: East Asia Market Value (USD Million) Forecast by Application, 2020 to 2035
  • Table 40: East Asia Market Volume (MT) Forecast by Application, 2020 to 2035
  • Table 41: South Asia Market Value (USD Million) Forecast by Country, 2020 to 2035
  • Table 42: South Asia Market Volume (MT) Forecast by Country, 2020 to 2035
  • Table 43: South Asia Market Value (USD Million) Forecast by Form, 2020 to 2035
  • Table 44: South Asia Market Volume (MT) Forecast by Form, 2020 to 2035
  • Table 45: South Asia Market Value (USD Million) Forecast by Function, 2020 to 2035
  • Table 46: South Asia Market Volume (MT) Forecast by Function, 2020 to 2035
  • Table 47: South Asia Market Value (USD Million) Forecast by Application, 2020 to 2035
  • Table 48: South Asia Market Volume (MT) Forecast by Application, 2020 to 2035
  • Table 49: Oceania Market Value (USD Million) Forecast by Country, 2020 to 2035
  • Table 50: Oceania Market Volume (MT) Forecast by Country, 2020 to 2035
  • Table 51: Oceania Market Value (USD Million) Forecast by Form, 2020 to 2035
  • Table 52: Oceania Market Volume (MT) Forecast by Form, 2020 to 2035
  • Table 53: Oceania Market Value (USD Million) Forecast by Function, 2020 to 2035
  • Table 54: Oceania Market Volume (MT) Forecast by Function, 2020 to 2035
  • Table 55: Oceania Market Value (USD Million) Forecast by Application, 2020 to 2035
  • Table 56: Oceania Market Volume (MT) Forecast by Application, 2020 to 2035
  • Table 57: MEA Market Value (USD Million) Forecast by Country, 2020 to 2035
  • Table 58: MEA Market Volume (MT) Forecast by Country, 2020 to 2035
  • Table 59: MEA Market Value (USD Million) Forecast by Form, 2020 to 2035
  • Table 60: MEA Market Volume (MT) Forecast by Form, 2020 to 2035
  • Table 61: MEA Market Value (USD Million) Forecast by Function, 2020 to 2035
  • Table 62: MEA Market Volume (MT) Forecast by Function, 2020 to 2035
  • Table 63: MEA Market Value (USD Million) Forecast by Application, 2020 to 2035
  • Table 64: MEA Market Volume (MT) Forecast by Application, 2020 to 2035

List of Figures

  • Figure 01: Global Market Value (USD Million) by Form, 2025 to 2035
  • Figure 02: Global Market Value (USD Million) by Function, 2025 to 2035
  • Figure 03: Global Market Value (USD Million) by Application, 2025 to 2035
  • Figure 04: Global Market Value (USD Million) by Region, 2025 to 2035
  • Figure 05: Global Market Value (USD Million) Analysis by Region, 2020 to 2035
  • Figure 06: Global Market Volume (MT) Analysis by Region, 2020 to 2035
  • Figure 07: Global Market Value Share (%) and BPS Analysis by Region, 2025 to 2035
  • Figure 08: Global Market Y-o-Y Growth (%) Projections by Region, 2025 to 2035
  • Figure 09: Global Market Value (USD Million) Analysis by Form, 2020 to 2035
  • Figure 10: Global Market Volume (MT) Analysis by Form, 2020 to 2035
  • Figure 11: Global Market Value Share (%) and BPS Analysis by Form, 2025 to 2035
  • Figure 12: Global Market Y-o-Y Growth (%) Projections by Form, 2025 to 2035
  • Figure 13: Global Market Value (USD Million) Analysis by Function, 2020 to 2035
  • Figure 14: Global Market Volume (MT) Analysis by Function, 2020 to 2035
  • Figure 15: Global Market Value Share (%) and BPS Analysis by Function, 2025 to 2035
  • Figure 16: Global Market Y-o-Y Growth (%) Projections by Function, 2025 to 2035
  • Figure 17: Global Market Value (USD Million) Analysis by Application, 2020 to 2035
  • Figure 18: Global Market Volume (MT) Analysis by Application, 2020 to 2035
  • Figure 19: Global Market Value Share (%) and BPS Analysis by Application, 2025 to 2035
  • Figure 20: Global Market Y-o-Y Growth (%) Projections by Application, 2025 to 2035
  • Figure 21: Global Market Attractiveness by Form, 2025 to 2035
  • Figure 22: Global Market Attractiveness by Function, 2025 to 2035
  • Figure 23: Global Market Attractiveness by Application, 2025 to 2035
  • Figure 24: Global Market Attractiveness by Region, 2025 to 2035
  • Figure 25: North America Market Value (USD Million) by Form, 2025 to 2035
  • Figure 26: North America Market Value (USD Million) by Function, 2025 to 2035
  • Figure 27: North America Market Value (USD Million) by Application, 2025 to 2035
  • Figure 28: North America Market Value (USD Million) by Country, 2025 to 2035
  • Figure 29: North America Market Value (USD Million) Analysis by Country, 2020 to 2035
  • Figure 30: North America Market Volume (MT) Analysis by Country, 2020 to 2035
  • Figure 31: North America Market Value Share (%) and BPS Analysis by Country, 2025 to 2035
  • Figure 32: North America Market Y-o-Y Growth (%) Projections by Country, 2025 to 2035
  • Figure 33: North America Market Value (USD Million) Analysis by Form, 2020 to 2035
  • Figure 34: North America Market Volume (MT) Analysis by Form, 2020 to 2035
  • Figure 35: North America Market Value Share (%) and BPS Analysis by Form, 2025 to 2035
  • Figure 36: North America Market Y-o-Y Growth (%) Projections by Form, 2025 to 2035
  • Figure 37: North America Market Value (USD Million) Analysis by Function, 2020 to 2035
  • Figure 38: North America Market Volume (MT) Analysis by Function, 2020 to 2035
  • Figure 39: North America Market Value Share (%) and BPS Analysis by Function, 2025 to 2035
  • Figure 40: North America Market Y-o-Y Growth (%) Projections by Function, 2025 to 2035
  • Figure 41: North America Market Value (USD Million) Analysis by Application, 2020 to 2035
  • Figure 42: North America Market Volume (MT) Analysis by Application, 2020 to 2035
  • Figure 43: North America Market Value Share (%) and BPS Analysis by Application, 2025 to 2035
  • Figure 44: North America Market Y-o-Y Growth (%) Projections by Application, 2025 to 2035
  • Figure 45: North America Market Attractiveness by Form, 2025 to 2035
  • Figure 46: North America Market Attractiveness by Function, 2025 to 2035
  • Figure 47: North America Market Attractiveness by Application, 2025 to 2035
  • Figure 48: North America Market Attractiveness by Country, 2025 to 2035
  • Figure 49: Latin America Market Value (USD Million) by Form, 2025 to 2035
  • Figure 50: Latin America Market Value (USD Million) by Function, 2025 to 2035
  • Figure 51: Latin America Market Value (USD Million) by Application, 2025 to 2035
  • Figure 52: Latin America Market Value (USD Million) by Country, 2025 to 2035
  • Figure 53: Latin America Market Value (USD Million) Analysis by Country, 2020 to 2035
  • Figure 54: Latin America Market Volume (MT) Analysis by Country, 2020 to 2035
  • Figure 55: Latin America Market Value Share (%) and BPS Analysis by Country, 2025 to 2035
  • Figure 56: Latin America Market Y-o-Y Growth (%) Projections by Country, 2025 to 2035
  • Figure 57: Latin America Market Value (USD Million) Analysis by Form, 2020 to 2035
  • Figure 58: Latin America Market Volume (MT) Analysis by Form, 2020 to 2035
  • Figure 59: Latin America Market Value Share (%) and BPS Analysis by Form, 2025 to 2035
  • Figure 60: Latin America Market Y-o-Y Growth (%) Projections by Form, 2025 to 2035
  • Figure 61: Latin America Market Value (USD Million) Analysis by Function, 2020 to 2035
  • Figure 62: Latin America Market Volume (MT) Analysis by Function, 2020 to 2035
  • Figure 63: Latin America Market Value Share (%) and BPS Analysis by Function, 2025 to 2035
  • Figure 64: Latin America Market Y-o-Y Growth (%) Projections by Function, 2025 to 2035
  • Figure 65: Latin America Market Value (USD Million) Analysis by Application, 2020 to 2035
  • Figure 66: Latin America Market Volume (MT) Analysis by Application, 2020 to 2035
  • Figure 67: Latin America Market Value Share (%) and BPS Analysis by Application, 2025 to 2035
  • Figure 68: Latin America Market Y-o-Y Growth (%) Projections by Application, 2025 to 2035
  • Figure 69: Latin America Market Attractiveness by Form, 2025 to 2035
  • Figure 70: Latin America Market Attractiveness by Function, 2025 to 2035
  • Figure 71: Latin America Market Attractiveness by Application, 2025 to 2035
  • Figure 72: Latin America Market Attractiveness by Country, 2025 to 2035
  • Figure 73: Europe Market Value (USD Million) by Form, 2025 to 2035
  • Figure 74: Europe Market Value (USD Million) by Function, 2025 to 2035
  • Figure 75: Europe Market Value (USD Million) by Application, 2025 to 2035
  • Figure 76: Europe Market Value (USD Million) by Country, 2025 to 2035
  • Figure 77: Europe Market Value (USD Million) Analysis by Country, 2020 to 2035
  • Figure 78: Europe Market Volume (MT) Analysis by Country, 2020 to 2035
  • Figure 79: Europe Market Value Share (%) and BPS Analysis by Country, 2025 to 2035
  • Figure 80: Europe Market Y-o-Y Growth (%) Projections by Country, 2025 to 2035
  • Figure 81: Europe Market Value (USD Million) Analysis by Form, 2020 to 2035
  • Figure 82: Europe Market Volume (MT) Analysis by Form, 2020 to 2035
  • Figure 83: Europe Market Value Share (%) and BPS Analysis by Form, 2025 to 2035
  • Figure 84: Europe Market Y-o-Y Growth (%) Projections by Form, 2025 to 2035
  • Figure 85: Europe Market Value (USD Million) Analysis by Function, 2020 to 2035
  • Figure 86: Europe Market Volume (MT) Analysis by Function, 2020 to 2035
  • Figure 87: Europe Market Value Share (%) and BPS Analysis by Function, 2025 to 2035
  • Figure 88: Europe Market Y-o-Y Growth (%) Projections by Function, 2025 to 2035
  • Figure 89: Europe Market Value (USD Million) Analysis by Application, 2020 to 2035
  • Figure 90: Europe Market Volume (MT) Analysis by Application, 2020 to 2035
  • Figure 91: Europe Market Value Share (%) and BPS Analysis by Application, 2025 to 2035
  • Figure 92: Europe Market Y-o-Y Growth (%) Projections by Application, 2025 to 2035
  • Figure 93: Europe Market Attractiveness by Form, 2025 to 2035
  • Figure 94: Europe Market Attractiveness by Function, 2025 to 2035
  • Figure 95: Europe Market Attractiveness by Application, 2025 to 2035
  • Figure 96: Europe Market Attractiveness by Country, 2025 to 2035
  • Figure 97: East Asia Market Value (USD Million) by Form, 2025 to 2035
  • Figure 98: East Asia Market Value (USD Million) by Function, 2025 to 2035
  • Figure 99: East Asia Market Value (USD Million) by Application, 2025 to 2035
  • Figure 100: East Asia Market Value (USD Million) by Country, 2025 to 2035
  • Figure 101: East Asia Market Value (USD Million) Analysis by Country, 2020 to 2035
  • Figure 102: East Asia Market Volume (MT) Analysis by Country, 2020 to 2035
  • Figure 103: East Asia Market Value Share (%) and BPS Analysis by Country, 2025 to 2035
  • Figure 104: East Asia Market Y-o-Y Growth (%) Projections by Country, 2025 to 2035
  • Figure 105: East Asia Market Value (USD Million) Analysis by Form, 2020 to 2035
  • Figure 106: East Asia Market Volume (MT) Analysis by Form, 2020 to 2035
  • Figure 107: East Asia Market Value Share (%) and BPS Analysis by Form, 2025 to 2035
  • Figure 108: East Asia Market Y-o-Y Growth (%) Projections by Form, 2025 to 2035
  • Figure 109: East Asia Market Value (USD Million) Analysis by Function, 2020 to 2035
  • Figure 110: East Asia Market Volume (MT) Analysis by Function, 2020 to 2035
  • Figure 111: East Asia Market Value Share (%) and BPS Analysis by Function, 2025 to 2035
  • Figure 112: East Asia Market Y-o-Y Growth (%) Projections by Function, 2025 to 2035
  • Figure 113: East Asia Market Value (USD Million) Analysis by Application, 2020 to 2035
  • Figure 114: East Asia Market Volume (MT) Analysis by Application, 2020 to 2035
  • Figure 115: East Asia Market Value Share (%) and BPS Analysis by Application, 2025 to 2035
  • Figure 116: East Asia Market Y-o-Y Growth (%) Projections by Application, 2025 to 2035
  • Figure 117: East Asia Market Attractiveness by Form, 2025 to 2035
  • Figure 118: East Asia Market Attractiveness by Function, 2025 to 2035
  • Figure 119: East Asia Market Attractiveness by Application, 2025 to 2035
  • Figure 120: East Asia Market Attractiveness by Country, 2025 to 2035
  • Figure 121: South Asia Market Value (USD Million) by Form, 2025 to 2035
  • Figure 122: South Asia Market Value (USD Million) by Function, 2025 to 2035
  • Figure 123: South Asia Market Value (USD Million) by Application, 2025 to 2035
  • Figure 124: South Asia Market Value (USD Million) by Country, 2025 to 2035
  • Figure 125: South Asia Market Value (USD Million) Analysis by Country, 2020 to 2035
  • Figure 126: South Asia Market Volume (MT) Analysis by Country, 2020 to 2035
  • Figure 127: South Asia Market Value Share (%) and BPS Analysis by Country, 2025 to 2035
  • Figure 128: South Asia Market Y-o-Y Growth (%) Projections by Country, 2025 to 2035
  • Figure 129: South Asia Market Value (USD Million) Analysis by Form, 2020 to 2035
  • Figure 130: South Asia Market Volume (MT) Analysis by Form, 2020 to 2035
  • Figure 131: South Asia Market Value Share (%) and BPS Analysis by Form, 2025 to 2035
  • Figure 132: South Asia Market Y-o-Y Growth (%) Projections by Form, 2025 to 2035
  • Figure 133: South Asia Market Value (USD Million) Analysis by Function, 2020 to 2035
  • Figure 134: South Asia Market Volume (MT) Analysis by Function, 2020 to 2035
  • Figure 135: South Asia Market Value Share (%) and BPS Analysis by Function, 2025 to 2035
  • Figure 136: South Asia Market Y-o-Y Growth (%) Projections by Function, 2025 to 2035
  • Figure 137: South Asia Market Value (USD Million) Analysis by Application, 2020 to 2035
  • Figure 138: South Asia Market Volume (MT) Analysis by Application, 2020 to 2035
  • Figure 139: South Asia Market Value Share (%) and BPS Analysis by Application, 2025 to 2035
  • Figure 140: South Asia Market Y-o-Y Growth (%) Projections by Application, 2025 to 2035
  • Figure 141: South Asia Market Attractiveness by Form, 2025 to 2035
  • Figure 142: South Asia Market Attractiveness by Function, 2025 to 2035
  • Figure 143: South Asia Market Attractiveness by Application, 2025 to 2035
  • Figure 144: South Asia Market Attractiveness by Country, 2025 to 2035
  • Figure 145: Oceania Market Value (USD Million) by Form, 2025 to 2035
  • Figure 146: Oceania Market Value (USD Million) by Function, 2025 to 2035
  • Figure 147: Oceania Market Value (USD Million) by Application, 2025 to 2035
  • Figure 148: Oceania Market Value (USD Million) by Country, 2025 to 2035
  • Figure 149: Oceania Market Value (USD Million) Analysis by Country, 2020 to 2035
  • Figure 150: Oceania Market Volume (MT) Analysis by Country, 2020 to 2035
  • Figure 151: Oceania Market Value Share (%) and BPS Analysis by Country, 2025 to 2035
  • Figure 152: Oceania Market Y-o-Y Growth (%) Projections by Country, 2025 to 2035
  • Figure 153: Oceania Market Value (USD Million) Analysis by Form, 2020 to 2035
  • Figure 154: Oceania Market Volume (MT) Analysis by Form, 2020 to 2035
  • Figure 155: Oceania Market Value Share (%) and BPS Analysis by Form, 2025 to 2035
  • Figure 156: Oceania Market Y-o-Y Growth (%) Projections by Form, 2025 to 2035
  • Figure 157: Oceania Market Value (USD Million) Analysis by Function, 2020 to 2035
  • Figure 158: Oceania Market Volume (MT) Analysis by Function, 2020 to 2035
  • Figure 159: Oceania Market Value Share (%) and BPS Analysis by Function, 2025 to 2035
  • Figure 160: Oceania Market Y-o-Y Growth (%) Projections by Function, 2025 to 2035
  • Figure 161: Oceania Market Value (USD Million) Analysis by Application, 2020 to 2035
  • Figure 162: Oceania Market Volume (MT) Analysis by Application, 2020 to 2035
  • Figure 163: Oceania Market Value Share (%) and BPS Analysis by Application, 2025 to 2035
  • Figure 164: Oceania Market Y-o-Y Growth (%) Projections by Application, 2025 to 2035
  • Figure 165: Oceania Market Attractiveness by Form, 2025 to 2035
  • Figure 166: Oceania Market Attractiveness by Function, 2025 to 2035
  • Figure 167: Oceania Market Attractiveness by Application, 2025 to 2035
  • Figure 168: Oceania Market Attractiveness by Country, 2025 to 2035
  • Figure 169: MEA Market Value (USD Million) by Form, 2025 to 2035
  • Figure 170: MEA Market Value (USD Million) by Function, 2025 to 2035
  • Figure 171: MEA Market Value (USD Million) by Application, 2025 to 2035
  • Figure 172: MEA Market Value (USD Million) by Country, 2025 to 2035
  • Figure 173: MEA Market Value (USD Million) Analysis by Country, 2020 to 2035
  • Figure 174: MEA Market Volume (MT) Analysis by Country, 2020 to 2035
  • Figure 175: MEA Market Value Share (%) and BPS Analysis by Country, 2025 to 2035
  • Figure 176: MEA Market Y-o-Y Growth (%) Projections by Country, 2025 to 2035
  • Figure 177: MEA Market Value (USD Million) Analysis by Form, 2020 to 2035
  • Figure 178: MEA Market Volume (MT) Analysis by Form, 2020 to 2035
  • Figure 179: MEA Market Value Share (%) and BPS Analysis by Form, 2025 to 2035
  • Figure 180: MEA Market Y-o-Y Growth (%) Projections by Form, 2025 to 2035
  • Figure 181: MEA Market Value (USD Million) Analysis by Function, 2020 to 2035
  • Figure 182: MEA Market Volume (MT) Analysis by Function, 2020 to 2035
  • Figure 183: MEA Market Value Share (%) and BPS Analysis by Function, 2025 to 2035
  • Figure 184: MEA Market Y-o-Y Growth (%) Projections by Function, 2025 to 2035
  • Figure 185: MEA Market Value (USD Million) Analysis by Application, 2020 to 2035
  • Figure 186: MEA Market Volume (MT) Analysis by Application, 2020 to 2035
  • Figure 187: MEA Market Value Share (%) and BPS Analysis by Application, 2025 to 2035
  • Figure 188: MEA Market Y-o-Y Growth (%) Projections by Application, 2025 to 2035
  • Figure 189: MEA Market Attractiveness by Form, 2025 to 2035
  • Figure 190: MEA Market Attractiveness by Function, 2025 to 2035
  • Figure 191: MEA Market Attractiveness by Application, 2025 to 2035
  • Figure 192: MEA Market Attractiveness by Country, 2025 to 2035

Frequently Asked Questions

What is the current value of the Mineral Premix industry?

The global industry is estimated at a value of USD 974.8 million in 2025.

At what rate did the sales for Mineral Premix grow between 2020 and 2024?

Sales increased at 6.3% CAGR between 2020 and 2024.

Who are the leading manufacturers of Mineral Premix?

Some of the leaders in this industry include Corbion N.V., Farbest-Tallman Foods Corporation, Glanbia plc, Koninklijke DSM N.V., Nutreco N.V., SternVitamin GmbH & Co. KG, Vitablend Nederland BV, Watson Foods Co., Inc., Wright Enrichment Inc. and Zagro Asia Ltd..

Which region will garner a significant value share by 2025?

The North America region is projected to hold a revenue share of 34.3% over the forecast period.

At what CAGR is the global forecast to grow from 2025 to 2035?

The industry is projected to grow at a forecast CAGR of 8.6% from 2025 to 2035.

Explore Similar Insights

Future Market Insights

Mineral Premix Market