In 2025, the global mineral enrichment ingredients market is valued at USD 1.6 billion and is projected to reach approximately USD 2.3 billion by 2035, expanding at a CAGR of 3.8%. This growth reflects the steady incorporation of mineral fortification across food and beverage applications, supported by heightened consumer awareness of nutritional adequacy and regulatory initiatives promoting balanced diets. Regional adoption patterns vary significantly, influenced by dietary preferences, public health policies, and industrial readiness for fortification technologies.
North America represents a mature market with well-established fortification frameworks. The United States leads in mineral-enriched product development, particularly in breakfast cereals, dairy alternatives, and fortified beverages. Demand for calcium, magnesium, and iron ingredients remains strong due to lifestyle-related nutritional deficiencies and aging population dynamics. Manufacturers are focusing on clean-label formulations and bioavailable mineral complexes that align with consumer expectations for health transparency. In Canada, mandatory restoration of iron and folate in refined flours and cereals supports consistent ingredient demand, reinforcing North America’s leadership in structured nutritional enhancement.
Europe follows a regulation-driven model governed by the European Food Safety Authority (EFSA). Countries such as Germany, France, and the United Kingdom are advancing fortified dairy, bakery, and infant nutrition products. Iron and zinc remain essential additives addressing dietary gaps, while Northern European nations demonstrate growing use of iodine and selenium in functional foods. Clean-label adoption trends dominate, with producers turning to natural mineral sources such as seaweed extracts and plant-based compounds. The mineral enrichment ingredients market’s direction is reinforced by consumer preference for traceable ingredients and transparent nutritional claims, which are influencing large-scale reformulation strategies among European food manufacturers.
Asia-Pacific is the fastest-expanding region in this market, reflecting large-scale government nutrition programs and rapid dietary transitions. China and India are key growth engines, where iron and calcium fortification in staples such as flour, rice, and dairy products is increasing to address micronutrient deficiencies. Expanding middle-class populations and higher consumption of processed and convenience foods are driving ingredient use in bakery, beverage, and infant formula sectors. Japan and South Korea exhibit growing interest in premium fortified products that cater to preventive health and aging-related nutritional concerns, with innovations centered around mineral bioavailability and stability in liquid formulations.
Latin America, led by Brazil and Mexico, demonstrates steady progress through government-backed micronutrient initiatives and private investment in fortified dairy and grain-based products. The Middle East and Africa are recording gradual fortification expansion, primarily supported by public health programs in Gulf nations and South Africa’s established enrichment mandates.
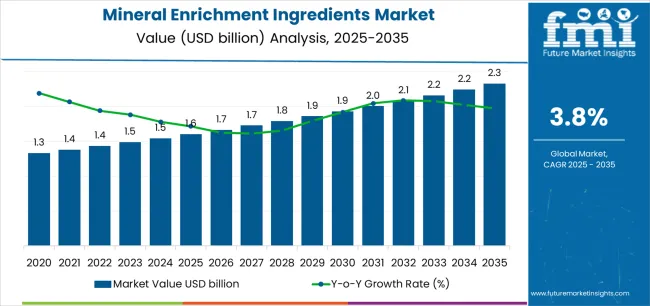
| Metric | Value |
|---|---|
| Market Value (2025) | USD 1.6 billion |
| Market Forecast Value (2035) | USD 2.3 billion |
| Forecast CAGR (2025-2035) | 3.8% |
| HEALTH & NUTRITION TRENDS | FOOD FORTIFICATION REQUIREMENTS | REGULATORY & QUALITY STANDARDS |
|---|---|---|
| Global Nutritional Deficiency Awareness Continuous expansion of micronutrient deficiency awareness across established and emerging markets driving demand for fortified food solutions. Preventive Healthcare Focus Growing emphasis on preventive nutrition and immunity enhancement creating demand for mineral-enriched functional ingredients. Premium Nutritional Positioning Superior bioavailability and efficacy characteristics making mineral enrichment ingredients essential for health-focused food applications. | Sophisticated Formulation Requirements Modern food manufacturing requires mineral ingredients delivering precise nutritional control and enhanced product performance. Processing Stability Demands Food manufacturers investing in premium mineral forms offering consistent bioavailability while maintaining processing efficiency. Quality and Bioavailability Standards Certified suppliers with proven absorption characteristics required for advanced nutritional fortification applications. | Food Fortification Standards Regulatory requirements establishing nutritional benchmarks favoring high-quality mineral enrichment solutions. Nutritional Labeling Requirements Quality standards requiring superior purity levels and resistance to degradation stresses in processing. Dietary Compliance Requirements Diverse nutritional requirements and quality standards driving need for sophisticated mineral ingredient inputs. |
| Category | Segments Covered |
|---|---|
| By Form | Powder, Granule |
| By Ingredient Type | Zinc, Sodium, Potassium, Calcium, Phosphorous, Magnesium |
| By End Use | Food Industry, Dairy, Bakery & Confectionary, Breakfast Cereals, Meat & Fish, Ready-to-eat meals |
| By Region | North America, Europe, Asia Pacific, Latin America, Middle East & Africa |
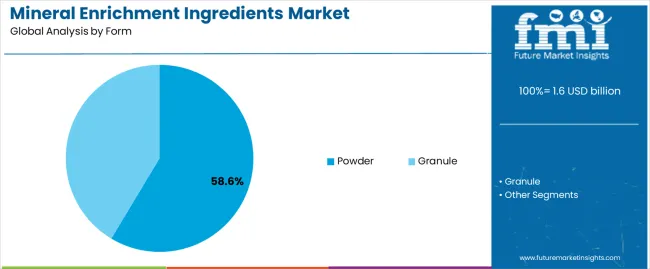
| Segment | 2025 to 2035 Outlook |
|---|---|
| Powder | Leader in 2025 with 58.3% market share; likely to maintain leadership through 2035. Broadest use across beverage fortification, bakery applications, and supplement manufacturing with mature supply chain and predictable solubility characteristics. Superior dispersion properties and ease of incorporation into various food matrices. Momentum: steady-to-strong. Watchouts: handling challenges with hygroscopic minerals and dust generation concerns in manufacturing facilities. |
| Granule | Growing segment with 41.7% share, offering advantages in controlled release, reduced dust generation, and improved handling characteristics. Preferred for direct compression applications, cereal fortification, and products requiring sustained mineral release. Better flowability and reduced segregation versus powder forms. Momentum: rising steadily driven by cereal fortification growth and premix manufacturing efficiency requirements. Watchouts: higher production costs and slower dissolution rates limiting applications in liquid products and rapid-dissolution requirements. |
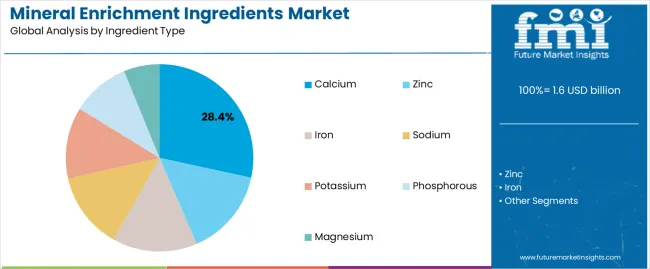
| Segment | 2025 to 2035 Outlook |
|---|---|
| Zinc | Leading mineral with 23.7% share in 2025, critical for immune function support and widespread deficiency prevention programs. Dominant in fortification of cereals, infant nutrition, and functional beverages with established safety profiles. Momentum: steady-to-strong growth driven by immunity-focused product development and deficiency prevalence in developing markets. Watchouts: taste masking challenges and interaction effects with other minerals requiring sophisticated formulation approaches. |
| Sodium | Significant mineral with 19.2% share, essential for electrolyte balance and food processing functionality. Widely used across multiple food categories but facing scrutiny from sodium reduction initiatives. Momentum: flat-to-moderate as reformulation pressures balance against functional necessity in food manufacturing. Watchouts: increasing regulatory pressure for sodium reduction and negative consumer perception requiring careful positioning and alternative development. |
| Potassium | Growing segment with 17.8% share, benefiting from sodium replacement strategies and cardiovascular health positioning. Increasingly adopted in reduced-sodium formulations and sports nutrition applications. Momentum: rising steadily through 2030 driven by heart health trends and clean label reformulations. Watchouts: bitter taste profile challenges and higher costs versus sodium limiting broad adoption in price-sensitive segments. |
| Calcium | Established mineral with 16.4% share, critical for bone health positioning across dairy alternatives, cereals, and beverages. Strong regulatory support for fortification in multiple product categories. Momentum: moderate growth supported by aging demographics and plant-based dairy expansion requiring calcium fortification. Watchouts: bioavailability variations across different calcium salts and formulation challenges with protein interactions and precipitation issues. |
| Phosphorous | Functional mineral with 12.6% share, essential for bone health and energy metabolism but often naturally abundant in diets. Used primarily in specialized applications and sports nutrition formulations. Momentum: steady but limited growth as natural occurrence in protein foods reduces fortification necessity. Watchouts: kidney health concerns in excess consumption and consumer awareness limitations regarding phosphorous deficiency. |
| Magnesium | Emerging mineral with 10.3% share, gaining recognition for muscle function, sleep quality, and metabolic health benefits. Growing adoption in functional foods, beverages, and sports nutrition. Momentum: rising through 2032 driven by stress management trends and athletic performance positioning. Watchouts: laxative effects at higher doses and taste challenges requiring flavor masking technologies. |
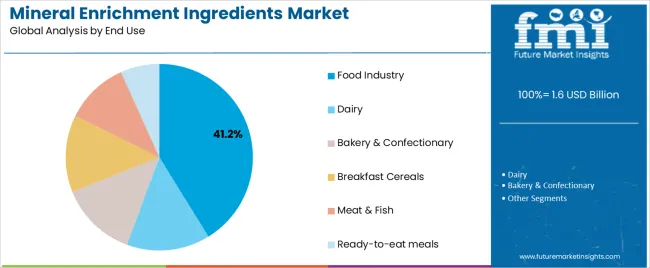
| Segment | 2025 to 2035 Outlook |
|---|---|
| Food Industry | At 41.2%, largest end-use segment in 2025 encompassing diverse fortification applications across processed foods, condiments, and packaged meals. Broad adoption driven by regulatory mandates and voluntary fortification programs. Momentum: steady growth supported by expanding fortification regulations in developing markets and clean label reformulation in developed regions. Watchouts: cost pressures in commodity food categories and formulation complexity with multiple mineral interactions. |
| Dairy | Strong segment with 18.7% share including milk fortification, yogurt enrichment, and cheese applications. Natural affinity for calcium fortification with established consumer acceptance. Momentum: moderate growth via plant-based dairy alternative expansion requiring mineral fortification to match dairy nutritional profiles. Watchouts: plant-based alternative reformulation challenges and mineral precipitation issues in certain dairy matrices. |
| Bakery & Confectionary | Established segment with 15.3% share covering bread fortification, biscuit enrichment, and nutritional bars. Regulatory support for flour fortification driving baseline demand. Momentum: steady growth through premiumization and functional bakery product development. Watchouts: processing stability challenges with high-temperature baking and mineral interactions affecting dough rheology. |
| Breakfast Cereals | High-visibility segment with 12.8% share, historically strong fortification category with established consumer expectations for mineral enrichment. Critical for childhood nutrition positioning. Momentum: moderate growth constrained by mature markets but supported by emerging market expansion and adult cereal innovation. Watchouts: sugar reduction pressures affecting overall category growth and competition from alternative breakfast formats. |
| Meat & Fish | Niche segment with 6.4% share, primarily focused on processed meat fortification and functional meat products. Limited but growing adoption in premium and health-positioned products. Momentum: selective growth in restructured meat products and value-added processing. Watchouts: consumer skepticism regarding processed meat fortification and technical challenges with mineral stability in high-protein matrices. |
| Ready-to-eat meals | Emerging segment with 5.6% share reflecting growing convenience food consumption and opportunities for nutritional enhancement. Diverse product formats enabling varied mineral fortification approaches. Momentum: rising through 2030 driven by busy lifestyles and demand for nutritionally-complete convenience solutions. Watchouts: reformulation complexity across diverse meal types and shelf-life stability challenges with multiple mineral additions. |
| DRIVERS | RESTRAINTS | KEY TRENDS |
|---|---|---|
| Micronutrient Deficiency Awareness Continuing expansion of nutritional deficiency awareness across established and emerging markets driving demand for fortified food solutions. Preventive Healthcare Recognition Increasing recognition of mineral nutrition importance in immune function efficiency and chronic disease prevention. Functional Food Positioning Growing demand for ingredients that support both nutritional benefits and processing functionality in food manufacturing. | Raw Material Price Volatility Mineral source price fluctuations affecting production costs and supply chain predictability for manufacturers. Bioavailability Complexity Formulation challenges and mineral interaction concerns requiring significant technical expertise and testing investments. Regulatory Variations Varying fortification regulations across regional markets affecting product specifications and compliance costs. Organoleptic Challenges Taste, color, and texture impacts influencing product acceptability and requiring sophisticated formulation solutions. | Advanced Bioavailability Technologies Integration of chelated minerals, microencapsulation, and nanoparticle formulations enabling superior absorption efficiency. Clean Label Solutions Enhanced natural mineral sources, organic-compliant options, and simplified ingredient declarations compared to traditional synthetic forms. Personalized Nutrition Applications Development of targeted mineral formulations and dosage optimization technologies providing customized nutritional support opportunities. Synergistic Formulations Integration of complementary minerals and vitamin cofactors for enhanced efficacy and comprehensive nutritional solutions. |
| Country | CAGR (2025-2035) |
|---|---|
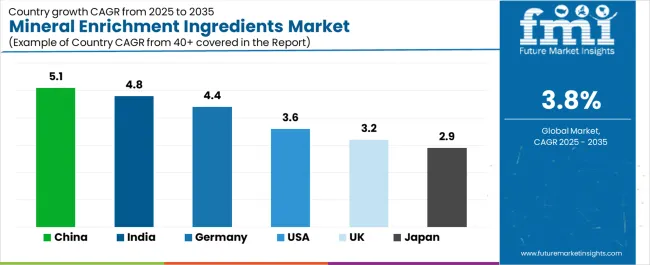
| China | 5.1% |
| India | 4.8% |
| Germany | 4.4% |
| United States | 3.6% |
| United Kingdom | 3.2% |
| Japan | 2.9% |
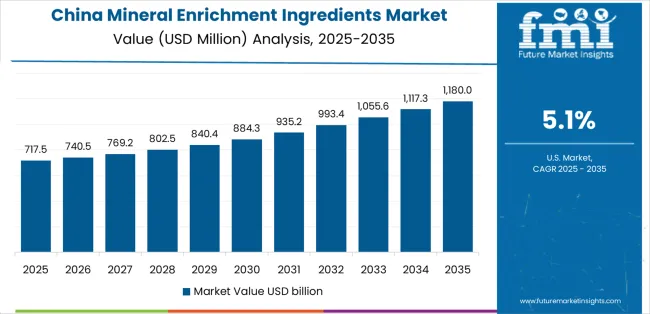
Revenue from mineral enrichment ingredients in China is projected to grow at a 5.1% CAGR from 2025 to 2035, driven by expanding public health nutrition programs and comprehensive food fortification mandates. These initiatives create substantial opportunities for mineral ingredient suppliers in various sectors, including processed food, infant nutrition, and specialty fortification. China's established leadership in food manufacturing, combined with growing nutritional awareness campaigns, has resulted in significant demand for both conventional and organic mineral enrichment solutions. The food manufacturing sector continues to invest in local production facilities to support large-scale fortification operations, ensuring a steady supply of high-quality mineral ingredients.
The country's growing public health initiatives, such as the national nutrition plan and school nutrition programs, are crucial drivers of demand, stimulating adoption of mineral fortification across diverse food segments. With an emphasis on bioavailability and cost-effectiveness, these initiatives create significant opportunities for mineral ingredient suppliers. The expansion of the infant formula market and maternal nutrition programs are facilitating the adoption of premium mineral ingredients in key production regions across China.
Revenue from mineral enrichment ingredients in India is expected to expand at a 4.8% CAGR between 2025 and 2035. This growth is driven by the country's ongoing battle against widespread nutritional deficiencies, coupled with the implementation of government fortification programs. These programs have created a sustained demand for reliable mineral ingredients across food manufacturing categories and public health initiatives. India’s food processing sector has also expanded rapidly, resulting in increased investment in fortification facilities to meet the growing demands of both public health operations and consumer nutrition. The government's initiatives to tackle micronutrient deficiencies, particularly through the fortification of staple foods such as wheat flour, oil, and rice, have contributed significantly to market growth. The mid-day meal scheme and food subsidy program modernization have further fueled demand for mineral ingredients across India's vast population.
Germany is expected to see the mineral enrichment ingredients market reach USD 100.9 million by 2035, growing at a 4.4% CAGR. This growth is supported by Germany’s leadership in functional food manufacturing and its adoption of advanced nutritional ingredient technologies. German food companies are investing in high-purity mineral systems, utilizing sophisticated chelation techniques to enhance operational efficiency, ingredient traceability, and compliance with stringent nutritional standards. The country’s emphasis on maintaining high-quality food products continues to drive demand for specialized mineral enrichment solutions. Germany’s food industry prioritizes operational excellence, investing in advanced mineral technologies that provide superior bioavailability and purity. This trend is further strengthened by clean label initiatives, which are driving demand for organic mineral compounds.
Revenue from mineral enrichment ingredients in the United States is projected to grow at a 3.6% CAGR from 2025 to 2035. This growth is primarily driven by the expansion of the dietary supplement market and increasing personalized nutrition innovation. The United States’ robust functional food manufacturing base and growing consumer demand for nutritional awareness are creating opportunities for ingredient suppliers to provide mineral solutions that meet diverse formulation requirements while maintaining high bioavailability standards. The adoption of mineral ingredients in dietary supplements and fortification operations is expected to continue its upward trajectory in line with consumer preferences for health optimization. Dietary supplement innovations and personalized nutrition developments have created a significant demand for mineral ingredients that can support various dosage requirements and bioavailability standards.
Demand for Mineral Enrichment Ingredients in United Kingdom is projected to reach USD 74.5 million by 2035, expanding at a CAGR of 3.2%, driven by flour fortification mandates and public health nutrition capabilities supporting bread enrichment and comprehensive preventive health applications. The country's established food safety tradition and growing nutritional policy focus are creating demand for high-quality mineral ingredients that support regulatory compliance and public health standards. Ingredient manufacturers and food processing suppliers are maintaining comprehensive development capabilities to support mandatory fortification requirements.
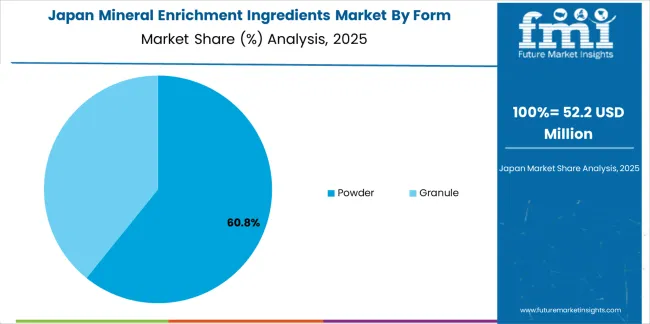
Demand for Mineral Enrichment Ingredients in Japan is projected to reach USD 65.7 million by 2035, expanding at a CAGR of 2.9%, driven by aging population nutritional needs and sophisticated functional food capabilities supporting bone health products and comprehensive wellness applications. The country's established quality excellence tradition and meticulous nutritional standards are creating demand for ultra-pure mineral ingredients that support exacting bioavailability and safety standards. Ingredient manufacturers and supplement suppliers are maintaining rigorous development capabilities to support premium product requirements.
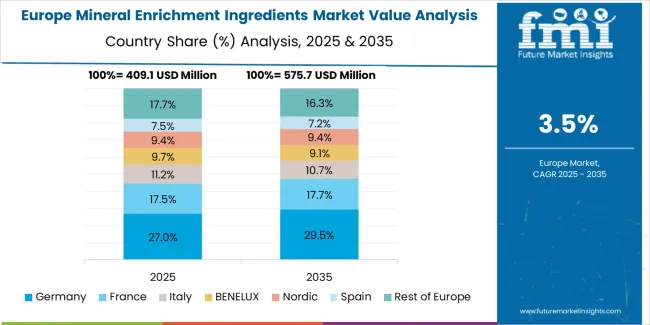
The mineral enrichment ingredients market in Europe is projected to grow from USD 70.0 million in 2025 to USD 100.5 million by 2035, registering a CAGR of 3.8% over the forecast period. Germany is expected to maintain its leadership position with a 28.9% market share in 2025, supported by its advanced functional food manufacturing infrastructure and comprehensive nutritional ingredient development capabilities across major food production clusters in Bavaria, North Rhine-Westphalia, and Baden-Württemberg regions.
France follows with a 19.3% share in 2025, projected to reach 19.7% by 2035, driven by comprehensive food fortification programs and dairy enrichment initiatives. The United Kingdom holds an 18.5% share in 2025, expected to maintain 18.2% by 2035 due to flour fortification mandates and public health nutrition programs. Italy commands a 14.8% share, while Spain accounts for 12.3% in 2025. The Rest of Europe region is anticipated to maintain stable momentum with 6.2% share, attributed to increasing mineral fortification adoption in Nordic countries and emerging Eastern European food processing facilities implementing nutritional enhancement programs.
European mineral enrichment ingredient operations are increasingly polarized between Western European premium formulation excellence and Eastern European cost-competitive fortification manufacturing. German and French facilities dominate chelated mineral production and organic-certified ingredient applications, leveraging advanced bioavailability technologies and strict quality protocols that command price premiums in functional food markets. German manufacturers maintain leadership in pharmaceutical-grade mineral compounds and specialized absorption-enhancing formulations, with major supplement and functional food companies driving technical specifications that smaller suppliers must meet to access premium supply contracts.
Eastern European operations in Poland, Hungary, and Romania are capturing volume-oriented fortification contracts through cost advantages and EU regulatory compliance, particularly in basic mineral salt production and mandatory flour fortification applications. These facilities increasingly serve as production capacity for Western European brands while developing their own technical expertise and quality systems.
The regulatory environment presents both opportunities and constraints. EFSA health claim approval processes create barriers for novel mineral formulations but establish efficacy standards that favor scientifically-validated European ingredients over unsubstantiated imports. EU fortification regulations vary by member state, creating complexity but also opportunities for suppliers with regulatory expertise across multiple markets.
Supply chain consolidation accelerates as ingredient manufacturers seek economies of scale to absorb rising quality testing costs and traceability requirements. Vertical integration increases, with major food manufacturers establishing direct relationships with mineral producers to secure ingredient quality and supply consistency. Smaller ingredient suppliers face pressure to specialize in high-bioavailability formulations or risk displacement by larger, more diversified operations serving mainstream fortification requirements.
Japanese mineral enrichment ingredient operations reflect the country's exacting purity standards and sophisticated absorption efficacy expectations. Major food and supplement manufacturers including Takeda, DHC, and Otsuka maintain rigorous supplier qualification processes that exceed international standards, requiring extensive stability testing, absorption studies, and comprehensive documentation that can take 12-18 months to complete. This creates high barriers for new suppliers but ensures consistent quality that supports premium product positioning and health claim substantiation.
The Japanese market demonstrates unique formulation preferences, with significant demand for amino acid chelated minerals and highly soluble organic mineral salts tailored to liquid supplement formats and functional beverages. Companies require specific particle size distributions and dissolution profiles that differ from Western applications, driving demand for customized production capabilities and specialized analytical testing.
Regulatory oversight through the Ministry of Health, Labour and Welfare emphasizes comprehensive safety validation and health claim substantiation requirements that surpass most international standards. The Foods with Function Claims system requires robust clinical evidence for mineral efficacy, creating advantages for suppliers with scientific research partnerships and published absorption data.
Supply chain management focuses on long-term research collaborations rather than purely transactional procurement. Japanese companies typically maintain stable supplier relationships spanning decades, with partnerships emphasizing joint product development and technical innovation over price negotiation. This stability supports investment in Japan-specific mineral forms and customized bioavailability enhancement technologies.
South Korean mineral enrichment ingredient operations reflect the country's advanced functional food sector and health-conscious consumer base. Major food and pharmaceutical companies including Korea Ginseng Corporation, CJ CheilJedang, and Ildong Pharmaceutical drive sophisticated mineral formulation strategies, establishing direct relationships with international ingredient suppliers to secure premium chelated minerals and organic-certified materials for their functional food and supplement operations targeting domestic and Asian export markets.
The Korean market demonstrates particular strength in combining traditional herbal ingredients with modern mineral fortification, with companies developing integrated formulations that appeal to consumers seeking both traditional wisdom and scientific validation. This integration approach creates demand for mineral forms that complement botanical extracts and maintain stability in complex formulations.
Regulatory frameworks emphasize comprehensive safety documentation and health claim substantiation, with Korean Food and Drug Administration standards requiring extensive testing for novel mineral forms and combinations. This creates barriers for unproven ingredients but benefits established mineral suppliers who can demonstrate clinical efficacy and safety profiles.
Supply chain efficiency remains critical given Korea's quality expectations and competitive market dynamics. Companies increasingly pursue certified organic mineral sources and non-GMO verified ingredients to meet consumer preferences while maintaining competitive positioning. Investment in advanced delivery technologies including liposomal encapsulation and sustained-release matrices supports premium product differentiation.
The mineral enrichment ingredients market faces pressure from price-competitive Chinese ingredients and consumer skepticism regarding synthetic fortification, driving Korean manufacturers to emphasize natural mineral sources and food-derived extraction methods. However, the premium positioning of Korean functional foods and supplements internationally continues to support demand for high-bioavailability mineral ingredients that meet stringent quality specifications.
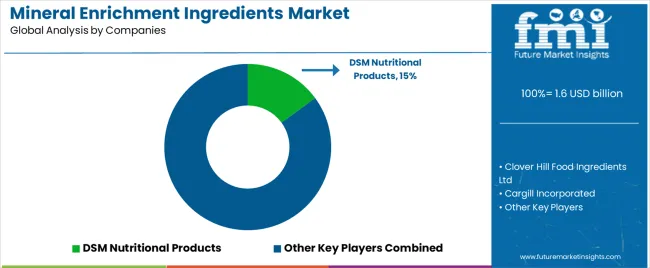
The Mineral Enrichment Ingredients Market is growing steadily as food and beverage manufacturers respond to increasing consumer awareness of micronutrient deficiencies and the pursuit of functional, health-focused diets. Minerals are being incorporated into dairy products, infant nutrition, sports supplements, fortified beverages, and bakery items to support bone health, energy metabolism, cognitive function, and immune performance. This demand is reinforced by preventive healthcare trends and government-led fortification initiatives in both developed and emerging economies.
Clover Hill Food Ingredients Ltd and Glanbia Nutritionals supply tailored mineral premixes and ingredient systems designed to enhance nutritional profiles while maintaining taste and texture. Cargill Incorporated and ADM WILD Europe GmbH & Co. KG are leveraging global formulation expertise to support large-scale fortified food and drink manufacturing. Nestlé S.A. has integrated mineral enrichment directly into its consumer product lines, influencing formulation standards across the broader industry.
Ingredient specialists such as Arla Foods Ingredients and Balchem Corporation are developing high-bioavailability mineral forms aimed at improving absorption and digestive tolerance. Wilmar International Limited, Jungbunzlauer Suisse AG, and Gadot Biochemical Industries Ltd are expanding supply of mineral salts, organic mineral complexes, and clean-label fortification ingredients to meet rising global demand for nutritionally enhanced, health-oriented food products.
| Stakeholder Type | Primary Advantage | Repeatable Plays |
|---|---|---|
| Global nutrition ingredient leaders | Research capabilities, regulatory expertise, production scale | Long-term fortification partnerships, technical support, regulatory navigation |
| Specialized chelated mineral producers | Absorption technology, patent portfolios, efficacy data | Chelation licensing, bioavailability studies, premium positioning |
| Vertically-integrated food companies | Captive supply, quality control, formulation integration | Internal fortification programs, cost optimization, specification control |
| Bioavailability technology innovators | Next-generation delivery, clinical validation, IP protection | Liposomal encapsulation, sustained release, personalized dosing |
| Organic & natural mineral specialists | Clean label credentials, certification expertise, traceability | Organic certification, non-GMO verification, food-derived sources |
| Items | Values |
|---|---|
| Quantitative Units | USD 1.6 billion |
| Form | Powder, Granule |
| Ingredient Type | Zinc, Sodium, Potassium, Calcium, Phosphorous, Magnesium |
| End Use | Food Industry, Dairy, Bakery & Confectionary, Breakfast Cereals, Meat & Fish, Ready-to-eat meals |
| Regions Covered | North America, Latin America, Europe, Asia Pacific, Middle East & Africa |
| Country Covered | United States, Germany, United Kingdom, China, India, Japan, and other 40+ countries |
| Key Companies Profiled | Clover Hill Food Ingredients Ltd, Cargill Incorporated, ADM WILD Europe GmbH & Co. KG, Nestlé S.A., Wilmar International Limited, Balchem Corporation, Glanbia Nutritionals, Arla Foods Ingredients, Jungbunzlauer Suisse AG, and Gadot Biochemical Industries Ltd |
| Additional Attributes | Dollar sales by form/ingredient type/end use, regional demand (NA, EU, APAC), competitive landscape, chelated vs. inorganic mineral adoption, bioavailability enhancement integration, and clean label innovations driving nutritional fortification, deficiency prevention, and functional food development |
By Form
The global mineral enrichment ingredients market is estimated to be valued at USD 1.6 billion in 2025.
The market size for the mineral enrichment ingredients market is projected to reach USD 2.3 billion by 2035.
The mineral enrichment ingredients market is expected to grow at a 3.8% CAGR between 2025 and 2035.
The key product types in mineral enrichment ingredients market are powder and granule.
In terms of ingredient type, zinc segment to command 23.7% share in the mineral enrichment ingredients market in 2025.


Our Research Products

The "Full Research Suite" delivers actionable market intel, deep dives on markets or technologies, so clients act faster, cut risk, and unlock growth.

The Leaderboard benchmarks and ranks top vendors, classifying them as Established Leaders, Leading Challengers, or Disruptors & Challengers.

Locates where complements amplify value and substitutes erode it, forecasting net impact by horizon

We deliver granular, decision-grade intel: market sizing, 5-year forecasts, pricing, adoption, usage, revenue, and operational KPIs—plus competitor tracking, regulation, and value chains—across 60 countries broadly.

Spot the shifts before they hit your P&L. We track inflection points, adoption curves, pricing moves, and ecosystem plays to show where demand is heading, why it is changing, and what to do next across high-growth markets and disruptive tech

Real-time reads of user behavior. We track shifting priorities, perceptions of today’s and next-gen services, and provider experience, then pace how fast tech moves from trial to adoption, blending buyer, consumer, and channel inputs with social signals (#WhySwitch, #UX).

Partner with our analyst team to build a custom report designed around your business priorities. From analysing market trends to assessing competitors or crafting bespoke datasets, we tailor insights to your needs.
Supplier Intelligence
Discovery & Profiling
Capacity & Footprint
Performance & Risk
Compliance & Governance
Commercial Readiness
Who Supplies Whom
Scorecards & Shortlists
Playbooks & Docs
Category Intelligence
Definition & Scope
Demand & Use Cases
Cost Drivers
Market Structure
Supply Chain Map
Trade & Policy
Operating Norms
Deliverables
Buyer Intelligence
Account Basics
Spend & Scope
Procurement Model
Vendor Requirements
Terms & Policies
Entry Strategy
Pain Points & Triggers
Outputs
Pricing Analysis
Benchmarks
Trends
Should-Cost
Indexation
Landed Cost
Commercial Terms
Deliverables
Brand Analysis
Positioning & Value Prop
Share & Presence
Customer Evidence
Go-to-Market
Digital & Reputation
Compliance & Trust
KPIs & Gaps
Outputs
Full Research Suite comprises of:
Market outlook & trends analysis
Interviews & case studies
Strategic recommendations
Vendor profiles & capabilities analysis
5-year forecasts
8 regions and 60+ country-level data splits
Market segment data splits
12 months of continuous data updates
DELIVERED AS:
PDF EXCEL ONLINE
Demand for Mineral Enrichment Ingredients in Japan Size and Share Forecast Outlook 2025 to 2035
Demand for Mineral Enrichment Ingredients in USA Size and Share Forecast Outlook 2025 to 2035
Mineral Scanner Market Size and Share Forecast Outlook 2025 to 2035
Mineral Processing Equipment Market Size and Share Forecast Outlook 2025 to 2035
Mineral Sunscreen Market Size and Share Forecast Outlook 2025 to 2035
Mineral Based Transformer Oil Market Size and Share Forecast Outlook 2025 to 2035
Mineral Wool Material Market Size and Share Forecast Outlook 2025 to 2035
Ingredients Market for Plant-based Food & Beverages Size and Share Forecast Outlook 2025 to 2035
Mineral Insulated Cables Market Analysis - Size, Share, and Forecast Outlook 2025 to 2035
Mineral Premix Market Analysis - Size, Share, and Forecast Outlook 2025 to 2035
Mineral Yeast Market Analysis by Calcium Yeast, Selenium Yeast, Zinc Yeast, and Other Fortified Yeast Types Through 2035
Mineral Wool Market by Type & Application from 2025 to 2035
Key Companies & Market Share in the Mineral Wool Sector
Mineral Feed Market Analysis - Growth, Demand & Livestock Nutrition
Mineral Fortification Market Insights – Nutrient-Rich Foods & Industry Growth 2024 to 2034
Mineral Adsorbent Market
Demineralized Whey Powder Market Size, Growth, and Forecast for 2025 to 2035
Hair Mineral Analyzer Market Size and Share Forecast Outlook 2025 to 2035
Food Minerals Market Size and Share Forecast Outlook 2025 to 2035
Bean Ingredients Market Size and Share Forecast Outlook 2025 to 2035

Thank you!
You will receive an email from our Business Development Manager. Please be sure to check your SPAM/JUNK folder too.
Chat With
MaRIA