The mineral scanner market demonstrates a consistent upward trajectory, expanding from USD 1,575.7 million in 2025 to USD 3,042.2 million by 2035 at a CAGR of 6.8%. The initial phase, from 2025 to 2028, exhibits moderate acceleration as early adoption rises in mining, geology, and industrial mineral exploration sectors. During this period, demand is driven by the need for accurate, real-time mineral analysis, improved operational efficiency, and a reduction in resource wastage. Advancements in portable and automated scanning technologies support faster deployment and uptake in small- to medium-scale mining operations.
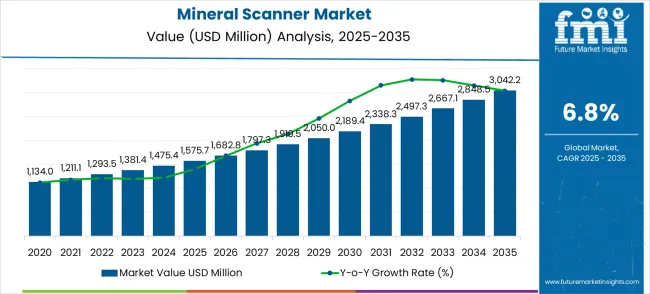
Between 2028 and 2032, the market experiences a steadier pace, reflecting broader industry adoption and technology standardization. Investments in large-scale mining operations and exploration projects provide constant incremental growth, while competitive pricing and improved scanner accuracy contribute to market stability. From 2032 to 2035, growth accelerates once again, fueled by rising demand for critical minerals in renewable energy, electric vehicles, and high-tech industries.
Technological innovations, such as AI-integrated scanners and enhanced imaging capabilities, increase scanning speed and precision. The market exhibits alternating phases of acceleration and steadiness, illustrating a balanced pattern where adoption gains momentum with technological improvements and industrial expansion. Suppliers can leverage these patterns to time product launches, scale production, and focus on high-demand applications for maximum market impact.
| Metric | Value |
|---|---|
| Estimated Value in (2025E) | USD 1,575.7 million |
| Forecast Value in (2035F) | USD 3,042.2 million |
| Forecast CAGR (2025 to 2035) | 6.8% |
Trends in the mineral scanner market include integration of drone-mounted and handheld scanners for remote and hard-to-access terrains. Manufacturers are innovating with multi-sensor technology combining X-ray, laser, and spectroscopic detection to increase accuracy and reduce analysis time. AI-driven software and real-time 3D geological modeling are improving decision-making and exploration efficiency. Expansion into rare earth element detection, deep-sea mining, and automated mining vehicles is broadening market applications. Partnerships between equipment developers, research institutions, and mining companies are driving customized solutions for complex geological formations. Focus on resource optimization, safety, precise mapping, and regulatory adherence is enhancing global adoption, making scanners critical for modern, technology-driven mineral exploration.
The mineral scanner market is divided into mining and exploration at 40%, geological research at 23%, construction and infrastructure assessment at 15%, environmental monitoring at 12%, and specialty industrial applications at 10%. Mining leads adoption as advanced scanners offer real-time ore detection, precise grade estimation, and automated mapping, reducing operational costs. Geological research benefits from high-resolution scanners that identify mineral compositions and subsurface structures. Construction and infrastructure sectors utilize scanners to assess soil composition and foundation suitability. Environmental monitoring uses scanners for early detection of contamination and heavy metal presence. Specialty industrial applications leverage scanners for raw material verification, quality assurance, and process optimization, reflecting growing demand for accuracy and efficiency.
The mineral scanner market represents a rapidly expanding analytical instrumentation segment driven by mineral exploration intensification, critical materials demand, and portable technology advancement. With the global market growing from USD 1,575.7 million in 2025 to USD 3,042.2 million by 2035 at a robust 6.8% CAGR, strategic opportunities emerge through AI-enhanced analysis, critical mineral specialization, and field-portable innovation. Mining applications commanding USD 547.6 million in 2025, handheld/field scanners' operational dominance, and China's exceptional 9.2% growth rate reflect the essential role of real-time compositional analysis in modern resource exploration and extraction operations.
The market benefits from converging trends, including strategic mineral security concerns, Eco friendly mining practices, and technological advances in portable spectroscopy. Handheld/field scanners' market leadership demonstrates the preference for immediate on-site analysis capabilities, while expanding applications beyond traditional mining into construction and environmental monitoring signal broader market diversification opportunities.
Modern mining companies and exploration organizations are increasingly focused on implementing analytical solutions that can enhance resource discovery, optimize extraction processes, and provide real-time compositional data for decision-making support. Mineral scanners' proven ability to deliver rapid analysis, portable operation, and reliable mineral identification makes them essential equipment for contemporary mineral exploration, mining operations, and geological research. Market expansion is being supported by the increasing global demand for efficient mineral exploration technologies and the corresponding need for rapid analytical solutions that can provide accurate mineral identification while reducing analysis time and operational costs across various geological and mining applications. Mining operators' preference for analytical equipment that combines measurement accuracy with operational convenience and cost-effectiveness is creating opportunities for innovative scanner implementations. The rising influence of critical mineral demand and strategic resource development is also contributing to increased adoption of mineral scanners that can provide specialized analysis capabilities for emerging mineral commodities and strategic materials.
The mineral scanner market is expanding with increasing adoption of portable analytical tools in mining and exploration. Handheld/field scanners dominate the device type segment with around 68% of the market, reflecting their ability to deliver rapid, on-site elemental analysis. These scanners typically offer detection limits in the range of 10–100 ppm for key metals and can analyze multiple elements simultaneously, enabling faster decision-making during exploration and ore assessment. In terms of application, mining leads with approximately 78% of the market, driven by the need for precise grade control, real-time stockpile monitoring, and efficient resource estimation.
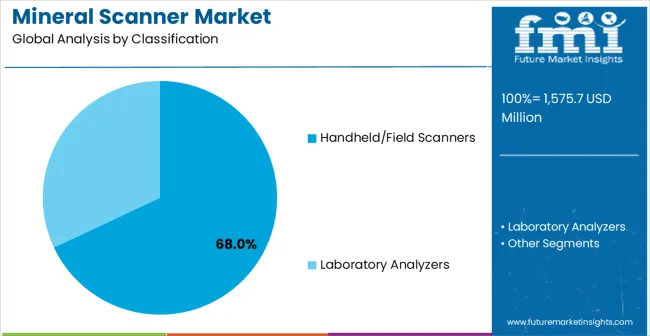
Handheld and field scanners account for approximately 68% of the device type segment, making them the preferred solution for on-site mineral analysis. These devices combine portability with high-resolution detection, providing results within seconds and reducing the need for time-consuming laboratory tests. Key manufacturers include Olympus, Thermo Fisher Scientific, Bruker, and ASD Inc. Advanced handheld scanners integrate X-ray fluorescence (XRF) and near-infrared (NIR) spectroscopy, allowing simultaneous multi-element detection. Some models offer GPS tagging and data logging for geospatial analysis, enabling operators to map ore distribution accurately. Their rugged, weather-resistant design allows use in remote and harsh mining conditions.
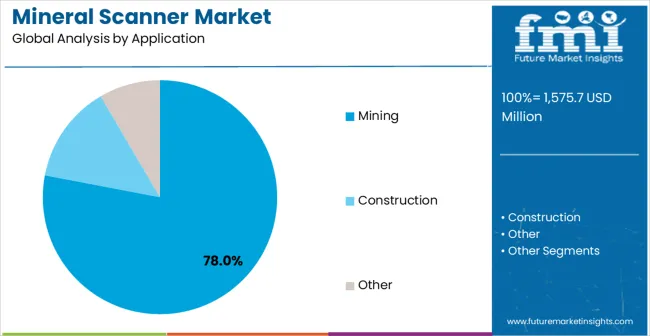
Mining accounts for approximately 78% of the application market, making it the largest segment for mineral scanners. These devices are crucial for exploration, ore grade determination, and real-time stockpile analysis, enabling operators to optimize extraction and processing workflows. Manufacturers such as Olympus, Thermo Fisher Scientific, Bruker, and ASD Inc. provide scanners capable of multi-element analysis with high repeatability and precision. Segment growth is driven by the increasing need for data-driven decision-making, efficiency in resource utilization, and cost reduction. Unique features such as portable spectrometers, GPS mapping, and integration with cloud databases allow mining companies to monitor ore quality and distribution with unprecedented speed and accuracy.
The mineral scanner market is advancing rapidly due to increasing demand for efficient mineral exploration technologies and growing adoption of portable analytical systems that provide rapid and accurate mineral identification capabilities across diverse geological and mining applications. The market faces challenges, including high equipment costs for advanced systems, the complexity of spectral data interpretation, and competition from traditional analytical methods. Innovation in artificial intelligence and machine learning continues to influence product development and market expansion patterns.
The growing focus on critical mineral exploration and strategic resource development is driving demand for mineral scanners that can identify rare earth elements, lithium, cobalt, and other strategic materials essential for renewable energy and technology applications. Advanced mineral exploration requires specialized analytical capabilities while enabling more efficient resource discovery and assessment across various geological formations and mineral deposits. Manufacturers are increasingly recognizing the competitive advantages of critical mineral analysis capabilities for strategic resource market expansion and technology leadership.
Modern mineral scanner producers are incorporating artificial intelligence and machine learning algorithms to enhance mineral identification accuracy, automate spectral analysis, and provide intelligent data interpretation for complex geological samples. These technologies improve analytical efficiency while enabling new applications, including automated mineral mapping and predictive geological modeling. Advanced AI integration also allows users to support sophisticated analytical workflows and data interpretation beyond traditional spectroscopic analysis capabilities.
| Country | CAGR (2025-2035) |
|---|---|
| China | 9.2% |
| India | 8.5% |
| Germany | 7.8% |
| Brazil | 7.1% |
| USA | 6.5% |
| UK | 5.8% |
| Japan | 5.1% |
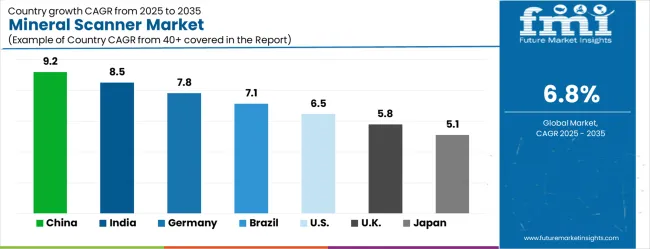
The mineral scanner market is experiencing strong growth globally, with China leading at a 9.2% CAGR through 2035, driven by expanding mineral exploration activities, the growing mining industry, and significant investment in advanced analytical technologies for resource development. India follows at 8.5%, supported by increasing mining sector development, expanding geological survey activities, and growing focus on mineral resource exploration and development. Germany shows growth at 7.8%, emphasizing technological innovation and advanced analytical instrument development. Brazil records 7.1%, focusing on mining sector expansion and mineral resource exploration programs. The USA demonstrates 6.5% growth, driven by critical mineral exploration initiatives and advanced mining technology adoption. The UK exhibits 5.8% growth, supported by geological research advancement and mining technology development. Japan shows 5.1% growth, emphasizing precision instrumentation and advanced analytical technologies.
The report covers an in-depth analysis of 40+ countries, Top-performing countries are highlighted below.
China leads the Mineral Scanner Market with a 9.2% CAGR from 2025 to 2035, well above the global average of 7.0%. Adoption is concentrated in Inner Mongolia, Xinjiang, and Shanxi, where large-scale mining operations dominate. Suppliers such as Olympus, Thermo Fisher, and Bruker provide high-precision scanners capable of rapid mineral composition analysis. Growth is driven by government-backed mining modernization projects, increasing demand for rare earth metals, and efficiency improvements in ore processing. Portable and handheld scanners are gaining popularity for field inspections, while automated scanning systems are applied in industrial mineral processing plants. Integration with predictive analytics enhances extraction planning and reduces operational delays.
India exhibits an 8.5% CAGR, above the global average of 7.0%. Adoption is concentrated in Odisha, Chhattisgarh, and Jharkhand, where iron ore, bauxite, and coal mining are prominent. Suppliers including Thermo Fisher, Bruker, and Rigaku provide scanners optimized for rapid field analysis and laboratory integration. Mining companies increasingly apply real-time scanning to improve ore grade estimation and reduce operational losses. Portable scanners are deployed for geological surveys, while automated scanning in processing plants improves accuracy. Industrial minerals, coal, and bauxite extraction benefit from predictive analytics integrated with scanner data to optimize workflow.
Germany shows a 7.8% CAGR, above the global 7.0%. Adoption is focused in Saxony, North Rhine-Westphalia, and Bavaria, where industrial minerals and specialty metal production are concentrated. Suppliers like Bruker, Olympus, and Thermo Fisher offer high-resolution scanners for laboratory and industrial use. Demand is driven by automation in mineral processing, precision in metallurgy, and environmental compliance monitoring. Portable scanners are used for mining exploration, while stationary systems support mineral quality testing. Data analytics integration enables predictive maintenance and optimized extraction. The demand for rare and specialty metals in automotive and aerospace applications contributes to growth.
Brazil has a 7.1% CAGR, slightly above the global average. Adoption is concentrated in Minas Gerais, Pará, and Goiás, where iron ore, bauxite, and gold mining dominate. Suppliers including Thermo Fisher, Bruker, and Olympus offer scanners designed for high throughput and field durability. Large-scale mining operations use stationary scanners for ore quality monitoring, while portable models support field exploration. Integration with predictive analytics assists in efficient extraction planning. Environmental monitoring regulations are increasing demand for precise mineral composition assessment. Demand is further fueled by the expansion of infrastructure projects and metallurgical industries.
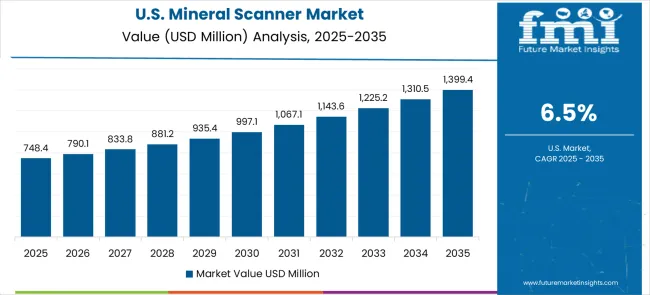
The United States grows at a 6.5% CAGR, below China and India but above the global 7.0% average. Adoption is concentrated in Nevada, Arizona, and Wyoming, where gold, copper, and coal mining are prominent. Suppliers like Olympus, Bruker, and Thermo Fisher offer handheld and stationary scanners for rapid mineral identification. Growth is fueled by automation in mineral processing, mining efficiency improvements, and regulatory compliance for environmental monitoring. Portable scanners enable field teams to conduct rapid surveys, while integration with analytical software improves ore grade prediction. Expansion in lithium and copper mining supports long-term adoption.
The UK records a 5.8% CAGR, below the global 7.0%. Adoption is concentrated in Cornwall, Northern England, and Scotland, where industrial minerals, tin, and coal deposits are found. Suppliers including Bruker, Thermo Fisher, and Rigaku provide laboratory and field scanners for mineral composition and quality assessment. Applications include ore quality verification, regulatory compliance monitoring, and research in industrial mineral production. Automated scanning solutions are integrated with predictive analytics to enhance operational efficiency. Demand is primarily driven by mining research and specialty mineral processing for metallurgical industries.
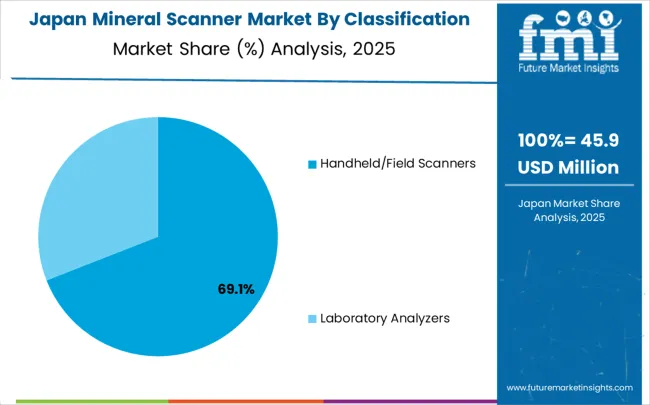
Japan exhibits a 5.1% CAGR, below the global 7.0%. Adoption is concentrated in Hokkaido, Ibaraki, and Fukuoka, where rare metals, industrial minerals, and coal deposits are present. Suppliers like Olympus, Bruker, and JASCO provide compact and high-resolution scanners for laboratory and field use. Growth is supported by mining research, industrial mineral analysis, and regulatory compliance. Portable scanners are deployed for field surveys, while stationary systems support laboratory testing. Integration with data analytics assists in mineral quality assessment and operational planning. Expansion in rare metal extraction for electronics and automotive industries drives specialized demand.
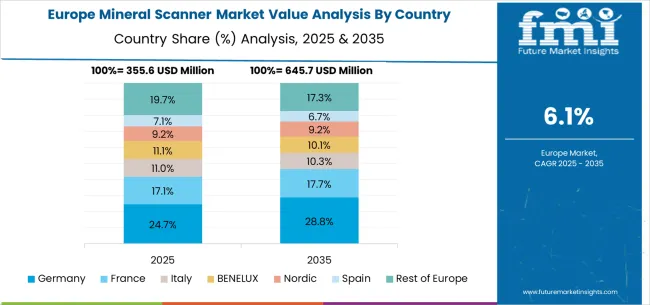
The mineral scanner market in Europe is projected to grow from USD 366.0 million in 2025 to USD 707.2 million by 2035, registering a CAGR of 6.8% over the forecast period. Germany is expected to maintain its leadership position with a 31.2% market share in 2025, moderating slightly to 30.9% by 2035, supported by its strong analytical instrument industry, advanced technology development capabilities, and comprehensive research networks serving major European markets.
The United Kingdom follows with a 21.8% share in 2025, projected to reach 22.0% by 2035, driven by robust geological research programs, an established analytical technology sector, and strong demand for advanced mineral scanning solutions across research and industrial applications. France holds a 17.9% share in 2025, rising to 18.1% by 2035, supported by research infrastructure development and increasing adoption of advanced analytical technologies in geological and industrial applications. Italy records 12.6% in 2025, inching to 12.7% by 2035, with growth underpinned by research advancement and increasing attention on analytical technology adoption in academic and industrial sectors. Spain contributes 9.1% in 2025, moving to 9.2% by 2035, supported by expanding research activities and analytical technology development programs. The Netherlands maintains a 3.2% share in 2025, growing to 3.3% by 2035. The Rest of Europe region, including Nordic countries, Eastern Europe, Belgium, Switzerland, and Austria, is anticipated to gain momentum, expanding its collective share from 4.2% to 3.8% by 2035, attributed to increasing adoption of advanced analytical technologies in Nordic countries and growing research activities across Eastern European markets implementing analytical modernization programs.
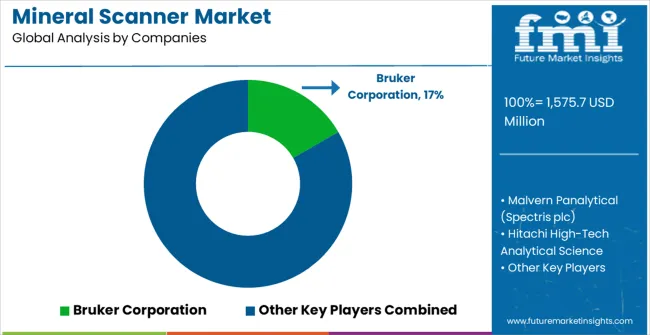
The mineral scanner market is characterized by competition among established analytical instrument manufacturers, specialized geological equipment providers, and integrated analytical solution companies. Companies are investing in advanced spectroscopy research, portable technology enhancement, artificial intelligence integration, and comprehensive analytical portfolios to deliver consistent, high-performance, and reliable mineral scanning solutions. Innovation in spectroscopic technologies, portability improvements, and data analysis capabilities is central to strengthening market position and competitive advantage.
Bruker Corporation leads the market with a strong market share, offering comprehensive analytical solutions with a focus on advanced spectroscopy technology and scientific instrumentation excellence. Malvern Panalytical provides specialized analytical equipment with an attention on materials characterization and industrial analysis applications. Hitachi High-Tech Analytical Science delivers innovative analytical technologies with a focus on portable and laboratory-based solutions. Olympus Corporation specializes in analytical instrumentation with prioritize on industrial and research applications. SciAps, Inc. focuses on portable analytical solutions and field-based analytical technologies. Rigaku Corporation offers comprehensive analytical instruments with the focus on materials analysis and research applications.
| Items | Values |
|---|---|
| Quantitative Units (2025) | USD 1,575.7 million |
| Device Type | Handheld/Field Scanners, Laboratory Analyzers |
| Application | Mining, Construction |
| Regions Covered | North America, Europe, East Asia, South Asia & Pacific, Latin America, Middle East & Africa |
| Countries Covered | United States, Canada, United Kingdom, Germany, France, China, Japan, South Korea, India, Brazil, Australia and 40+ countries |
| Key Companies Profiled | Bruker Corporation, Malvern Panalytical, Hitachi High-Tech Analytical Science, Olympus Corporation, SciAps, Inc., and Rigaku Corporation |
| Additional Attributes | Dollar sales by device type and application category, regional demand trends, competitive landscape, technological advancements in scanning systems, spectroscopy innovation, AI integration development, and analytical optimization |
The global mineral scanner market is estimated to be valued at USD 1,575.7 million in 2025.
The market size for the mineral scanner market is projected to reach USD 3,042.2 million by 2035.
The mineral scanner market is expected to grow at a 6.8% CAGR between 2025 and 2035.
The key product types in mineral scanner market are handheld/field scanners and laboratory analyzers.
In terms of application, mining segment to command 78.0% share in the mineral scanner market in 2025.


Our Research Products

The "Full Research Suite" delivers actionable market intel, deep dives on markets or technologies, so clients act faster, cut risk, and unlock growth.

The Leaderboard benchmarks and ranks top vendors, classifying them as Established Leaders, Leading Challengers, or Disruptors & Challengers.

Locates where complements amplify value and substitutes erode it, forecasting net impact by horizon

We deliver granular, decision-grade intel: market sizing, 5-year forecasts, pricing, adoption, usage, revenue, and operational KPIs—plus competitor tracking, regulation, and value chains—across 60 countries broadly.

Spot the shifts before they hit your P&L. We track inflection points, adoption curves, pricing moves, and ecosystem plays to show where demand is heading, why it is changing, and what to do next across high-growth markets and disruptive tech

Real-time reads of user behavior. We track shifting priorities, perceptions of today’s and next-gen services, and provider experience, then pace how fast tech moves from trial to adoption, blending buyer, consumer, and channel inputs with social signals (#WhySwitch, #UX).

Partner with our analyst team to build a custom report designed around your business priorities. From analysing market trends to assessing competitors or crafting bespoke datasets, we tailor insights to your needs.
Supplier Intelligence
Discovery & Profiling
Capacity & Footprint
Performance & Risk
Compliance & Governance
Commercial Readiness
Who Supplies Whom
Scorecards & Shortlists
Playbooks & Docs
Category Intelligence
Definition & Scope
Demand & Use Cases
Cost Drivers
Market Structure
Supply Chain Map
Trade & Policy
Operating Norms
Deliverables
Buyer Intelligence
Account Basics
Spend & Scope
Procurement Model
Vendor Requirements
Terms & Policies
Entry Strategy
Pain Points & Triggers
Outputs
Pricing Analysis
Benchmarks
Trends
Should-Cost
Indexation
Landed Cost
Commercial Terms
Deliverables
Brand Analysis
Positioning & Value Prop
Share & Presence
Customer Evidence
Go-to-Market
Digital & Reputation
Compliance & Trust
KPIs & Gaps
Outputs
Full Research Suite comprises of:
Market outlook & trends analysis
Interviews & case studies
Strategic recommendations
Vendor profiles & capabilities analysis
5-year forecasts
8 regions and 60+ country-level data splits
Market segment data splits
12 months of continuous data updates
DELIVERED AS:
PDF EXCEL ONLINE
Mineral Enrichment Ingredients Market Size and Share Forecast Outlook 2025 to 2035
Mineral Processing Equipment Market Size and Share Forecast Outlook 2025 to 2035
Mineral Sunscreen Market Size and Share Forecast Outlook 2025 to 2035
Mineral Based Transformer Oil Market Size and Share Forecast Outlook 2025 to 2035
Mineral Wool Material Market Size and Share Forecast Outlook 2025 to 2035
Mineral Insulated Cables Market Analysis - Size, Share, and Forecast Outlook 2025 to 2035
Mineral Premix Market Analysis - Size, Share, and Forecast Outlook 2025 to 2035
Mineral Yeast Market Analysis by Calcium Yeast, Selenium Yeast, Zinc Yeast, and Other Fortified Yeast Types Through 2035
Mineral Wool Market by Type & Application from 2025 to 2035
Key Companies & Market Share in the Mineral Wool Sector
Mineral Feed Market Analysis - Growth, Demand & Livestock Nutrition
Mineral Fortification Market Insights – Nutrient-Rich Foods & Industry Growth 2024 to 2034
Mineral Adsorbent Market
Demineralized Whey Powder Market Size, Growth, and Forecast for 2025 to 2035
Hair Mineral Analyzer Market Size and Share Forecast Outlook 2025 to 2035
Food Minerals Market Size and Share Forecast Outlook 2025 to 2035
Milk Mineral Concentrate Market Trends-Demand, Innovations & Forecast 2025 to 2035
Boron Minerals and Chemicals Market Size and Share Forecast Outlook 2025 to 2035
White Mineral Oil Market Analysis by Food, Pharmaceutical, Technical Through 2035
Trace Minerals in Feed Market Analysis by Type, Livestock, Chelate Type, Form and Region through 2025 to 2035

Thank you!
You will receive an email from our Business Development Manager. Please be sure to check your SPAM/JUNK folder too.
Chat With
MaRIA