Mineral Sunscreen Market Outlook for 2023 to 2033

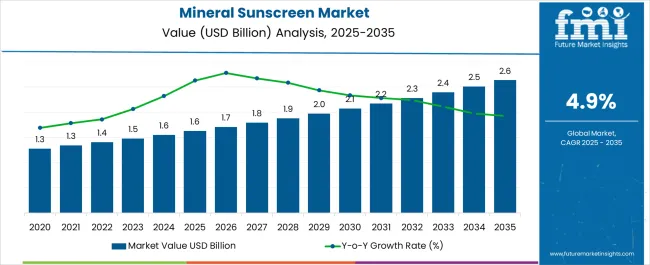
The global mineral sunscreen market size is poised to reach a valuation of US$ 2,441.0 million by 2033. The mineral sunscreen market is expected to expand at a CAGR of 5.2% through 2033 and reach a valuation of US$ 1,470.3 million by 2033.

Report Attributes Details
Mineral Sunscreen Market Size, 2022 US$ 1,403.0 million
Mineral Sunscreen Market Size, 2023 US$ 1,470.3 million
Mineral Sunscreen Market Size, 2033 US$ 2,441.0 million

Don't pay for what you don't need

Customize your report by selecting specific countries or regions and save 30%!

Key Market Highlights

Adaptive Technology Represents the Future of Sun Protection

Mineral sunscreen products are becoming more adaptable to varying lighting situations due to the incorporation of cutting-edge technologies, making them more suitable for a variety of outdoor activities. Technology that can detect variations in UV radiation levels is frequently used in adaptive mineral sunscreen formulations. These sunscreens expand their protective barrier and provide more SPF coverage when exposed to intense sunlight.

On the other hand, in low light or indoor settings, they provide lower protection. Too much coverage might be redundant and possibly irritating the skin. As consumer demand for smarter skincare products is rising, businesses are adopting adaptive technologies as a differentiator to stand out from rivals in the bustling mineral sunscreen market.

Mineral Sunscreen Industry Embracing Evolving Beauty and Cosmetic Trends

Customers are looking for products with cleaner and more natural components. Avoiding abrasive substances, synthetic additives, and fake fragrances is an increasingly popular trend. In response, companies are creating products using plant-based, organic, and sustainably sourced components.

Furthermore, gender-neutral beauty is questioning prevailing notions of beauty. Brands are releasing products and marketing initiatives that are inclusive of all genders and reject conventional gender stereotypes. In a rising trend, CBD and hemp-based products are in higher demand in the mineral sunscreen market. Due to its potential relaxing and anti-inflammatory effects, hemp- and cannabidiol-based skincare and cosmetics are becoming progressively more popular. Marketing for these products frequently focuses on relieving skin issues, including redness and inflammation.

Historical Sales Analysis vs. Demand Outlook

Attributes Details
Mineral Sunscreen Market Size (2018) US$ 1,145.5 million
Mineral Sunscreen Market Size (2022) US$ 1,403.0 million

In recent years, self-care routines have increased as consumer seek a way to relax and rejuvenate in their hectic lifestyles. Wellness and beauty are getting increasingly entwined. Customers are searching for solutions to improve attractiveness and advance general well-being. Products having nutritional value and stress-relieving qualities fall under this category. Furthermore, social media sites like Instagram and YouTube greatly impact how people view beauty products and trends. Sales of cosmetics and skincare are boosted by the tremendous influence that makeup tutorials and beauty influencers have on customer decisions.

The beauty sector will continue to undergo a digital revolution over the coming years. With the development of e-commerce, augmented reality (AR), virtual try-ons, and AI-driven recommendations, consumers will be able to enjoy highly customized beauty experiences. This dominance of digital platforms will transform how customers find, choose, and buy beauty items. It is anticipated that beauty will become increasingly more personalized. Beauty routines will become more effective and efficient through cutting-edge technology like artificial intelligence (AI) and data analytics, which will offer customers personalized product recommendations and regimens.

Sudip Saha
Sudip Saha

Principal Consultant

Talk to Analyst

Find your sweet spots for generating winning opportunities in this market.

Mineral Sunscreen Market Trend Analysis

Trends
  • Waterless or "anhydrous" cosmetic products were developed in response to water conservation concerns. These products are concentrated and water-free, minimizing packaging and environmental impact.
  • A rise in the popularity of skincare and beauty products made to block blue light from digital devices is due to growing awareness of the possible skin harm it can cause.
  • Hyaluronic acid and collagen are two examples of sustainable, lab-grown substances that the beauty industry is increasingly turning to as an alternative to conventional sourcing.
  • Products that target the mind-skin link, such as stress-relieving skincare made with adaptogens, are emerging at the nexus of neurology and cosmetics.
  • Prebiotics and probiotic-containing cosmetics are becoming more popular as customers look for ways to achieve healthier and more balanced skin.
  • In order to connect with consumer values, brands are minimizing unnecessary materials, emphasizing sustainability, and implementing minimalist and eco-friendly packaging designs.
  • Consumers are adopting simpler skincare routines and cosmetic looks, emphasizing natural beauty and minimal product consumption in accordance with the "less is more" trend in the beauty industry.
Opportunities
  • Purchases via the Internet continue to grow, especially in emerging regions, giving firms the chance to increase their digital presence and attract more customers.
  • With the opportunity to introduce clients to new products and provide firms with a recurring revenue stream, subscription-based beauty boxes, and services have become increasingly popular.
  • The shift toward individualized skincare and cosmetic routines allows firms to use technology to deliver specialized solutions that cater to individual needs.
  • Brands have chances to increase customer interaction and reach new audiences through ongoing developments in digital marketing, e-commerce, and virtual try-on experiences.
  • As consumers demand more ethical and ecologically sensitive products, there is an enormous possibility for firms to implement sustainable practices, such as eco-friendly packaging, responsible sourcing, and green technologies.
Threats
  • Numerous cosmetic and beauty products have short shelf life, which makes inventory management and waste reduction difficult, particularly for firms with broad product lines.
  • The industry's reliance on trends can be a weakness because products and companies that don't adapt to changing consumer tastes run the risk of becoming obsolete.
  • Consumers' increased understanding of the potential health dangers linked to specific cosmetic components may cause product boycotts and legislative reforms that restrict the range of products available.
  • Brands may experience difficulties establishing and sustaining trust as customers grow more discriminating and skeptical of claims made for beauty products, necessitating more openness and authenticity in advertising.

Category-wise Insights

Emphasis on Dry Skin by Brands Leads to Greater Revenue Shares

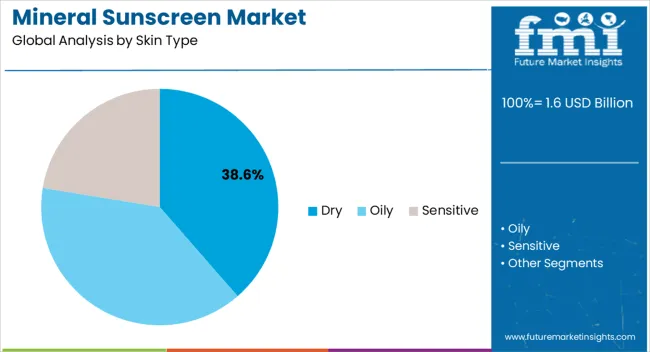
In 2023, the dry skin segment is leading by occupying nearly 26.99% share of the market by skin type.

Top Skin Type Dry
Market Share (2023) 26.99%

Numerous factors, including the climate (cold weather, low humidity), over-cleansing, the use of harsh skincare products, and underlying medical disorders, may lead to dry skin. A wide range of dry skin products are available due to the underlying causes' diversity. Individuals of different ages, genders, and skin tones can experience dry skin, making it a universal issue that crosses all demographic divisions. Brands frequently promote products designed especially for dry skin, highlighting their capacity to offer relief and enhance skin texture. Customers who have dry skin problems respond well to this customized marketing strategy.

Direct Sales Continue to be the Preferred Distribution Channel by Consumers

In 2023, the direct sales channel segment remains highly preferred, capturing 8.66% of the mineral sunscreen industry share. Though several beauty and skincare brands are adopting a hybrid approach by utilizing both direct and indirect sales channels, direct sales channel maintain their supremacy in the long run.

Top Sales Channel Direct Sales
Market Share (2023) 8.66%

Through direct sales channels, brands maintain more control over their merchandise, prices, and branding. This control may be necessary for luxury or niche brands that want to maintain their positioning and image. Direct communication with clients allows for building relationships and getting insightful feedback. This is especially advantageous for businesses that value client loyalty and wish to customize their goods and services to suit customer preferences. By making limited-edition products or special promotions available only through their own stores or websites, brands can evoke a feeling of exclusivity, fostering direct sales in the mineral sunscreen market.

Get the data you need at a Fraction of the cost

Personalize your report by choosing insights you need
and save 40%!

Country-wise Insights

The table provides a revenue share analysis of the major markets in the competitive landscape. China holds a significant share of the global mineral sunscreen market.

Countries Market Share (2023)
Canada 4.3%
Germany 4.4%
India 4.5%
China 6.1%
Australia 2%

Rise of Cosmetic Procedures Bolsters Growth Prospects in Canada

Canada’s mineral sunscreen market holds a market share of 4.3% in 2023 and is developing due to several factors. The market is largely expanding owing to skincare's integration with pharmaceutical and medical aesthetics procedures. For holistic results, consumers are combining non-invasive cosmetic procedures with skincare regimens.

The clean beauty movement in Canada has accelerated, following global trends. The desire for products free of potentially dangerous substances among consumers has fueled the expansion of clean and natural cosmetic brands, driving sales of mineral sunscreens. Indie beauty firms are growing in popularity in Canada, bringing new, specialized items to the market. These smaller companies frequently concentrate on original formulations and meet certain consumer demands.
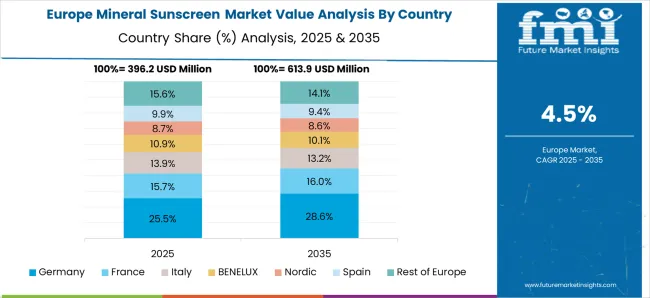
Increasing Shift Toward Outdoor Activities Strengthens Market Expansion in Germany

Germany’s mineral sunscreen market holds a 4.4% share of the global revenue in 2023. Many German consumers have delicate skin that is prone to irritability. Mineral sunscreens are renowned for being mild and hypoallergenic since they contain physical UV blockers like zinc oxide and titanium dioxide. Mineral sunscreens are now widely available and actively marketed as safe and reliable solutions for sun protection as a result of the strict regulations the European Union has placed on sunscreen compositions.

Outdoor pursuits, including motorcycling, hiking, and sports, are popular in Germany. This active way of life fuels the desire for trustworthy sunscreens that can endure perspiration and outdoor elements, thereby strengthening mineral sunscreen market expansion in the long run.

Natural and Non-Toxic Beauty Trends Amplify Products Sales in India

India’s mineral sunscreen market accounts for a share of 4.5% in 2023. Indian consumers are getting more conscious of the importance of sun protection due to growing knowledge about the damaging effects of UV radiation and pollution on skin health. Because they are so good at preventing skin damage, mineral sunscreens are in high demand.

India has a long history of using herbal and Ayurvedic remedies for skin care. Mineral sunscreens complement the trend for herbal and Ayurvedic treatments because they are frequently made with natural ingredients. Natural and non-toxic beauty products are in high demand in India's beauty sector. Mineral sunscreens fit this trend toward natural beauty.

Influence of K-Beauty and J-Beauty Drive Demand in China

China’s mineral sunscreen market holds a share of 6.1% of global sales in 2023. Fair skin with a healthy glow is highly regarded in China. Mineral sunscreens are favored because they can keep skin fair since they are frequently designed to protect without darkening skin.

Chinese consumers are becoming more interested in multi-step skincare regimens and clean beauty products, such as mineral sunscreens, thanks to the influence of Korean and Japanese beauty trends. China's wellness and health trends are driving the need for sunscreens that provide additional skin advantages beyond UV protection. Many nutritious and skin-improving elements can be found in mineral sunscreens, which drives their demand in the Chinese mineral sunscreen market.

Skin Cancer Concerns Driving Demand for Mineral Sunscreens in Australia

In 2023, Australia’s mineral sunscreen market accounted for a 2% share of the global market. Skin cancer prevention is an important safety priority because Australia has one of the most severe cases of skin cancer in the world.

Medical practitioners frequently suggest mineral sunscreens due to their demonstrated effectiveness against UV rays, which are the primary cause of skin cancer. It can get hot and humid in Australia.

Mineral sunscreens are preferred for their comfort in such circumstances because they frequently have a matte and non-greasy feel. When it comes to preventive health measures, Australians are proactive. In order to avoid UV damage and premature aging, mineral sunscreens are considered to be a crucial component of a preventive skincare regimen.
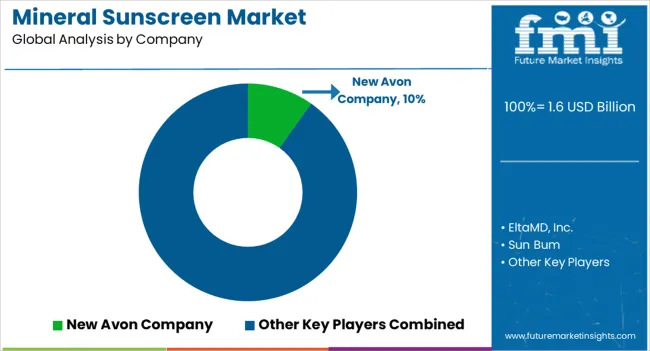
Competitive Landscape in the Mineral Sunscreen Market

The mineral sunscreen industry is extremely competitive with established competitors, up-and-coming independent brands, diversification efforts, innovation, branding strategies, sustainability initiatives, and a heavy emphasis on consumer education and compliance driving the market. The best-positioned brands in this cutthroat environment are those that adjust to changing consumer preferences and market conditions. By acquiring smaller niche companies, reputable skincare and beauty corporations are uniting the market. They are able to reach a wider audience and vary their product offerings due to these investments.

Recent Developments in the Mineral Sunscreen Market

  • In September 2023, BASF introduced the new sunscreen component TinomaxTM CC. The recently introduced TinomaxTM CC provides a significant sensory enhancement, which is intended for skin and sun care formulations and has a uniform particle shape. It comes in the form of an off-white powder and works by using light birefringence to increase UV protection with SPF and UVA.
  • D'FEND MINERAL SUNSCREEN was introduced in February 2022, by organic skincare company Azafran, based in Ahmedabad. The SPF 30 sunscreen from Azafran is kind, nutritious, and suitable for daily use. A sunscreen product that is safe for the skin, the environment, and the reefs, as it is COSMOS Natural certified by Ecocert Greenlife and devoid of harsh chemicals, parabens, and GMOs.

Key Players in the Mineral Sunscreen Market

  • Neutrogena
  • EltaMD Inc.
  • Sun Bum
  • Johnson & Johnson Consumer Inc.
  • La Roche-Posay
  • Avalon Natural Products Inc.
  • J&JCI
  • Australian Gold LLC
  • Edgewall
  • Goddess Garden
  • Coppertone
  • Drunk Elephant
  • BeautyCorner

Market Segmentation

By Skin Type:

  • Dry
  • Oily
  • Sensitive

Sun Protection Factor:

  • Up to 29 SPF
  • 30 SPF to 49 SPF
  • 50 SPF to 69 SPF
  • 70 SPF and more

By Consumer Orientation:

  • Male
  • Female
  • Unisex

By Nature:

  • Natural
  • Organic
  • Synthetic

Price Range:

  • Economy/Mid-Range
  • Premium

Age:

  • Adult
  • Children

Sales Channel:

  • Direct
  • Indirect
    • Supermarkets/Hypermarkets
    • Convenience Stores
    • Independent Small Stores
    • Discounted Stores
    • Online Sales Channel
    • Others

By Region:

  • North America
  • Latin America
  • Europe
  • South Asia
  • East Asia
  • Oceania
  • Middle East & Africa

Frequently Asked Questions

What Big is the Mineral Sunscreen Market in 2023?

The mineral sunscreen market valuation is US$ 1,470.3 million in 2023.

What is the Demand Outlook for the Mineral Sunscreen Market?

The market is projected to rise at a 5.2% CAGR through 2033.

How Big Will the Mineral Sunscreen Market be by 2033?

The market size will reach US$ 2,441.0 million by 2033.

Which is the Leading Sales Channel in the Market?

The Direct sales channel leads the mineral sunscreen market.

Which Country Holds a Significant Share of the Market?

China holds a major share of 6.1% of the global market.

Table of Content
1. Executive Summary
    1.1. Global Market Outlook
    1.2. Demand-side Trends
    1.3. Supply-side Trends
    1.4. Technology Roadmap Analysis
    1.5. Analysis and Recommendations
2. Market Overview
    2.1. Market Coverage / Taxonomy
    2.2. Market Definition / Scope / Limitations
3. Market Background
    3.1. Market Dynamics
        3.1.1. Drivers
        3.1.2. Restraints
        3.1.3. Opportunity
        3.1.4. Trends
    3.2. Scenario Forecast
        3.2.1. Demand in Optimistic Scenario
        3.2.2. Demand in Likely Scenario
        3.2.3. Demand in Conservative Scenario
    3.3. Opportunity Map Analysis
    3.4. Product Life Cycle Analysis
    3.5. Supply Chain Analysis
        3.5.1. Supply Side Participants and their Roles
            3.5.1.1. Producers
            3.5.1.2. Mid-Level Participants (Traders/ Agents/ Brokers)
            3.5.1.3. Wholesalers and Distributors
        3.5.2. Value Added and Value Created at Node in the Supply Chain
        3.5.3. List of Raw Material Suppliers
        3.5.4. List of Existing and Potential Buyer’s
    3.6. Investment Feasibility Matrix
    3.7. Value Chain Analysis
        3.7.1. Profit Margin Analysis
        3.7.2. Wholesalers and Distributors
        3.7.3. Retailers
    3.8. PESTLE and Porter’s Analysis
    3.9. Regulatory Landscape
        3.9.1. By Key Regions
        3.9.2. By Key Countries
    3.10. Regional Parent Market Outlook
    3.11. Production and Consumption Statistics
    3.12. Import and Export Statistics
4. Global Market Analysis 2018 to 2022 and Forecast, 2023 to 2033
    4.1. Historical Market Size Value (US$ Million) & Volume (Units) Analysis, 2018 to 2022
    4.2. Current and Future Market Size Value (US$ Million) & Volume (Units) Projections, 2023 to 2033
        4.2.1. Y-o-Y Growth Trend Analysis
        4.2.2. Absolute $ Opportunity Analysis
5. Global Market Analysis 2018 to 2022 and Forecast 2023 to 2033, By Skin Type
    5.1. Introduction / Key Findings
    5.2. Historical Market Size Value (US$ Million) & Volume (Units) Analysis By Skin Type, 2018 to 2022
    5.3. Current and Future Market Size Value (US$ Million) & Volume (Units) Analysis and Forecast By Skin Type, 2023 to 2033
        5.3.1. Dry
        5.3.2. Oily
        5.3.3. Sensitive
        5.3.4. Upright/Non-Portable garment steamer
    5.4. Y-o-Y Growth Trend Analysis By Skin Type, 2018 to 2022
    5.5. Absolute $ Opportunity Analysis By Skin Type, 2023 to 2033
6. Global Market Analysis 2018 to 2022 and Forecast 2023 to 2033, By Sun Protection Factor
    6.1. Introduction / Key Findings
    6.2. Historical Market Size Value (US$ Million) & Volume (Units) Analysis By Sun Protection Factor, 2018 to 2022
    6.3. Current and Future Market Size Value (US$ Million) & Volume (Units) Analysis and Forecast By Sun Protection Factor, 2023 to 2033
        6.3.1. Up to 29 SPF
        6.3.2. 30 SPF – 49 SPF
        6.3.3. 50 SPF – 69 SPF
        6.3.4. 70 SPF and more
    6.4. Y-o-Y Growth Trend Analysis By Sun Protection Factor, 2018 to 2022
    6.5. Absolute $ Opportunity Analysis By Sun Protection Factor, 2023 to 2033
7. Global Market Analysis 2018 to 2022 and Forecast 2023 to 2033, By Consumer Orientation
    7.1. Introduction / Key Findings
    7.2. Historical Market Size Value (US$ Million) & Volume (Units) Analysis By Consumer Orientation, 2018 to 2022
    7.3. Current and Future Market Size Value (US$ Million) & Volume (Units) Analysis and Forecast By Consumer Orientation, 2023 to 2033
        7.3.1. Male
        7.3.2. Female
        7.3.3. Unisex
    7.4. Y-o-Y Growth Trend Analysis By Consumer Orientation, 2018 to 2022
    7.5. Absolute $ Opportunity Analysis By Consumer Orientation, 2023 to 2033
8. Global Market Analysis 2018 to 2022 and Forecast 2023 to 2033, By Nature
    8.1. Introduction / Key Findings
    8.2. Historical Market Size Value (US$ Million) & Volume (Units) Analysis By Nature, 2018 to 2022
    8.3. Current and Future Market Size Value (US$ Million) & Volume (Units) Analysis and Forecast By Nature, 2023 to 2033
        8.3.1. Natural
        8.3.2. Organic
        8.3.3. Synthetic
    8.4. Y-o-Y Growth Trend Analysis By Nature, 2018 to 2022
    8.5. Absolute $ Opportunity Analysis By Nature, 2023 to 2033
9. Global Market Analysis 2018 to 2022 and Forecast 2023 to 2033, By Price Range
    9.1. Introduction / Key Findings
    9.2. Historical Market Size Value (US$ Million) & Volume (Units) Analysis By Price Range, 2018 to 2022
    9.3. Current and Future Market Size Value (US$ Million) & Volume (Units) Analysis and Forecast By Price Range, 2023 to 2033
        9.3.1. Economy/ Mid-Range
        9.3.2. Premium
    9.4. Y-o-Y Growth Trend Analysis By Price Range, 2018 to 2022
    9.5. Absolute $ Opportunity Analysis By Price Range, 2023 to 2033
10. Global Market Analysis 2018 to 2022 and Forecast 2023 to 2033, By Age
    10.1. Introduction / Key Findings
    10.2. Historical Market Size Value (US$ Million) & Volume (Units) Analysis By Age, 2018 to 2022
    10.3. Current and Future Market Size Value (US$ Million) & Volume (Units) Analysis and Forecast By Age, 2023 to 2033
        10.3.1. Adult
        10.3.2. Children
    10.4. Y-o-Y Growth Trend Analysis By Age, 2018 to 2022
    10.5. Absolute $ Opportunity Analysis By Age, 2023 to 2033
11. Global Market Analysis 2018 to 2022 and Forecast 2023 to 2033, By Sales Channel
    11.1. Introduction / Key Findings
    11.2. Historical Market Size Value (US$ Million) & Volume (Units) Analysis By Sales Channel, 2018 to 2022
    11.3. Current and Future Market Size Value (US$ Million) & Volume (Units) Analysis and Forecast By Sales Channel, 2023 to 2033
        11.3.1. Direct
        11.3.2. Indirect
            11.3.2.1. Supermarkets/Hypermarkets
            11.3.2.2. Convenience Stores
            11.3.2.3. Independent Small Stores
            11.3.2.4. Discounted Stores
            11.3.2.5. Online Sales Channel
            11.3.2.6. Others
    11.4. Y-o-Y Growth Trend Analysis By Sales Channel, 2018 to 2022
    11.5. Absolute $ Opportunity Analysis By Sales Channel, 2023 to 2033
12. Global Market Analysis 2018 to 2022 and Forecast 2023 to 2033, By Region
    12.1. Introduction
    12.2. Historical Market Size Value (US$ Million) & Volume (Units) Analysis By Region, 2018 to 2022
    12.3. Current Market Size Value (US$ Million) & Volume (Units) Analysis and Forecast By Region, 2023 to 2033
        12.3.1. North America
        12.3.2. Latin America
        12.3.3. Western Europe
        12.3.4. Eastern Europe
        12.3.5. South Asia and Pacific
        12.3.6. East Asia
        12.3.7. Middle East and Africa
    12.4. Market Attractiveness Analysis By Region
13. North America Market Analysis 2018 to 2022 and Forecast 2023 to 2033, By Country
    13.1. Historical Market Size Value (US$ Million) & Volume (Units) Trend Analysis By Market Taxonomy, 2018 to 2022
    13.2. Market Size Value (US$ Million) & Volume (Units) Forecast By Market Taxonomy, 2023 to 2033
        13.2.1. By Country
            13.2.1.1. U.S.
            13.2.1.2. Canada
        13.2.2. By Skin Type
        13.2.3. By Sun Protection Factor
        13.2.4. By Consumer Orientation
        13.2.5. By Nature
        13.2.6. By Price Range
        13.2.7. By Age
        13.2.8. By Sales Channel
    13.3. Market Attractiveness Analysis
        13.3.1. By Country
        13.3.2. By Skin Type
        13.3.3. By Sun Protection Factor
        13.3.4. By Consumer Orientation
        13.3.5. By Nature
        13.3.6. By Price Range
        13.3.7. By Age
        13.3.8. By Sales Channel
    13.4. Key Takeaways
14. Latin America Market Analysis 2018 to 2022 and Forecast 2023 to 2033, By Country
    14.1. Historical Market Size Value (US$ Million) & Volume (Units) Trend Analysis By Market Taxonomy, 2018 to 2022
    14.2. Market Size Value (US$ Million) & Volume (Units) Forecast By Market Taxonomy, 2023 to 2033
        14.2.1. By Country
            14.2.1.1. Brazil
            14.2.1.2. Mexico
            14.2.1.3. Rest of Latin America
        14.2.2. By Skin Type
        14.2.3. By Sun Protection Factor
        14.2.4. By Consumer Orientation
        14.2.5. By Nature
        14.2.6. By Price Range
        14.2.7. By Age
        14.2.8. By Sales Channel
    14.3. Market Attractiveness Analysis
        14.3.1. By Country
        14.3.2. By Skin Type
        14.3.3. By Sun Protection Factor
        14.3.4. By Consumer Orientation
        14.3.5. By Nature
        14.3.6. By Price Range
        14.3.7. By Age
        14.3.8. By Sales Channel
    14.4. Key Takeaways
15. Western Europe Market Analysis 2018 to 2022 and Forecast 2023 to 2033, By Country
    15.1. Historical Market Size Value (US$ Million) & Volume (Units) Trend Analysis By Market Taxonomy, 2018 to 2022
    15.2. Market Size Value (US$ Million) & Volume (Units) Forecast By Market Taxonomy, 2023 to 2033
        15.2.1. By Country
            15.2.1.1. Germany
            15.2.1.2. U.K.
            15.2.1.3. France
            15.2.1.4. Spain
            15.2.1.5. Italy
            15.2.1.6. Rest of Western Europe
        15.2.2. By Skin Type
        15.2.3. By Sun Protection Factor
        15.2.4. By Consumer Orientation
        15.2.5. By Nature
        15.2.6. By Price Range
        15.2.7. By Age
        15.2.8. By Sales Channel
    15.3. Market Attractiveness Analysis
        15.3.1. By Country
        15.3.2. By Skin Type
        15.3.3. By Sun Protection Factor
        15.3.4. By Consumer Orientation
        15.3.5. By Nature
        15.3.6. By Price Range
        15.3.7. By Age
        15.3.8. By Sales Channel
    15.4. Key Takeaways
16. Eastern Europe Market Analysis 2018 to 2022 and Forecast 2023 to 2033, By Country
    16.1. Historical Market Size Value (US$ Million) & Volume (Units) Trend Analysis By Market Taxonomy, 2018 to 2022
    16.2. Market Size Value (US$ Million) & Volume (Units) Forecast By Market Taxonomy, 2023 to 2033
        16.2.1. By Country
            16.2.1.1. Poland
            16.2.1.2. Russia
            16.2.1.3. Czech Republic
            16.2.1.4. Romania
            16.2.1.5. Rest of Eastern Europe
        16.2.2. By Skin Type
        16.2.3. By Sun Protection Factor
        16.2.4. By Consumer Orientation
        16.2.5. By Nature
        16.2.6. By Price Range
        16.2.7. By Age
        16.2.8. By Sales Channel
    16.3. Market Attractiveness Analysis
        16.3.1. By Country
        16.3.2. By Skin Type
        16.3.3. By Sun Protection Factor
        16.3.4. By Consumer Orientation
        16.3.5. By Nature
        16.3.6. By Price Range
        16.3.7. By Age
        16.3.8. By Sales Channel
    16.4. Key Takeaways
17. South Asia and Pacific Market Analysis 2018 to 2022 and Forecast 2023 to 2033, By Country
    17.1. Historical Market Size Value (US$ Million) & Volume (Units) Trend Analysis By Market Taxonomy, 2018 to 2022
    17.2. Market Size Value (US$ Million) & Volume (Units) Forecast By Market Taxonomy, 2023 to 2033
        17.2.1. By Country
            17.2.1.1. India
            17.2.1.2. Bangladesh
            17.2.1.3. Australia
            17.2.1.4. New Zealand
            17.2.1.5. Rest of South Asia and Pacific
        17.2.2. By Skin Type
        17.2.3. By Sun Protection Factor
        17.2.4. By Consumer Orientation
        17.2.5. By Nature
        17.2.6. By Price Range
        17.2.7. By Age
        17.2.8. By Sales Channel
    17.3. Market Attractiveness Analysis
        17.3.1. By Country
        17.3.2. By Skin Type
        17.3.3. By Sun Protection Factor
        17.3.4. By Consumer Orientation
        17.3.5. By Nature
        17.3.6. By Price Range
        17.3.7. By Age
        17.3.8. By Sales Channel
    17.4. Key Takeaways
18. East Asia Market Analysis 2018 to 2022 and Forecast 2023 to 2033, By Country
    18.1. Historical Market Size Value (US$ Million) & Volume (Units) Trend Analysis By Market Taxonomy, 2018 to 2022
    18.2. Market Size Value (US$ Million) & Volume (Units) Forecast By Market Taxonomy, 2023 to 2033
        18.2.1. By Country
            18.2.1.1. China
            18.2.1.2. Japan
            18.2.1.3. South Korea
        18.2.2. By Skin Type
        18.2.3. By Sun Protection Factor
        18.2.4. By Consumer Orientation
        18.2.5. By Nature
        18.2.6. By Price Range
        18.2.7. By Age
        18.2.8. By Sales Channel
    18.3. Market Attractiveness Analysis
        18.3.1. By Country
        18.3.2. By Skin Type
        18.3.3. By Sun Protection Factor
        18.3.4. By Consumer Orientation
        18.3.5. By Nature
        18.3.6. By Price Range
        18.3.7. By Age
        18.3.8. By Sales Channel
    18.4. Key Takeaways
19. Middle East and Africa Market Analysis 2018 to 2022 and Forecast 2023 to 2033, By Country
    19.1. Historical Market Size Value (US$ Million) & Volume (Units) Trend Analysis By Market Taxonomy, 2018 to 2022
    19.2. Market Size Value (US$ Million) & Volume (Units) Forecast By Market Taxonomy, 2023 to 2033
        19.2.1. By Country
            19.2.1.1. GCC Countries
            19.2.1.2. South Africa
            19.2.1.3. Israel
            19.2.1.4. Rest of MEA
        19.2.2. By Skin Type
        19.2.3. By Sun Protection Factor
        19.2.4. By Consumer Orientation
        19.2.5. By Nature
        19.2.6. By Price Range
        19.2.7. By Age
        19.2.8. By Sales Channel
    19.3. Market Attractiveness Analysis
        19.3.1. By Country
        19.3.2. By Skin Type
        19.3.3. By Sun Protection Factor
        19.3.4. By Consumer Orientation
        19.3.5. By Nature
        19.3.6. By Price Range
        19.3.7. By Age
        19.3.8. By Sales Channel
    19.4. Key Takeaways
20. Key Countries Market Analysis
    20.1. U.S.
        20.1.1. Pricing Analysis
        20.1.2. Market Share Analysis, 2022
            20.1.2.1. By Skin Type
            20.1.2.2. By Sun Protection Factor
            20.1.2.3. By Consumer Orientation
            20.1.2.4. By Nature
            20.1.2.5. By Price Range
            20.1.2.6. By Age
            20.1.2.7. By Sales Channel
    20.2. Canada
        20.2.1. Pricing Analysis
        20.2.2. Market Share Analysis, 2022
            20.2.2.1. By Skin Type
            20.2.2.2. By Sun Protection Factor
            20.2.2.3. By Consumer Orientation
            20.2.2.4. By Nature
            20.2.2.5. By Price Range
            20.2.2.6. By Age
            20.2.2.7. By Sales Channel
    20.3. Brazil
        20.3.1. Pricing Analysis
        20.3.2. Market Share Analysis, 2022
            20.3.2.1. By Skin Type
            20.3.2.2. By Sun Protection Factor
            20.3.2.3. By Consumer Orientation
            20.3.2.4. By Nature
            20.3.2.5. By Price Range
            20.3.2.6. By Age
            20.3.2.7. By Sales Channel
    20.4. Mexico
        20.4.1. Pricing Analysis
        20.4.2. Market Share Analysis, 2022
            20.4.2.1. By Skin Type
            20.4.2.2. By Sun Protection Factor
            20.4.2.3. By Consumer Orientation
            20.4.2.4. By Nature
            20.4.2.5. By Price Range
            20.4.2.6. By Age
            20.4.2.7. By Sales Channel
    20.5. Germany
        20.5.1. Pricing Analysis
        20.5.2. Market Share Analysis, 2022
            20.5.2.1. By Skin Type
            20.5.2.2. By Sun Protection Factor
            20.5.2.3. By Consumer Orientation
            20.5.2.4. By Nature
            20.5.2.5. By Price Range
            20.5.2.6. By Age
            20.5.2.7. By Sales Channel
    20.6. U.K.
        20.6.1. Pricing Analysis
        20.6.2. Market Share Analysis, 2022
            20.6.2.1. By Skin Type
            20.6.2.2. By Sun Protection Factor
            20.6.2.3. By Consumer Orientation
            20.6.2.4. By Nature
            20.6.2.5. By Price Range
            20.6.2.6. By Age
            20.6.2.7. By Sales Channel
    20.7. France
        20.7.1. Pricing Analysis
        20.7.2. Market Share Analysis, 2022
            20.7.2.1. By Skin Type
            20.7.2.2. By Sun Protection Factor
            20.7.2.3. By Consumer Orientation
            20.7.2.4. By Nature
            20.7.2.5. By Price Range
            20.7.2.6. By Age
            20.7.2.7. By Sales Channel
    20.8. Spain
        20.8.1. Pricing Analysis
        20.8.2. Market Share Analysis, 2022
            20.8.2.1. By Skin Type
            20.8.2.2. By Sun Protection Factor
            20.8.2.3. By Consumer Orientation
            20.8.2.4. By Nature
            20.8.2.5. By Price Range
            20.8.2.6. By Age
            20.8.2.7. By Sales Channel
    20.9. Italy
        20.9.1. Pricing Analysis
        20.9.2. Market Share Analysis, 2022
            20.9.2.1. By Skin Type
            20.9.2.2. By Sun Protection Factor
            20.9.2.3. By Consumer Orientation
            20.9.2.4. By Nature
            20.9.2.5. By Price Range
            20.9.2.6. By Age
            20.9.2.7. By Sales Channel
    20.10. Poland
        20.10.1. Pricing Analysis
        20.10.2. Market Share Analysis, 2022
            20.10.2.1. By Skin Type
            20.10.2.2. By Sun Protection Factor
            20.10.2.3. By Consumer Orientation
            20.10.2.4. By Nature
            20.10.2.5. By Price Range
            20.10.2.6. By Age
            20.10.2.7. By Sales Channel
    20.11. Russia
        20.11.1. Pricing Analysis
        20.11.2. Market Share Analysis, 2022
            20.11.2.1. By Skin Type
            20.11.2.2. By Sun Protection Factor
            20.11.2.3. By Consumer Orientation
            20.11.2.4. By Nature
            20.11.2.5. By Price Range
            20.11.2.6. By Age
            20.11.2.7. By Sales Channel
    20.12. Czech Republic
        20.12.1. Pricing Analysis
        20.12.2. Market Share Analysis, 2022
            20.12.2.1. By Skin Type
            20.12.2.2. By Sun Protection Factor
            20.12.2.3. By Consumer Orientation
            20.12.2.4. By Nature
            20.12.2.5. By Price Range
            20.12.2.6. By Age
            20.12.2.7. By Sales Channel
    20.13. Romania
        20.13.1. Pricing Analysis
        20.13.2. Market Share Analysis, 2022
            20.13.2.1. By Skin Type
            20.13.2.2. By Sun Protection Factor
            20.13.2.3. By Consumer Orientation
            20.13.2.4. By Nature
            20.13.2.5. By Price Range
            20.13.2.6. By Age
            20.13.2.7. By Sales Channel
    20.14. India
        20.14.1. Pricing Analysis
        20.14.2. Market Share Analysis, 2022
            20.14.2.1. By Skin Type
            20.14.2.2. By Sun Protection Factor
            20.14.2.3. By Consumer Orientation
            20.14.2.4. By Nature
            20.14.2.5. By Price Range
            20.14.2.6. By Age
            20.14.2.7. By Sales Channel
    20.15. Bangladesh
        20.15.1. Pricing Analysis
        20.15.2. Market Share Analysis, 2022
            20.15.2.1. By Skin Type
            20.15.2.2. By Sun Protection Factor
            20.15.2.3. By Consumer Orientation
            20.15.2.4. By Nature
            20.15.2.5. By Price Range
            20.15.2.6. By Age
            20.15.2.7. By Sales Channel
    20.16. Australia
        20.16.1. Pricing Analysis
        20.16.2. Market Share Analysis, 2022
            20.16.2.1. By Skin Type
            20.16.2.2. By Sun Protection Factor
            20.16.2.3. By Consumer Orientation
            20.16.2.4. By Nature
            20.16.2.5. By Price Range
            20.16.2.6. By Age
            20.16.2.7. By Sales Channel
    20.17. New Zealand
        20.17.1. Pricing Analysis
        20.17.2. Market Share Analysis, 2022
            20.17.2.1. By Skin Type
            20.17.2.2. By Sun Protection Factor
            20.17.2.3. By Consumer Orientation
            20.17.2.4. By Nature
            20.17.2.5. By Price Range
            20.17.2.6. By Age
            20.17.2.7. By Sales Channel
    20.18. China
        20.18.1. Pricing Analysis
        20.18.2. Market Share Analysis, 2022
            20.18.2.1. By Skin Type
            20.18.2.2. By Sun Protection Factor
            20.18.2.3. By Consumer Orientation
            20.18.2.4. By Nature
            20.18.2.5. By Price Range
            20.18.2.6. By Age
            20.18.2.7. By Sales Channel
    20.19. Japan
        20.19.1. Pricing Analysis
        20.19.2. Market Share Analysis, 2022
            20.19.2.1. By Skin Type
            20.19.2.2. By Sun Protection Factor
            20.19.2.3. By Consumer Orientation
            20.19.2.4. By Nature
            20.19.2.5. By Price Range
            20.19.2.6. By Age
            20.19.2.7. By Sales Channel
    20.20. South Korea
        20.20.1. Pricing Analysis
        20.20.2. Market Share Analysis, 2022
            20.20.2.1. By Skin Type
            20.20.2.2. By Sun Protection Factor
            20.20.2.3. By Consumer Orientation
            20.20.2.4. By Nature
            20.20.2.5. By Price Range
            20.20.2.6. By Age
            20.20.2.7. By Sales Channel
    20.21. GCC Countries
        20.21.1. Pricing Analysis
        20.21.2. Market Share Analysis, 2022
            20.21.2.1. By Skin Type
            20.21.2.2. By Sun Protection Factor
            20.21.2.3. By Consumer Orientation
            20.21.2.4. By Nature
            20.21.2.5. By Price Range
            20.21.2.6. By Age
            20.21.2.7. By Sales Channel
    20.22. South Africa
        20.22.1. Pricing Analysis
        20.22.2. Market Share Analysis, 2022
            20.22.2.1. By Skin Type
            20.22.2.2. By Sun Protection Factor
            20.22.2.3. By Consumer Orientation
            20.22.2.4. By Nature
            20.22.2.5. By Price Range
            20.22.2.6. By Age
            20.22.2.7. By Sales Channel
    20.23. Israel
        20.23.1. Pricing Analysis
        20.23.2. Market Share Analysis, 2022
            20.23.2.1. By Skin Type
            20.23.2.2. By Sun Protection Factor
            20.23.2.3. By Consumer Orientation
            20.23.2.4. By Nature
            20.23.2.5. By Price Range
            20.23.2.6. By Age
            20.23.2.7. By Sales Channel
21. Market Structure Analysis
    21.1. Competition Dashboard
    21.2. Competition Benchmarking
    21.3. Market Share Analysis of Top Players
        21.3.1. By Regional
        21.3.2. By Skin Type
        21.3.3. By Sun Protection Factor
        21.3.4. By Consumer Orientation
        21.3.5. By Nature
        21.3.6. By Price Range
        21.3.7. By Age
        21.3.8. By Sales Channel
22. Competition Analysis
    22.1. Competition Deep Dive
        22.1.1. New Avon Company
            22.1.1.1. Overview
            22.1.1.2. Product Portfolio
            22.1.1.3. Profitability by Market Segments
            22.1.1.4. Sales Footprint
            22.1.1.5. Strategy Overview
                22.1.1.5.1. Marketing Strategy
                22.1.1.5.2. Product Strategy
                22.1.1.5.3. Channel Strategy
        22.1.2. EltaMD, Inc.
            22.1.2.1. Overview
            22.1.2.2. Product Portfolio
            22.1.2.3. Profitability by Market Segments
            22.1.2.4. Sales Footprint
            22.1.2.5. Strategy Overview
                22.1.2.5.1. Marketing Strategy
                22.1.2.5.2. Product Strategy
                22.1.2.5.3. Channel Strategy
        22.1.3. Sun Bum
            22.1.3.1. Overview
            22.1.3.2. Product Portfolio
            22.1.3.3. Profitability by Market Segments
            22.1.3.4. Sales Footprint
            22.1.3.5. Strategy Overview
                22.1.3.5.1. Marketing Strategy
                22.1.3.5.2. Product Strategy
                22.1.3.5.3. Channel Strategy
        22.1.4. Johnson & Johnson Consumer Inc.
            22.1.4.1. Overview
            22.1.4.2. Product Portfolio
            22.1.4.3. Profitability by Market Segments
            22.1.4.4. Sales Footprint
            22.1.4.5. Strategy Overview
                22.1.4.5.1. Marketing Strategy
                22.1.4.5.2. Product Strategy
                22.1.4.5.3. Channel Strategy
        22.1.5. La Roche-Posay
            22.1.5.1. Overview
            22.1.5.2. Product Portfolio
            22.1.5.3. Profitability by Market Segments
            22.1.5.4. Sales Footprint
            22.1.5.5. Strategy Overview
                22.1.5.5.1. Marketing Strategy
                22.1.5.5.2. Product Strategy
                22.1.5.5.3. Channel Strategy
        22.1.6. Avalon Natural Products, Inc.
            22.1.6.1. Overview
            22.1.6.2. Product Portfolio
            22.1.6.3. Profitability by Market Segments
            22.1.6.4. Sales Footprint
            22.1.6.5. Strategy Overview
                22.1.6.5.1. Marketing Strategy
                22.1.6.5.2. Product Strategy
                22.1.6.5.3. Channel Strategy
        22.1.7. J&JCI
            22.1.7.1. Overview
            22.1.7.2. Product Portfolio
            22.1.7.3. Profitability by Market Segments
            22.1.7.4. Sales Footprint
            22.1.7.5. Strategy Overview
                22.1.7.5.1. Marketing Strategy
                22.1.7.5.2. Product Strategy
                22.1.7.5.3. Channel Strategy
        22.1.8. Australian Gold LLC
            22.1.8.1. Overview
            22.1.8.2. Product Portfolio
            22.1.8.3. Profitability by Market Segments
            22.1.8.4. Sales Footprint
            22.1.8.5. Strategy Overview
                22.1.8.5.1. Marketing Strategy
                22.1.8.5.2. Product Strategy
                22.1.8.5.3. Channel Strategy
        22.1.9. Edgewell
            22.1.9.1. Overview
            22.1.9.2. Product Portfolio
            22.1.9.3. Profitability by Market Segments
            22.1.9.4. Sales Footprint
            22.1.9.5. Strategy Overview
                22.1.9.5.1. Marketing Strategy
                22.1.9.5.2. Product Strategy
                22.1.9.5.3. Channel Strategy
        22.1.10. Goddess Garden
            22.1.10.1. Overview
            22.1.10.2. Product Portfolio
            22.1.10.3. Profitability by Market Segments
            22.1.10.4. Sales Footprint
            22.1.10.5. Strategy Overview
                22.1.10.5.1. Marketing Strategy
                22.1.10.5.2. Product Strategy
                22.1.10.5.3. Channel Strategy
        22.1.11. Coppertone
            22.1.11.1. Overview
            22.1.11.2. Product Portfolio
            22.1.11.3. Profitability by Market Segments
            22.1.11.4. Sales Footprint
            22.1.11.5. Strategy Overview
                22.1.11.5.1. Marketing Strategy
                22.1.11.5.2. Product Strategy
                22.1.11.5.3. Channel Strategy
        22.1.12. Neutrogena
            22.1.12.1. Overview
            22.1.12.2. Product Portfolio
            22.1.12.3. Profitability by Market Segments
            22.1.12.4. Sales Footprint
            22.1.12.5. Strategy Overview
                22.1.12.5.1. Marketing Strategy
                22.1.12.5.2. Product Strategy
                22.1.12.5.3. Channel Strategy
        22.1.13. Drunk Elephant
            22.1.13.1. Overview
            22.1.13.2. Product Portfolio
            22.1.13.3. Profitability by Market Segments
            22.1.13.4. Sales Footprint
            22.1.13.5. Strategy Overview
                22.1.13.5.1. Marketing Strategy
                22.1.13.5.2. Product Strategy
                22.1.13.5.3. Channel Strategy
        22.1.14. BeautyCounter
            22.1.14.1. Overview
            22.1.14.2. Product Portfolio
            22.1.14.3. Profitability by Market Segments
            22.1.14.4. Sales Footprint
            22.1.14.5. Strategy Overview
                22.1.14.5.1. Marketing Strategy
                22.1.14.5.2. Product Strategy
                22.1.14.5.3. Channel Strategy
23. Assumptions & Acronyms Used
24. Research Methodology
Recommendations

Consumer Product

Sun Care Products Market

February 2023

REP-GB-12532

345 pages

Consumer Product

Tinted Sunscreen Market

April 2022

REP-GB-10169

250 pages

Explore Consumer Product Insights

View Reports
Future Market Insights

Mineral Sunscreen Market

Schedule a Call