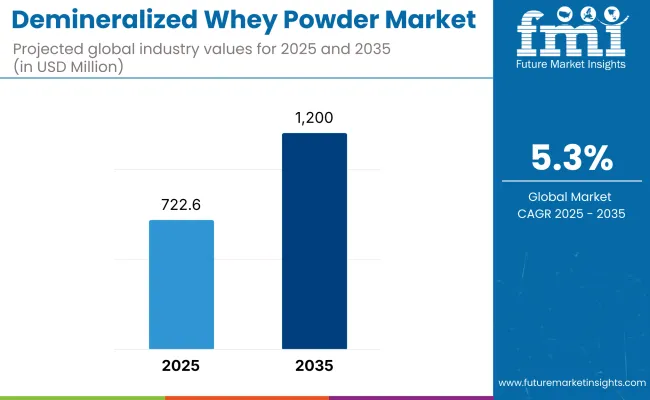
The global demineralized whey powder market is currently valued at around USD 722.6 million and is anticipated to progress at a CAGR of 5.3% to reach USD 1,200 million By 2035.
| Attributes | Description |
|---|---|
| Industry Size (2025E) | USD 722.6 million |
| Industry Value (2035F) | USD 1,200 million |
| CAGR (2025 to 2035) | 5.3% |
Demand continues to grow steadily due to the ingredient’s functional advantages in infant formula, dietary supplements, and bakery products. Demineralized whey powder is favored for its reduced mineral content, making it suitable for nutritionally sensitive applications. In the infant nutrition segment, it serves as a partial lactose and protein source with a mineral composition closely aligned with human milk, thereby enhancing its digestibility and suitability for newborn formulations.
Product innovation has remained strong in the 40%-90% demineralization range, as this concentration balances cost, nutritional functionality, and processing efficiency. Leading food manufacturers are leveraging this ingredient to cater to evolving preferences for clean-label, low-sodium formulations. Its natural origin and regulatory approval across major markets have positioned demineralized whey powder as a sustainable alternative to synthetic nutrient blends in sensitive applications.
Europe remains the dominant production and consumption region, supported by a well-integrated dairy industry, advanced processing capabilities, and export-driven strategies. North America and Asia Pacific are also experiencing increased adoption due to rising urbanization, dietary diversification, and the expansion of infant formula and sports nutrition categories. Favorable government regulations and food safety standards have further catalyzed the inclusion of demineralized whey in export-oriented product lines.
From a technological standpoint, membrane filtration, ion exchange, and electrodialysis continue to drive process enhancements, helping manufacturers optimize demineralization grades and nutritional consistency.
Cost dynamics are influenced by raw milk pricing, global dairy trade flows, and processing energy requirements. Companies with vertically integrated supply chains and strong control over milk sourcing are better positioned to offer stable pricing and consistent quality.
Going forward, the market is expected to benefit from growing health-consciousness among consumers, rising birth rates in developing countries, and strategic alliances between dairy processors and global infant formula brands. The ability to meet strict compositional standards while offering functionality across food systems will be critical in sustaining long-term growth and competitiveness.
The below table presents a comparative assessment of the variation in CAGR over six months for the base year (2024) and the current year (2025) for the global demineralized whey powder ingredient industry.
This analysis highlights key shifts in industry performance and indicates revenue realization patterns, providing stakeholders with a clearer view of the industry growth trajectory over the year. The first half of the year, or H1, spans from January to June, while the second half, H2, includes the months from July to December.
| Particular | Value CAGR |
|---|---|
| H1 2024 | 4.8% (2024 to 2034) |
| H2 2024 | 5.1% (2024 to 2034) |
| H1 2025 | 5.2% (2025 to 2035) |
| H2 2025 | 5.5% (2025 to 2035) |
The above table presents the expected CAGR for the global demineralized whey powder ingredient demand space over a semi-annual period spanning from 2025 to 2035. In the first half (H1) of the year 2024, the business is projected to grow at a CAGR of 4.8%, followed by a slight increase to 5.1% in the second half (H2) of the same year. Moving into 2025, the CAGR is expected to rise to 5.2% in H1 and maintain a steady increase to 5.5% in H2.
In the first half (H1 2025), the industry witnessed an increase of 4 BPS, while in the second half (H2 2025), the industry observed a rise of 4 BPS, indicating a consistent upward trend. These variations suggest strong industry momentum, driven by advancements in dairy protein extraction technologies, increasing demand for high-purity whey ingredients, and regulatory support for sustainable dairy processing innovations across key global markets.
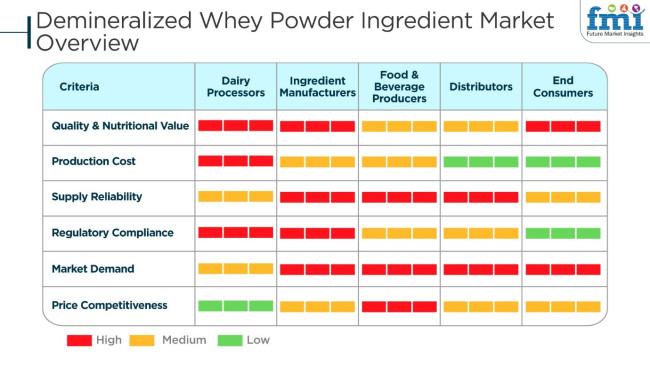
The industry of demineralized whey powder ingredient is having positive growing demand because of functional benefits in infant formula, dairy foods, sports nutrition, and bakery applications. Dairy processors emphasize high-quality raw materials and streamlined production to ensure purity and nutritional quality. Ingredient makers emphasize levels of demineralization, protein content, and regulatory compliance to ensure compatibility for infant nutrition and specialty diet products.
Food and beverage manufacturers prioritize consistency, solubility, and economy, rendering whey powder a key component of dairy, confectionery, and protein-fortified products. Distributors are central to supply chain management in international supply chains, facilitating continuous supply to manufacturers at guaranteed quality and competitive prices.
Final consumers increasingly prefer high-protein, lactose-free, and clean-label nutrition, necessitating the demand for demineralized whey powder in fortified and functional food applications. The industry is anticipated to expand with increasing use of nutritional and infant formula solutions across the world.
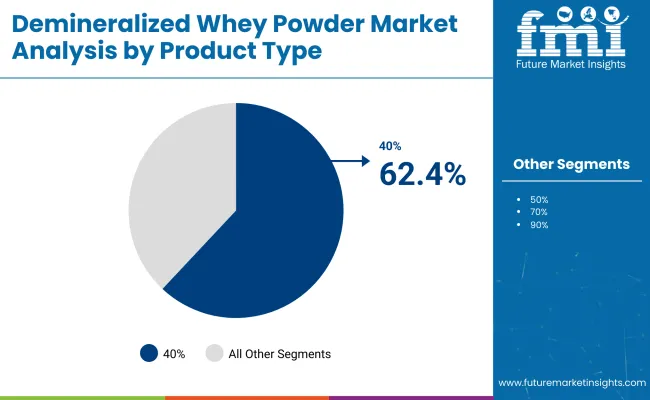
The 40%-90% demineralized whey powder segment is projected to maintain a dominant share of 62.4% in 2025, growing at a steady CAGR of 5.5% through 2035. Its strong position in the market has been driven by widespread demand in infant nutrition and functional food categories, where mineral balance and digestibility are critical.
This segment has emerged as a cornerstone ingredient due to its ability to mimic the mineral profile of breast milk while offering an excellent amino acid spectrum and lactose content. Its role in ensuring nutritional compliance and bioavailability in infant formula is well-recognized by regulatory and clinical standards.
Manufacturers continue to prioritize this grade range owing to its cost-effectiveness and versatility in processed food matrices. As clean-label and health-forward trends accelerate, the appeal of naturally derived, minimally modified dairy ingredients is expected to intensify.
The segment’s scalability and compatibility with multiple production technologies-particularly ion exchange and nanofiltration-have allowed for standardized quality across global supply chains. With rising investments in pediatric and senior nutrition globally, demand is poised to remain resilient. As premiumization trends take hold across both developed and emerging markets, this segment will likely remain the default formulation choice for safety, quality, and functionality in precision nutrition.
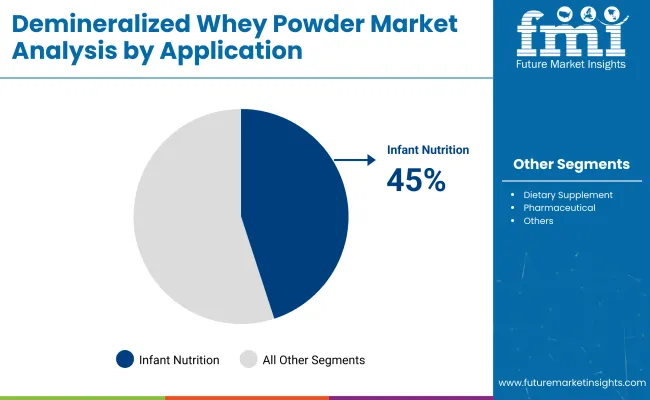
The infant nutrition segment is anticipated to hold over 45% of the total demineralized whey powder market value by 2025, advancing at a CAGR of nearly 6.1% over the forecast period. This stronghold reflects the ingredient’s centrality in developing safe, bioavailable, and regulatory-compliant formulations for early life nutrition.
Demineralized whey powder’s reduced mineral load aligns with pediatric health protocols, particularly for infants with specific dietary requirements or intolerances. This makes it a preferred dairy base over standard whey derivatives in commercial infant formula. Backed by extensive clinical validation and long-term safety profiles, its application has grown not only in standard formulations but also in specialty categories addressing allergy, colic, or preterm nutritional needs.
Globally, birth rate stabilization in developed regions is being offset by rising middle-class population and healthcare access in emerging economies, where premium infant formulas are increasingly adopted. Regulatory agencies have reinforced its acceptance through harmonized standards and safety evaluations, further strengthening its credibility in pharmaceutical-grade food categories.
Long-term demand is expected to be shaped by innovation in prebiotic and protein-enhanced blends, in which demineralized whey serves as a stable carrier. Its functionality, safety, and digestibility position it as a critical building block for high-value, science-driven infant nutrition products.
Demineralized whey powder ingredient marketing has so many risks, and they include raw material availability, regulatory compliance, supply chain disruptions, price volatility, and industry competition.
Raw material availability is a big issue as demineralized whey powder comes from cheese and dairy production. The availability of whey and processing efficiency can be influenced by variations in milk supply, seasonal changes, and livestock health. Furthermore, climate change and feed costs are affecting dairy production, which in turn affects whey output.
Regulatory compliance is tough to deal with, especially in areas like infant nutrition, pharmaceuticals, and functional food. Organizations such as FDA (USA), EFSA (Europe), and Codex Alimentarius are the ones who set the rules for food. The organizations specify a very strict guideline for purity, dematerialization levels (40%, 70%, or 90%), and safety from microbiological organisms.
If a manufacturer does not meet these requirements, they might have to deal with product recalls, lawsuits, or export restrictions.
Price volatility is a major worry, as a result of variation in dairy prices, processing costs, and energy use. The increased demand for infant formula and sports nutrition can lead to price surges which will affect the end users' affordability.
The industry competition is very fierce because big dairy ingredient suppliers are contending across the board with regard to quality, innovation, and pricing. The companies that provide ultra-filtration (advanced filtration) and are engaged in sustainable sourcing of raw materials are thus capable of staying ahead of the pack. But, plant-based protein powders acting as alternatives for whey products are the only thing these companies have to deal with in this situation.
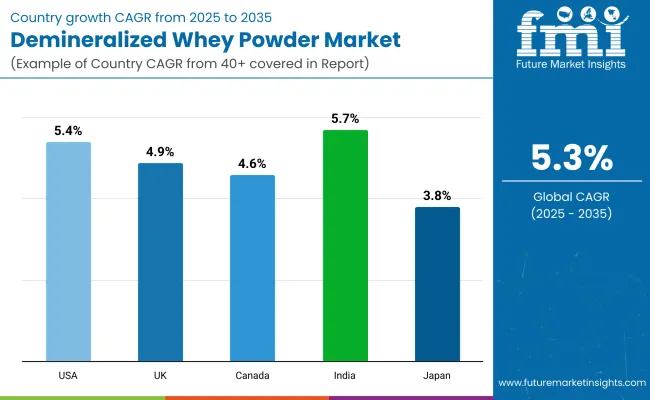
| Country | CAGR (%) (2025 to 2035) |
|---|---|
| USA | 5.4% |
| UK | 4.9% |
| Canada | 4.6% |
| India | 5.7% |
| Japan | 3.8% |
The USA is a top industry for demineralized whey powder ingredients, particularly functional and clinical nutrition. Clinical applications of whey are gaining traction, with doctors prescribing bioactive whey protein for recovery from surgery, metabolic disorder treatment, and geriatric nutrition. Consumers are seeking personalized protein products specifically designed to address individual disease states.
Neuroprotective whey technology is a topmost trend in the USA It encompasses study on whey-derived peptides that are advantageous to cognitive function, particularly among geriatric populations. Cross-sector alliances between dairy and biotech businesses have infused protein purification technology innovations that ensure whey proteins with augmented bioavailability and targeted health impacts.
FMI believes that the USA industry is set to grow at 5.4% CAGR during the research period.
Growth Factors in the USA
| Key Drivers | Details |
|---|---|
| Medical Nutrition Demand | Whey bioactive proteins assist with recovery and nutrition in aging. |
| Neuroprotective Applications | Scientific research of whey peptides for mental disorders. |
| Protein Purification Advances | High-purity protein solutions improve functional applications. |
| Personalized Nutrition Trends | Completely customized formulations target individual nutritional needs. |
The UK industry is expanding with greater demand for hybrid protein foods. Food manufacturers are incorporating demineralized whey powder in plant protein food to create environmentally friendly dairy alternatives. As consumers increasingly turn flexitarian and vegan, hybrid protein beverages, meal substitutes, and non-dairy yogurts are gaining ground.
Low-carbon precision fermentation technologies are revolutionizing the sector with low-carbon and sustainable whey proteins. Startups are emphasizing low environmental impact with equivalent nutritional value. Rising consumer demand for high-protein and sustainable diets is propelling the UK to become a prime industry for new dairy products.
FMI opines that the UK industry will grow at 4.9% CAGR during the study period.
Growth Factors in the UK
| Key Drivers | Details |
|---|---|
| Hybrid Protein Production | Combining plant and dairy proteins elevates nutritional value. |
| Flexitarian and Vegan Market Demand | Customers seek sustainable protein. |
| Precision Fermentation | Technology reduces the carbon footprint of whey protein. |
| Functional Dairy Free | Dairy-free high-protein product sales rise, propelling industry growth. |
Canada is witnessing increased demand for whey proteins based on gut health. Probiotic beverages based on dairy, digestive supplements, and enzyme-enriched sports supplements complement demineralized whey powder with functional foods. Clients like their proteins to be gut-friendly. Therefore, they are investing in bioactive peptides to manage the gut-brain axis.
Health Canada regulatory guidance propels clinical research on whey protein's impact on gut health. The industry is witnessing the introduction of second-generation protein foods for microbiome and improved nutrient absorption. FMI opines that the Canadian industry will grow at 4.6% CAGR during this study.
Growth Factors in Canada
| Key Drivers | Details |
|---|---|
| Gut-Health Innovation | Whey proteins enhance microbiome efficiency and digestion. |
| Functional Food Growth | Probiotic-enriched dairy beverages have become the consumer choice. |
| Enzyme-Fortified Sports Nutrition | High-performance foods aid nutrient absorption. |
| Regulatory Support | Government encouragement encourages research on gastrointestinal health. |
The Indian industry is changing with increased health awareness and demand for protein-fortified food. Urban households are adding whey proteins to daily diets through fortified dairy, infant formula, and functional beverages. Enhanced disposable incomes of middle-class consumers have promoted improved affordability and availability of good-quality protein supplements.
Government initiatives in food fortification and dairy industry growth fuel industry growth. Indian firms are focusing on establishing local dairy supply chains to meet growing demand. Iconic dairy brands are developing product innovation in the form of high-protein variants of common foods. FMI expects the Indian industry to grow at 5.7% CAGR during the study period.
Growth Factors in India
| Key Drivers | Details |
|---|---|
| Rising Protein Consciousness | Consumers prefer high-protein foods. |
| Nutrition Fortification Policies | Government policies support nutritional fortification. |
| Dairy Industry Expansion | Local farmers improve supply chain effectiveness. |
| Growth of Functional Drinks | Urban consumers require whey-based drinks. |
The Japanese industry is evolving towards the premium applications of high-value proteins, particularly in specialist health foods and functional drinks. High-quality, well-digestible proteins are much appreciated in traditional Japanese diets, so demineralized whey is a valuable ingredient in healthy product formulation.
The country relies on imports of foreign whey proteins, with leading dairy firms importing demineralized whey of high purity from Europe and the USA Improved fermentation technology enables domestic production of bioactive whey peptides to meet Japanese dietary needs. Increased application in sports nutrition and elderly population supplements continues to drive industry growth. FMI opines that the Japanese industry will grow at 3.8% CAGR during the forecast period.
Growth Factors in Japan
| Key Drivers | Details |
|---|---|
| High-Growth Protein Demand | Consumers demand high-quality, digestible, and functional protein sources. |
| Import Dependency | The industry relies on whey protein imports from major suppliers. |
| Aging Population Initiative | Whey proteins address older nutrition and muscle maintenance. |
| Fermentation Innovations | R&D enhances the bioavailability of whey peptides. |
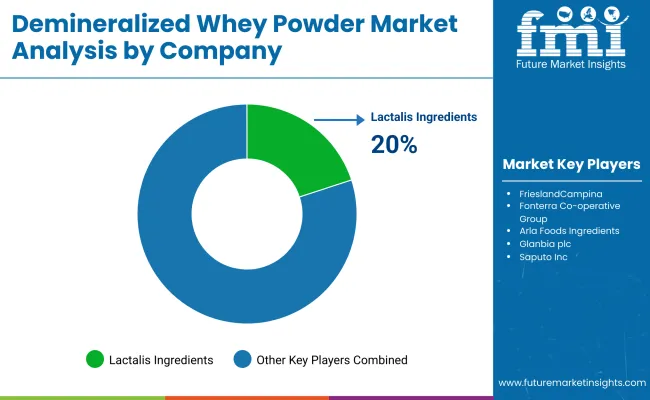
Lactalis Ingredients (20-25%)
Market champion with state-of-the-art whey processing technologies to supply the infant and medical nutrition industries.
FrieslandCampina (15-20%)
The company's emphasis is on having a presence across the globe with premium demineralized whey powders, sustainability, and high-quality formulations.
Fonterra Cooperative Group (10-15%)
Promoting dairy innovation with sustainable sourcing and expanding its whey protein portfolio.
Arla Foods Ingredients (8-12%)
Concentrating on functional whey-based solutions for sports nutrition and medical applications.
Glanbia plc (5-10%)
Focusing performance nutrition with high-quality demineralized whey and dairy protein solutions.
Other Key Players (20-30% Combined)
By product, the industry is segmented into 40% demineralized whey, 50% demineralized whey, 70% demineralized whey, and 90% demineralized whey.
By application, the industry is segmented into dietary supplements, bakery & confectionery, infant food, pharmaceuticals, and others.
By region, the industry is segmented into North America, Latin America, Europe, Asia Pacific, and Middle East & Africa (MEA).
The industry is slated to reach USD 722.6 million in 2025.
The industry is predicted to reach USD 1,200 million by 2035.
The key players in the industry include Lactalis Ingredients, FrieslandCampina, Fonterra Co-operative Group, Arla Foods Ingredients, Glanbia plc, Saputo Inc., Volac International Ltd., Euroserum, Sachsenmilch Leppersdorf GmbH, and Carbery Group.
India, slated to observe 5.7% CAGR during the study period, is poised for fastest growth.
50% demineralized whey is being widely used.


Our Research Products

The "Full Research Suite" delivers actionable market intel, deep dives on markets or technologies, so clients act faster, cut risk, and unlock growth.

The Leaderboard benchmarks and ranks top vendors, classifying them as Established Leaders, Leading Challengers, or Disruptors & Challengers.

Locates where complements amplify value and substitutes erode it, forecasting net impact by horizon

We deliver granular, decision-grade intel: market sizing, 5-year forecasts, pricing, adoption, usage, revenue, and operational KPIs—plus competitor tracking, regulation, and value chains—across 60 countries broadly.

Spot the shifts before they hit your P&L. We track inflection points, adoption curves, pricing moves, and ecosystem plays to show where demand is heading, why it is changing, and what to do next across high-growth markets and disruptive tech

Real-time reads of user behavior. We track shifting priorities, perceptions of today’s and next-gen services, and provider experience, then pace how fast tech moves from trial to adoption, blending buyer, consumer, and channel inputs with social signals (#WhySwitch, #UX).

Partner with our analyst team to build a custom report designed around your business priorities. From analysing market trends to assessing competitors or crafting bespoke datasets, we tailor insights to your needs.
Supplier Intelligence
Discovery & Profiling
Capacity & Footprint
Performance & Risk
Compliance & Governance
Commercial Readiness
Who Supplies Whom
Scorecards & Shortlists
Playbooks & Docs
Category Intelligence
Definition & Scope
Demand & Use Cases
Cost Drivers
Market Structure
Supply Chain Map
Trade & Policy
Operating Norms
Deliverables
Buyer Intelligence
Account Basics
Spend & Scope
Procurement Model
Vendor Requirements
Terms & Policies
Entry Strategy
Pain Points & Triggers
Outputs
Pricing Analysis
Benchmarks
Trends
Should-Cost
Indexation
Landed Cost
Commercial Terms
Deliverables
Brand Analysis
Positioning & Value Prop
Share & Presence
Customer Evidence
Go-to-Market
Digital & Reputation
Compliance & Trust
KPIs & Gaps
Outputs
Full Research Suite comprises of:
Market outlook & trends analysis
Interviews & case studies
Strategic recommendations
Vendor profiles & capabilities analysis
5-year forecasts
8 regions and 60+ country-level data splits
Market segment data splits
12 months of continuous data updates
DELIVERED AS:
PDF EXCEL ONLINE
Whey Protein Market Size and Share Forecast Outlook 2025 to 2035
Whey Protein Ingredients Market Size and Share Forecast Outlook 2025 to 2035
Whey Permeate Market Analysis by End user and Packaging Through 2035
Whey Protein Isolate Market Growth - Trends & Forecast through 2025 to 2035
Whey Hydrolysates Market
Analysis and Growth Projections for Native Whey Protein Market
Native Whey Protein Ingredients Market
Condensed Whey Market Size and Share Forecast Outlook 2025 to 2035
Acidified Whey Protein Market Analysis - Size, Share & Trends 2025 to 2035
Demand for Whey Hydrolysates for Medical Nutrition Drinks in CIS Analysis Size and Share Forecast Outlook 2025 to 2035
Demand for Whey-plus-Prebiotic Stacks for RTD Shakes in CIS Analysis Size and Share Forecast Outlook 2025 to 2035
Hydrolyzed Whey Protein Market Analysis by Product Form, Application, Sales Channel and Region through 2035
Concentrated Whey Market
Demand for RTD Whey Deployments for Shelf-stable Drinks in CIS Size and Share Forecast Outlook 2025 to 2035
Reduced Lactose Whey Market Size and Share Forecast Outlook 2025 to 2035
Demand of No-acid Whey Strained Dairy Processing Concepts in European Union Size and Share Forecast Outlook 2025 to 2035
Microparticulated Whey Protein Market Analysis by Application, Form & Region Through 2035
Demand of Heat Stable Whey for RTD Performance Drinks in EU Size and Share Forecast Outlook 2025 to 2035
Powdered Cellulose Market Analysis - Size, Share, and Forecast Outlook 2025 to 2035
Powdered Soft Drinks Market Size and Share Forecast Outlook 2025 to 2035

Thank you!
You will receive an email from our Business Development Manager. Please be sure to check your SPAM/JUNK folder too.
Chat With
MaRIA