Demand of Heat Stable Whey for RTD Performance Drinks in EU Size and Share Forecast Outlook 2025 to 2035

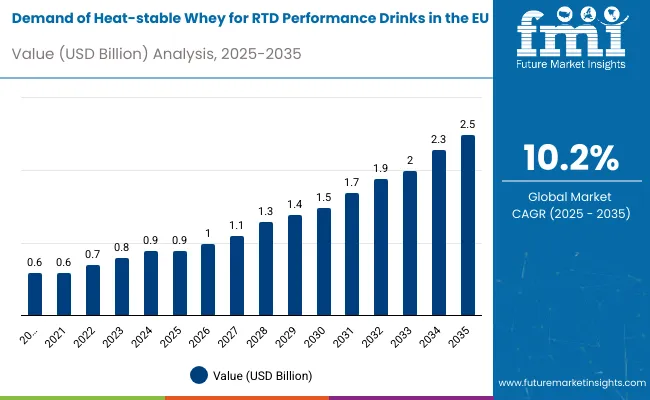
Sales of heat-stable whey for RTD performance drinks in the European Union are estimated at USD 0.94 billion in 2025, with projections indicating a rise to USD 2.47 billion by 2035, reflecting a CAGR of approximately 10.2% over the forecast period.
Heat-stable Whey for RTD Performance Drinks Analysis in EU Sales: Key Takeaways

  • Heat-stable Whey RTD Performance Drinks Sales Value (2025): USD 0.94 billion
  • Heat-stable Whey RTD Performance Drinks Forecast Value (2035): USD 2.47 billion
  • Heat-stable Whey RTD Performance Drinks Forecast CAGR (2025-2035): 10.2%
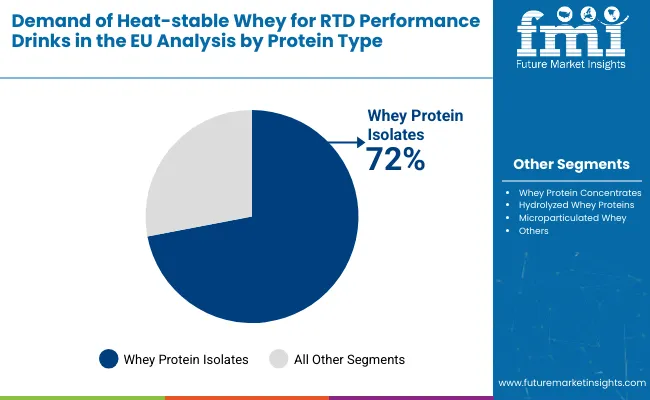
  • Leading Segment in Heat-stable Whey RTD Performance Drinks by Protein Type (2025): Whey Protein Isolates (72%)
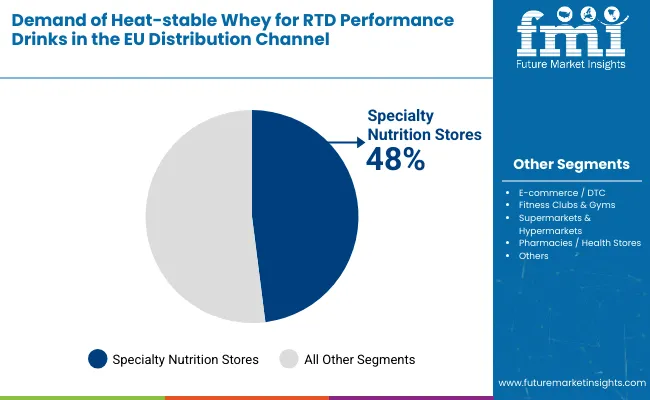
  • Leading Segment in Heat-stable Whey RTD Performance Drinks by Distribution (2025): Specialty Nutrition Stores (48%)
  • Fastest Growing Cities for Heat-stable Whey RTD: Madrid, Milan
  • Top Key Players in Heat-stable Whey RTD Sales: Glanbia Nutritionals, Arla Foods Ingredients, FrieslandCampina Ingredients, Kerry Group, Fonterra, Carbery Group

Demand Of Heat Stable Whey For Rtd Performance Drinks In Eu

Metric Value
Industry Size (2025E) USD 0.94 billion
Industry Value (2035F) USD 2.47 billion
CAGR (2025 to 2035) 10.2%

This growth reflects both a broadening consumer base and increased per capita consumption in key urban centres. The rise in demand is linked to shifting dietary preferences, growing awareness of sports nutrition, and evolving convenience trends. By 2025, per capita consumption in leading EU countries such as Germany, France, and the Netherlands averages between 0.8 to 1.2 kilograms, with projections reaching 1.6 kilograms by 2035. Berlin leads among metropolitan areas, expected to generate USD 197 million in heat-stable whey RTD sales by 2035, followed by Paris (USD 150 million), Amsterdam (USD 103 million), Madrid (USD 80 million), and Milan (USD 66 million).

The largest contribution to demand continues to come from whey protein isolate formulations, which are expected to account for 72% of total sales in 2025, owing to superior heat stability, clean taste profile, and extended shelf life properties. By distribution channel, specialty nutrition stores represent the dominant retail format, responsible for 48% of all sales, while e-commerce platforms and fitness clubs are expanding rapidly.

Consumer adoption is particularly concentrated among fitness enthusiasts and active professionals, with age groups 25-45 emerging as significant drivers of demand. While price remains a limiting factor, the average price premium over conventional RTD protein drinks has declined from 34% in 2020 to 19% in 2025. Continued improvements in manufacturing scale and direct-to-consumer offerings are expected to accelerate affordability and access across mid-income households. Regional disparities persist, but per capita demand in emerging Eastern European nations is narrowing the gap with traditionally strong Western European hubs.

Heat-stable Whey for RTD Performance Drinks in the EU: Segmentation

The heat-stable whey for RTD performance drinks space in the EU is classified across several segments. By protein type, the key categories include whey protein isolates, whey protein concentrates, hydrolyzed whey proteins, and microparticulated whey formulations. By distribution channel, the segment spans specialty nutrition stores, e-commerce platforms, fitness clubs and gyms, supermarkets and hypermarkets, and pharmaceutical retailers.

By application focus, formulations include post-workout recovery drinks, pre-exercise energy beverages, meal replacement shakes, clinical nutrition products, and general wellness beverages. By consumer profile, the segment covers fitness enthusiasts, professional athletes, active aging population, health-conscious millennials, and individuals with specific dietary requirements. By region, countries such as Germany, France, Netherlands, Spain, and Italy are included, along with coverage across all 27 EU member states. By city, key metro areas analyzed include Berlin, Paris, Amsterdam, Madrid, and Milan.
By Protein Type, Whey Protein Isolates to Lead with 72% Share

Demand Of Heat Stable Whey For Rtd Performance Drinks In Eu By Protein

Whey protein isolates are projected to dominate sales in 2025, supported by superior heat stability, neutral taste, and high protein content. Other formats such as concentrates, hydrolyzed proteins, and microparticulated formulations are growing steadily, each serving distinct performance needs.
  • Whey protein isolates are expected to hold a 72% value share in 2025, driven by exceptional heat stability during UHT processing, clean label appeal, and consumer preference for high-purity protein sources with minimal lactose content for clear, refreshing performance beverages.
  • Whey protein concentrates are gaining momentum in cost-conscious segments, especially among recreational athletes and fitness beginners, supported by competitive pricing and adequate functionality for shelf-stable RTD applications requiring moderate heat treatment.
  • Hydrolyzed whey proteins are showing strong traction in premium sports nutrition and clinical applications, with 12% annual growth tied to rapid absorption benefits and enhanced digestibility for specialized athletic performance and recovery protocols.
  • Microparticulated whey formulations appeal to beverage manufacturers seeking improved texture and mouthfeel in clear RTD drinks, expanding through partnerships with major food ingredient suppliers and beverage co-packers across Northern and Western Europe.

By Distribution, Specialty Nutrition Stores to Lead with 48% Share

Demand Of Heat Stable Whey For Rtd Performance Drinks In Eu By Distribution

Heat-stable whey RTD performance drinks in the EU are distributed through a mix of specialized retail and mainstream sales channels. Specialty nutrition stores are expected to remain the primary point of sale in 2025, followed by e-commerce platforms and fitness facilities. Distribution strategies are evolving to match consumer shopping behavior, with growth coming from both physical and digital formats.

  • Specialty nutrition stores are projected to account for 48% of total sales in 2025, supported by expert product knowledge, targeted consumer base, and strong relationships with performance nutrition brands like Optimum Nutrition, Applied Nutrition, and Scitec Nutrition across key EU retail networks.
  • E-commerce platforms and direct-to-consumer channels are expanding their role through subscription models, bulk purchasing options, and personalized nutrition services, targeting tech-savvy consumers with growing interest in convenient protein delivery solutions.
  • Fitness clubs and gym retail outlets are forecast to grow at over 15% CAGR (2025-2030), fueled by point-of-consumption convenience, cross-selling opportunities with training programs, and increasing adoption of premium beverage vending solutions in high-end fitness facilities.
  • Supermarkets and hypermarkets are increasingly testing dedicated sports nutrition sections in urban locations and health-focused store formats, appealing to mainstream consumers seeking accessible protein solutions during regular grocery shopping trips.
  • Pharmaceutical retailers and health stores, while niche, maintain a specialized consumer base focused on clinical-grade formulations, third-party testing verification, and therapeutic applications, contributing to consistent premium sales in select metropolitan areas.

By Application Focus, Post-Workout Recovery Drinks to Dominate Across Formats

Heat-stable whey RTD performance drinks in the EU utilize various application focuses, selected for efficacy, consumer need, and consumption timing. Post-workout recovery remains the most widely targeted application, though pre-exercise and meal replacement categories are gaining momentum. Product developers are increasingly exploring specialized formulations to meet evolving athletic and wellness demands.

  • Post-workout recovery drinks, featuring fast-absorbing whey proteins combined with carbohydrates and electrolytes, continue to anchor many RTD formulations due to proven muscle protein synthesis benefits, consumer familiarity, and strong scientific validation for recovery applications.
  • Pre-exercise energy beverages have emerged as a key growth category for caffeine-enhanced whey formulations, favored for sustained energy release and muscle preparation benefits, particularly popular among endurance athletes and morning workout enthusiasts.
  • Meal replacement shakes offer comprehensive nutrition profiles and are widely used in weight management and busy lifestyle applications; however, adoption is limited by regulatory requirements for complete nutrition claims, which impacts broader market scalability.
  • Clinical nutrition products, including high-protein beverages for elderly populations and medical recovery applications, are increasingly incorporating heat-stable whey for institutional and home care settings, adding specialized nutrition support while maintaining palatability.
  • General wellness beverages, including protein-enhanced functional drinks and everyday nutrition support, represent emerging opportunities but remain niche, receiving increased R&D focus due to mainstream consumer adoption potential and "better-for-you" beverage trends.

By Consumer Profile, Fitness Enthusiasts and Active Professionals Drive Core Demand

The heat-stable whey RTD performance drinks category appeals to a diverse consumer base across age groups, activity levels, and health objectives. While motivations vary from performance enhancement to convenience to clinical needs, demand is concentrated among five key demographic clusters. Each group brings distinct purchase behaviors, channel preferences, and product expectations.
  • Fitness enthusiasts represent a core consumer group prioritizing protein timing and recovery optimization; this segment tends to purchase premium formulations during specialty store visits and responds well to third-party testing claims, amino acid profiles, and performance-focused packaging.
  • Professional athletes show high repeat purchase intent for heat-stable whey RTD drinks aligned with training periodization; this group actively seeks NSF certified products, precise dosing, and convenient consumption formats, often purchasing through team nutritionists and specialized sports channels.
  • Active aging population, motivated by muscle preservation and mobility maintenance, increasingly favor ready-to-drink formats with moderate protein levels and familiar flavors; their purchasing is shaped by healthcare provider recommendations and clear nutritional labeling.
  • Health-conscious millennials experiment with heat-stable whey RTD drinks across digital platforms, favoring sustainable packaging, transparent sourcing, and convenient subscription models; their purchases are heavily influenced by social media reviews, ingredient transparency, and lifestyle integration.
  • Individuals with specific dietary requirements, including lactose intolerance, gluten sensitivity, and diabetes management, actively seek specialized whey isolate formulations with clinical validation, and demonstrate high brand loyalty when health benefits are experienced.

Sales of Heat-stable Whey RTD Performance Drinks in EU by City

Demand Of Heat Stable Whey For Rtd Performance Drinks In Eu By Country

Cities CAGR (2025 to 2035)
Madrid 3.12%
Milan 3.12%
Amsterdam 2.87%
Paris 2.87%
Berlin 2.64%

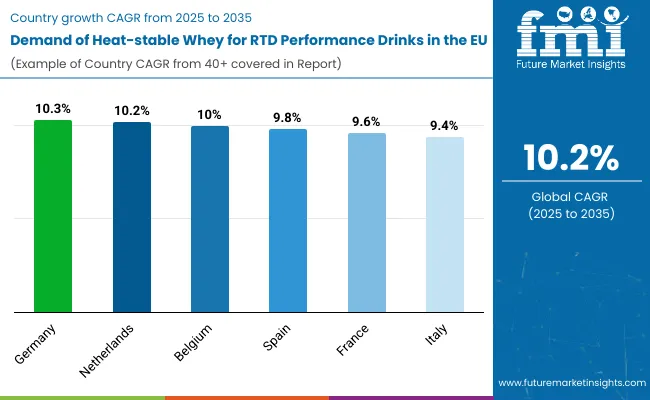
Heat-stable whey RTD performance drink sales will not grow uniformly across every metropolitan area. Rising health consciousness and faster adoption rates in Southern European cities give Madrid and Milan a measurable edge, while mature Northern European hubs such as Berlin expand more steadily from a higher base. The table below shows the compound annual growth rate (CAGR) each of the five largest cities is expected to record between 2025 and 2035.

Between 2025 and 2035, demand for heat-stable whey RTD performance drinks is projected to expand across all major EU metropolitan areas, but the pace of growth will vary based on demographic shifts, retail penetration, and baseline consumption levels. Among the top five cities analyzed, Madrid and Milan are expected to register the fastest compound annual growth rate (CAGR) of 3.12%, outpacing more mature Northern European hubs.

This acceleration is underpinned by a combination of factors: growing fitness culture, increasing disposable income, and expanding availability of premium sports nutrition products across specialized retail and modern trade channels. In both cities, per capita consumption is projected to rise from 0.9 kg in 2025 to 1.3 kg by 2035, closing the gap with higher-consumption cities such as Berlin and Amsterdam. Retail assortment is also expanding faster in these regions, with new heat-stable whey RTD formats gaining traction in fitness clubs, specialty nutrition stores, and premium convenience outlets.

Amsterdam and Paris are each forecast to grow at a CAGR of 2.87% over the same period. Both cities already maintain established sports nutrition ecosystems, with widespread access to heat-stable whey RTD products across specialty stores, fitness facilities, and online platforms. In Amsterdam, growth is supported by a strong cycling and fitness culture, brand experimentation, and increasing uptake of direct-to-consumer subscription models.

Paris reflects similar dynamics, particularly among professional athletes and health-conscious urban professionals seeking convenient protein solutions. In both cities, per capita consumption is projected to increase from 1.1 kg in 2025 to 1.5 kg by 2035, reflecting mainstreaming of performance nutrition convenience options.

Berlin, while maintaining the highest overall sales in absolute terms, is expected to grow at a CAGR of 2.64%, slightly below its Southern European counterparts. The city already exhibits higher-than-average per capita intake (1.2 kg in 2025), extensive product saturation, and a dense fitness retail network. Growth will likely come from product premiumization, specialized clinical applications, and format innovation rather than first-time trial.

Collectively, these five metropolitan areas represent the core of urban demand for heat-stable whey RTD performance drinks in the EU, but their individual growth paths highlight the importance of regional tailoring in pricing, format development, and channel strategy.
Notable Players and Strategies in EU Heat-stable Whey RTD Performance Drinks Space

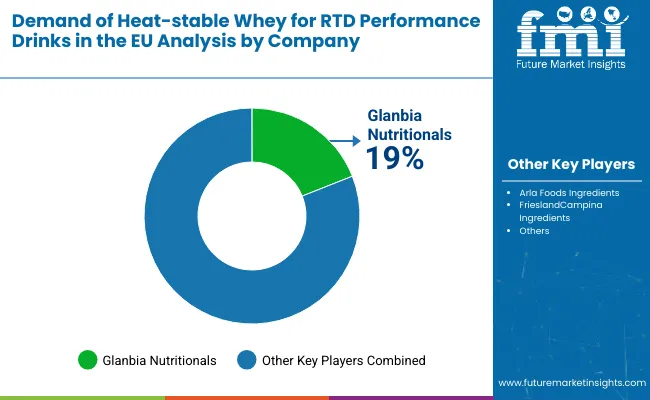
Demand Of Heat Stable Whey For Rtd Performance Drinks In Eu By Company

The competitive environment is characterized by a mix of established dairy ingredient suppliers and specialized sports nutrition manufacturers. Ingredient technology and distribution breadth rather than product count remains the decisive success factor: the five largest suppliers collectively reach more than 25,000 retail outlets across the EU and account for a majority of heat-stable whey RTD shelf facings in the category.

Glanbia Nutritionals is the most mature participant in the EU heat-stable whey ingredient space. The Irish company offers specialized heat-stable whey protein solutions including Optisol 1007 for neutral pH RTD beverages and clear protein isolates. Its core ingredient portfolio gives it deep penetration in sports nutrition manufacturing while maintaining full continental coverage through major beverage co-packers and private label partnerships.

Arla Foods Ingredients, owned by the Danish cooperative Arla Foods, leverages its advanced dairy processing capabilities to supply microparticulated whey proteins and heat-stable isolates to RTD manufacturers across Europe. Post-acquisition integration of specialized filtration technologies has allowed Arla to introduce ultra-clear whey solutions that maintain low viscosity and neutral taste in shelf-stable applications.

FrieslandCampina Ingredients, based in the Netherlands, benefits from scale synergies within a USD 11.6 billion dairy portfolio and from co-development partnerships with major European beverage brands. Recent launches under the Nutri Whey brand extend FrieslandCampina beyond ingredient supply into turnkey RTD beverage concepts specifically targeting performance nutrition manufacturers.

The next tier comprises regional specialists and emerging technology companies. Kerry Group focuses on functional protein blends and flavor-masked heat-stable formulations, with Q2-2025 financial reports showing steady growth in European sports nutrition ingredients. Fonterra, despite its New Zealand base, maintains significant European operations through specialized heat-stable whey concentrate offerings designed for extended shelf-life RTD applications.

Contract manufacturing partnerships with companies like Refresco and private label programs at retailers like Decathlon (Aptonia brand) and Lidl are expanding heat-stable whey RTD availability at price points 20-25% below branded equivalents, creating competitive pressure while supporting consumer trial. Consolidation is therefore likely to continue as ingredient innovation and omnichannel distribution become critical for maintaining market access and promotional frequency in this technology-driven category.

Key Players in EU Heat-stable Whey RTD Performance Drinks Space

  • Glanbia Nutritionals
  • Arla Foods Ingredients
  • FrieslandCampina Ingredients
  • Kerry Group
  • Fonterra Ingredients
  • Carbery Group
  • Volac International
  • DMK Group (Wheyco)
  • Lactalis Ingredients
  • Saputo Dairy Ingredients
  • Euroserum
  • Ingredia Nutritional
  • Hilmar Cheese Company
  • Agropur Ingredients
  • Leprino Foods
  • Private Label (Decathlon Aptonia)
  • Private Label (Lidl)
  • Private Label (REWE)
  • Contract Manufacturers (Refresco)
  • Specialized Co-packers

Scope Of Report

Attribute Details
Study Coverage EU sales and consumption of heat-stable whey for RTD performance drinks from 2020 to 2035
Base Year 2025
Historical Data 2020
Forecast Period 2025-2035
Units of Measurement USD (sales), Metric Tonnes (volume), Kilograms per capita (consumption)
Geography Covered All 27 EU member states; country-level and city-level granularity
Top Countries Analyzed Germany, France, Netherlands, Spain, Italy, Poland, Belgium
Top Cities Analyzed Berlin, Paris, Amsterdam, Madrid, Milan, Warsaw, Brussels
By Protein Type Whey protein isolates, Whey protein concentrates, Hydrolyzed whey, Microparticulated whey
By Distribution Channel Specialty nutrition stores, E-commerce/DTC, Fitness clubs, Supermarkets, Pharmacies
By Application Focus Post-workout recovery, Pre-exercise energy, Meal replacement, Clinical nutrition, General wellness
By Consumer Profile Fitness enthusiasts, Professional athletes, Active aging, Health-conscious millennials, Dietary restricted
Metrics Provided Sales (EUR), Volume (MT), Per capita consumption (kg), CAGR (2025-2035), Share by segment
Price Analysis Average unit prices by protein type and region
Competitive Landscape Company profiles, ingredient innovation strategies, manufacturing partnerships
Forecast Drivers Per capita demand trends, channel expansion, price convergence, fitness culture growth

Key Segments

By Protein Type:

  • Whey Protein Isolates
  • Whey Protein Concentrates
  • Hydrolyzed Whey Proteins
  • Microparticulated Whey Formulations

By Distribution Channel:

  • Specialty Nutrition Stores
  • E-commerce Platforms & DTC
  • Fitness Clubs & Gyms
  • Supermarkets & Hypermarkets
  • Pharmaceutical Retailers

By Application Focus:

  • Post-Workout Recovery Drinks
  • Pre-Exercise Energy Beverages
  • Meal Replacement Shakes
  • Clinical Nutrition Products
  • General Wellness Beverages

By Consumer Profile:

  • Fitness Enthusiasts
  • Professional Athletes
  • Active Aging Population
  • Health-Conscious Millennials
  • Individuals with Specific Dietary Requirements

By Country:

  • Germany
  • France
  • Netherlands
  • Spain
  • Italy
  • Poland
  • Belgium
  • Rest of EU

Table of Content

  1. Executive Summary
    • European Union Market Outlook
    • Demand-side Trends
    • Supply-side Trends
    • Technology Roadmap Analysis
    • Analysis and Recommendations
  2. Market Overview
    • Market Coverage / Taxonomy
    • Market Definition / Scope / Limitations
  3. Market Background
    • Market Dynamics
      • Drivers
      • Restraints
      • Opportunity
      • Trends
    • Scenario Forecast
      • Demand in Optimistic Scenario
      • Demand in Likely Scenario
      • Demand in Conservative Scenario
    • Opportunity Map Analysis
    • Product Life Cycle Analysis
    • Supply Chain Analysis
      • Supply Side Participants and their Roles
        • Producers
        • Mid-Level Participants (Traders/ Agents/ Brokers)
        • Wholesalers and Distributors
      • Value Added and Value Created at Node in the Supply Chain
      • List of Raw Material Suppliers
      • List of Existing and Potential Buyers
    • Investment Feasibility Matrix
    • Value Chain Analysis
      • Profit Margin Analysis
      • Wholesalers and Distributors
      • Retailers
    • PESTLE and Porter's Analysis
    • Regulatory Landscape
      • By Key Countries
      • EU-wide Regulations
    • Regional Parent Market Outlook
    • Production and Consumption Statistics
    • Import and Export Statistics
  4. Market Analysis 2020 to 2024 and Forecast, 2025 to 2035
    • Historical Market Size Value (USD Million) & Volume (MT) Analysis, 2020 to 2024
    • Current and Future Market Size Value (USD Million) & Volume (MT) Projections, 2025 to 2035
      • Y-o-Y Growth Trend Analysis
      • Absolute USD Opportunity Analysis
  5. Market Analysis 2020 to 2024 and Forecast 2025 to 2035, By Protein Type
    • Introduction / Key Findings
    • Historical Market Size Value (USD Million) & Volume (MT) Analysis By Protein Type, 2020 to 2024
    • Current and Future Market Size Value (USD Million) & Volume (MT) Analysis and Forecast By Protein Type, 2025 to 2035
      • Whey Protein Isolates
      • Whey Protein Concentrates
      • Hydrolyzed Whey Proteins
      • Microparticulated Whey Formulations
    • Y-o-Y Growth Trend Analysis By Protein Type, 2020 to 2024
    • Absolute USD Opportunity Analysis By Protein Type, 2025 to 2035
  6. Market Analysis 2020 to 2024 and Forecast 2025 to 2035, By Distribution Channel
    • Introduction / Key Findings
    • Historical Market Size Value (USD Million) & Volume (MT) Analysis By Distribution Channel, 2020 to 2024
    • Current and Future Market Size Value (USD Million) & Volume (MT) Analysis and Forecast By Distribution Channel, 2025 to 2035
      • Specialty Nutrition Stores
      • E-commerce Platforms & DTC
      • Fitness Clubs & Gyms
      • Supermarkets & Hypermarkets
      • Pharmaceutical Retailers
    • Y-o-Y Growth Trend Analysis By Distribution Channel, 2020 to 2024
    • Absolute USD Opportunity Analysis By Distribution Channel, 2025 to 2035
  7. Market Analysis 2020 to 2024 and Forecast 2025 to 2035, By Application Focus
    • Introduction / Key Findings
    • Historical Market Size Value (USD Million) & Volume (MT) Analysis By Application Focus, 2020 to 2024
    • Current and Future Market Size Value (USD Million) & Volume (MT) Analysis and Forecast By Application Focus, 2025 to 2035
      • Post-Workout Recovery Drinks
      • Pre-Exercise Energy Beverages
      • Meal Replacement Shakes
      • Clinical Nutrition Products
      • General Wellness Beverages
    • Y-o-Y Growth Trend Analysis By Application Focus, 2020 to 2024
    • Absolute USD Opportunity Analysis By Application Focus, 2025 to 2035
  8. Market Analysis 2020 to 2024 and Forecast 2025 to 2035, By Consumer Profile
    • Introduction / Key Findings
    • Historical Market Size Value (USD Million) & Volume (MT) Analysis By Consumer Profile, 2020 to 2024
    • Current and Future Market Size Value (USD Million) & Volume (MT) Analysis and Forecast By Consumer Profile, 2025 to 2035
      • Fitness Enthusiasts
      • Professional Athletes
      • Active Aging Population
      • Health-Conscious Millennials
      • Individuals with Specific Dietary Requirements
    • Y-o-Y Growth Trend Analysis By Consumer Profile, 2020 to 2024
    • Absolute USD Opportunity Analysis By Consumer Profile, 2025 to 2035
  9. Market Analysis 2020 to 2024 and Forecast 2025 to 2035, By Country
    • Introduction
    • Historical Market Size Value (USD Million) & Volume (MT) Analysis By Country, 2020 to 2024
    • Current Market Size Value (USD Million) & Volume (MT) Analysis and Forecast By Country, 2025 to 2035
      • Germany
      • France
      • Netherlands
      • Spain
      • Italy
      • Poland
      • Belgium
      • Rest of EU
    • Market Attractiveness Analysis By Country
  10. Germany Heat-Stable Whey RTD Performance Drinks Market Analysis 2020 to 2024 and Forecast 2025 to 2035
    • Historical Market Size Value (USD Million) & Volume (MT) Trend Analysis By Market Taxonomy, 2020 to 2024
    • Market Size Value (USD Million) & Volume (MT) Forecast By Market Taxonomy, 2025 to 2035
      • By Protein Type
      • By Distribution Channel
      • By Application Focus
      • By Consumer Profile
    • Market Attractiveness Analysis
      • By Protein Type
      • By Distribution Channel
      • By Application Focus
      • By Consumer Profile
    • Key Takeaways
  11. France Heat-Stable Whey RTD Performance Drinks Market Analysis 2020 to 2024 and Forecast 2025 to 2035
    • Historical Market Size Value (USD Million) & Volume (MT) Trend Analysis By Market Taxonomy, 2020 to 2024
    • Market Size Value (USD Million) & Volume (MT) Forecast By Market Taxonomy, 2025 to 2035
      • By Protein Type
      • By Distribution Channel
      • By Application Focus
      • By Consumer Profile
    • Market Attractiveness Analysis
      • By Protein Type
      • By Distribution Channel
      • By Application Focus
      • By Consumer Profile
    • Key Takeaways
  12. Netherlands Heat-Stable Whey RTD Performance Drinks Market Analysis 2020 to 2024 and Forecast 2025 to 2035
    • Historical Market Size Value (USD Million) & Volume (MT) Trend Analysis By Market Taxonomy, 2020 to 2024
    • Market Size Value (USD Million) & Volume (MT) Forecast By Market Taxonomy, 2025 to 2035
      • By Protein Type
      • By Distribution Channel
      • By Application Focus
      • By Consumer Profile
    • Market Attractiveness Analysis
      • By Protein Type
      • By Distribution Channel
      • By Application Focus
      • By Consumer Profile
    • Key Takeaways
  13. Spain Heat-Stable Whey RTD Performance Drinks Market Analysis 2020 to 2024 and Forecast 2025 to 2035
    • Historical Market Size Value (USD Million) & Volume (MT) Trend Analysis By Market Taxonomy, 2020 to 2024
    • Market Size Value (USD Million) & Volume (MT) Forecast By Market Taxonomy, 2025 to 2035
      • By Protein Type
      • By Distribution Channel
      • By Application Focus
      • By Consumer Profile
    • Market Attractiveness Analysis
      • By Protein Type
      • By Distribution Channel
      • By Application Focus
      • By Consumer Profile
    • Key Takeaways
  14. Italy Heat-Stable Whey RTD Performance Drinks Market Analysis 2020 to 2024 and Forecast 2025 to 2035
    • Historical Market Size Value (USD Million) & Volume (MT) Trend Analysis By Market Taxonomy, 2020 to 2024
    • Market Size Value (USD Million) & Volume (MT) Forecast By Market Taxonomy, 2025 to 2035
      • By Protein Type
      • By Distribution Channel
      • By Application Focus
      • By Consumer Profile
    • Market Attractiveness Analysis
      • By Protein Type
      • By Distribution Channel
      • By Application Focus
      • By Consumer Profile
    • Key Takeaways
  15. Key Cities Heat-Stable Whey RTD Performance Drinks Market Analysis
    • Berlin
      • Market Size Analysis, 2025 to 2035
      • Per Capita Consumption Analysis
      • Market Share Analysis, 2025
        • By Protein Type
        • By Distribution Channel
        • By Application Focus
        • By Consumer Profile
    • Paris
      • Market Size Analysis, 2025 to 2035
      • Per Capita Consumption Analysis
      • Market Share Analysis, 2025
        • By Protein Type
        • By Distribution Channel
        • By Application Focus
        • By Consumer Profile
    • Amsterdam
      • Market Size Analysis, 2025 to 2035
      • Per Capita Consumption Analysis
      • Market Share Analysis, 2025
        • By Protein Type
        • By Distribution Channel
        • By Application Focus
        • By Consumer Profile
    • Madrid
      • Market Size Analysis, 2025 to 2035
      • Per Capita Consumption Analysis
      • Market Share Analysis, 2025
        • By Protein Type
        • By Distribution Channel
        • By Application Focus
        • By Consumer Profile
    • Milan
      • Market Size Analysis, 2025 to 2035
      • Per Capita Consumption Analysis
      • Market Share Analysis, 2025
        • By Protein Type
        • By Distribution Channel
        • By Application Focus
        • By Consumer Profile
  16. Market Structure Analysis
    • Competition Dashboard
    • Competition Benchmarking
    • Market Share Analysis of Top Players
      • By Country
      • By Protein Type
      • By Distribution Channel
      • By Application Focus
  17. Competition Analysis
    • Competition Deep Dive
      • Glanbia Nutritionals
        • Overview
        • Product Portfolio
        • Profitability by Market Segments
        • Sales Footprint
        • Strategy Overview
          • Marketing Strategy
          • Product Strategy
          • Channel Strategy
      • Arla Foods Ingredients
        • Overview
        • Product Portfolio
        • Profitability by Market Segments
        • Sales Footprint
        • Strategy Overview
          • Marketing Strategy
          • Product Strategy
          • Channel Strategy
      • FrieslandCampina Ingredients
        • Overview
        • Product Portfolio
        • Profitability by Market Segments
        • Sales Footprint
        • Strategy Overview
          • Marketing Strategy
          • Product Strategy
          • Channel Strategy
      • Kerry Group
        • Overview
        • Product Portfolio
        • Profitability by Market Segments
        • Sales Footprint
        • Strategy Overview
          • Marketing Strategy
          • Product Strategy
          • Channel Strategy
      • Fonterra Ingredients
        • Overview
        • Product Portfolio
        • Profitability by Market Segments
        • Sales Footprint
        • Strategy Overview
          • Marketing Strategy
          • Product Strategy
          • Channel Strategy
      • Carbery Group
        • Overview
        • Product Portfolio
        • Profitability by Market Segments
        • Sales Footprint
        • Strategy Overview
          • Marketing Strategy
          • Product Strategy
          • Channel Strategy
      • Others
        • Overview
        • Product Portfolio
        • Profitability by Market Segments
        • Sales Footprint
        • Strategy Overview
          • Marketing Strategy
          • Product Strategy
          • Channel Strategy
  18. Assumptions & Acronyms Used
  19. Research Methodology

List of Figures

  • Figure 1: European Union Market Value (USD Million) by Protein Type, 2025-2035
  • Figure 2: European Union Market Value (USD Million) by Distribution Channel, 2025-2035
  • Figure 3: European Union Market Value (USD Million) by Application Focus, 2025-2035
  • Figure 4: European Union Market Value (USD Million) by Consumer Profile, 2025-2035
  • Figure 5: European Union Market Value (USD Million) by Country, 2025-2035
  • Figure 6: European Union Market Value (USD Million) Analysis by Country, 2020-2035
  • Figure 7: European Union Market Volume (MT) Analysis by Country, 2020-2035
  • Figure 8: European Union Market Value Share (%) and BPS Analysis by Country, 2025-2035
  • Figure 9: European Union Market Y-o-Y Growth (%) Projections by Country, 2025-2035
  • Figure 10: European Union Market Value (USD Million) Analysis by Protein Type, 2020-2035
  • Figure 11: European Union Market Volume (MT) Analysis by Protein Type, 2020-2035
  • Figure 12: European Union Market Value Share (%) and BPS Analysis by Protein Type, 2025-2035
  • Figure 13: European Union Market Y-o-Y Growth (%) Projections by Protein Type, 2025-2035
  • Figure 14: European Union Market Value (USD Million) Analysis by Distribution Channel, 2020-2035
  • Figure 15: European Union Market Volume (MT) Analysis by Distribution Channel, 2020-2035
  • Figure 16: European Union Market Value Share (%) and BPS Analysis by Distribution Channel, 2025-2035
  • Figure 17: European Union Market Y-o-Y Growth (%) Projections by Distribution Channel, 2025-2035
  • Figure 18: European Union Market Value (USD Million) Analysis by Application Focus, 2020-2035
  • Figure 19: European Union Market Volume (MT) Analysis by Application Focus, 2020-2035
  • Figure 20: European Union Market Value Share (%) and BPS Analysis by Application Focus, 2025-2035
  • Figure 21: European Union Market Y-o-Y Growth (%) Projections by Application Focus, 2025-2035
  • Figure 22: European Union Market Value (USD Million) Analysis by Consumer Profile, 2020-2035
  • Figure 23: European Union Market Volume (MT) Analysis by Consumer Profile, 2020-2035
  • Figure 24: European Union Market Value Share (%) and BPS Analysis by Consumer Profile, 2025-2035
  • Figure 25: European Union Market Y-o-Y Growth (%) Projections by Consumer Profile, 2025-2035
  • Figure 26: European Union Market Attractiveness by Protein Type, 2025-2035
  • Figure 27: European Union Market Attractiveness by Distribution Channel, 2025-2035
  • Figure 28: European Union Market Attractiveness by Application Focus, 2025-2035
  • Figure 29: European Union Market Attractiveness by Consumer Profile, 2025-2035
  • Figure 30: European Union Market Attractiveness by Country, 2025-2035
  • Figure 31: Germany Market Value (USD Million) by Protein Type, 2025-2035
  • Figure 32: Germany Market Value (USD Million) by Distribution Channel, 2025-2035
  • Figure 33: Germany Market Value (USD Million) by Application Focus, 2025-2035
  • Figure 34: Germany Market Value (USD Million) by Consumer Profile, 2025-2035
  • Figure 35: Germany Market Value (USD Million) Analysis by Protein Type, 2020-2035
  • Figure 36: Germany Market Volume (MT) Analysis by Protein Type, 2020-2035
  • Figure 37: Germany Market Value Share (%) and BPS Analysis by Protein Type, 2025-2035
  • Figure 38: Germany Market Y-o-Y Growth (%) Projections by Protein Type, 2025-2035
  • Figure 39: Germany Market Value (USD Million) Analysis by Distribution Channel, 2020-2035
  • Figure 40: Germany Market Volume (MT) Analysis by Distribution Channel, 2020-2035
  • Figure 41: Germany Market Value Share (%) and BPS Analysis by Distribution Channel, 2025-2035
  • Figure 42: Germany Market Y-o-Y Growth (%) Projections by Distribution Channel, 2025-2035
  • Figure 43: Germany Market Value (USD Million) Analysis by Application Focus, 2020-2035
  • Figure 44: Germany Market Volume (MT) Analysis by Application Focus, 2020-2035
  • Figure 45: Germany Market Value Share (%) and BPS Analysis by Application Focus, 2025-2035
  • Figure 46: Germany Market Y-o-Y Growth (%) Projections by Application Focus, 2025-2035
  • Figure 47: Germany Market Value (USD Million) Analysis by Consumer Profile, 2020-2035
  • Figure 48: Germany Market Volume (MT) Analysis by Consumer Profile, 2020-2035
  • Figure 49: Germany Market Value Share (%) and BPS Analysis by Consumer Profile, 2025-2035
  • Figure 50: Germany Market Y-o-Y Growth (%) Projections by Consumer Profile, 2025-2035
  • Figure 51: Germany Market Attractiveness by Protein Type, 2025-2035
  • Figure 52: Germany Market Attractiveness by Distribution Channel, 2025-2035
  • Figure 53: Germany Market Attractiveness by Application Focus, 2025-2035
  • Figure 54: Germany Market Attractiveness by Consumer Profile, 2025-2035
  • Figure 55: France Market Value (USD Million) by Protein Type, 2025-2035
  • Figure 56: France Market Value (USD Million) by Distribution Channel, 2025-2035
  • Figure 57: France Market Value (USD Million) by Application Focus, 2025-2035
  • Figure 58: France Market Value (USD Million) by Consumer Profile, 2025-2035
  • Figure 59: France Market Value (USD Million) Analysis by Protein Type, 2020-2035
  • Figure 60: France Market Volume (MT) Analysis by Protein Type, 2020-2035
  • Figure 61: France Market Value Share (%) and BPS Analysis by Protein Type, 2025-2035
  • Figure 62: France Market Y-o-Y Growth (%) Projections by Protein Type, 2025-2035
  • Figure 63: France Market Value (USD Million) Analysis by Distribution Channel, 2020-2035
  • Figure 64: France Market Volume (MT) Analysis by Distribution Channel, 2020-2035
  • Figure 65: France Market Value Share (%) and BPS Analysis by Distribution Channel, 2025-2035
  • Figure 66: France Market Y-o-Y Growth (%) Projections by Distribution Channel, 2025-2035
  • Figure 67: France Market Value (USD Million) Analysis by Application Focus, 2020-2035
  • Figure 68: France Market Volume (MT) Analysis by Application Focus, 2020-2035
  • Figure 69: France Market Value Share (%) and BPS Analysis by Application Focus, 2025-2035
  • Figure 70: France Market Y-o-Y Growth (%) Projections by Application Focus, 2025-2035
  • Figure 71: France Market Value (USD Million) Analysis by Consumer Profile, 2020-2035
  • Figure 72: France Market Volume (MT) Analysis by Consumer Profile, 2020-2035
  • Figure 73: France Market Value Share (%) and BPS Analysis by Consumer Profile, 2025-2035
  • Figure 74: France Market Y-o-Y Growth (%) Projections by Consumer Profile, 2025-2035
  • Figure 75: France Market Attractiveness by Protein Type, 2025-2035
  • Figure 76: France Market Attractiveness by Distribution Channel, 2025-2035
  • Figure 77: France Market Attractiveness by Application Focus, 2025-2035
  • Figure 78: France Market Attractiveness by Consumer Profile, 2025-2035
  • Figure 79: Netherlands Market Value (USD Million) by Protein Type, 2025-2035
  • Figure 80: Netherlands Market Value (USD Million) by Distribution Channel, 2025-2035
  • Figure 81: Netherlands Market Value (USD Million) by Application Focus, 2025-2035
  • Figure 82: Netherlands Market Value (USD Million) by Consumer Profile, 2025-2035
  • Figure 83: Netherlands Market Value (USD Million) Analysis by Protein Type, 2020-2035
  • Figure 84: Netherlands Market Volume (MT) Analysis by Protein Type, 2020-2035
  • Figure 85: Netherlands Market Value Share (%) and BPS Analysis by Protein Type, 2025-2035
  • Figure 86: Netherlands Market Y-o-Y Growth (%) Projections by Protein Type, 2025-2035
  • Figure 87: Netherlands Market Value (USD Million) Analysis by Distribution Channel, 2020-2035

Frequently Asked Questions

What is the projected sales value of heat-stable whey for RTD performance drinks in the EU by 2035?

By 2035, total EU sales of heat-stable whey for RTD performance drinks are projected to reach EUR 2.34 billion, up from EUR 0.89 billion in 2025, reflecting a CAGR of approximately 10.2%.

Which protein types dominate the EU heat-stable whey RTD performance drinks category?

Whey protein isolates hold the leading share, accounting for approximately 72% of total sales in 2025, followed by whey protein concentrates and hydrolyzed whey formulations.

What are the fastest-growing cities for heat-stable whey RTD performance drink consumption?

Madrid and Milan lead in projected growth, each registering a CAGR of 3.12% between 2025 and 2035, due to expanding fitness culture and increasing health consciousness.

Which distribution channels are most effective for heat-stable whey RTD performance drinks in the EU?

Specialty nutrition stores are the dominant sales channel (48% share in 2025), but e-commerce platforms and fitness clubs are growing at double-digit CAGR, especially in urban regions.

Who are the key companies driving heat-stable whey RTD innovation in the EU?

Major players include Glanbia Nutritionals, Arla Foods Ingredients, FrieslandCampina Ingredients, Kerry Group, and Fonterra, with growing competition from private label brands and specialized co-packers.

Explore Similar Insights

Future Market Insights

Demand of Heat Stable Whey for RTD Performance Drinks in EU