The demand for mineral enrichment ingredients in the USA is projected to reach USD 0.9 billion by 2035, reflecting an absolute increase of USD 0.3 billion over the forecast period. The industry, valued at USD 0.6 billion in 2025, is expected to grow at a CAGR of 3.60%. This growth is primarily driven by the increasing focus on fortified food and beverage products, where mineral enrichment ingredients are essential for improving nutritional content and supporting health-conscious consumers.
Mineral enrichment ingredients, such as calcium, iron, magnesium, zinc, and other trace minerals, are widely used in a variety of products, including dairy, bakery, snacks, beverages, and dietary supplements. The growing awareness of health and wellness, along with rising concerns over nutrient deficiencies in the population, is driving the demand for these ingredients. The increasing prevalence of lifestyle diseases such as osteoporosis, anemia, and cardiovascular diseases is encouraging consumers to seek fortified food options that support overall health.
The industry for mineral enrichment ingredients is also supported by innovations in food science and technology, which allow for the development of more bioavailable forms of minerals that are easier for the body to absorb. As the demand for fortified and functional foods continues to rise, the mineral enrichment ingredient industry is expected to expand, particularly in the health-conscious and aging population segments. As regulatory standards for food fortification become more stringent, manufacturers will continue to innovate and enhance their product offerings, driving growth throughout the forecast period.
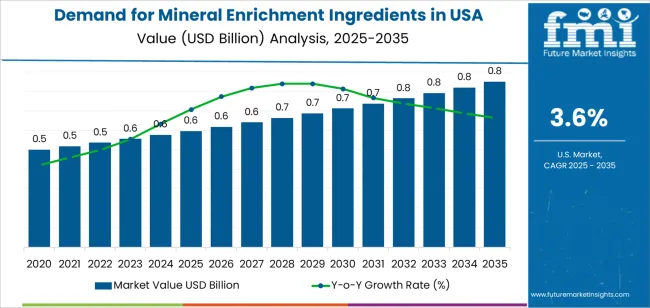
Between 2025 and 2030, the demand for mineral enrichment ingredients in the USA is projected to grow from USD 0.6 billion to approximately USD 0.7 billion, adding USD 0.1 billion, which accounts for about 33.3% of the total forecasted growth for the decade. This period will see an increased focus on food fortification across the health and wellness sector, with more manufacturers incorporating essential minerals into a wider range of products to cater to health-conscious consumers.
From 2030 to 2035, the demand is expected to expand from approximately USD 0.7 billion to USD 0.9 billion, adding USD 0.2 billion, which constitutes about 66.7% of the overall growth. This phase will be marked by broader adoption of mineral enrichment ingredients as public awareness of the benefits of fortified foods continues to rise. The aging population, along with ongoing innovation in functional food products, will further fuel demand. As consumers continue to prioritize immunity-boosting and preventative health measures, the need for enhanced nutritional solutions will drive significant growth in the industry.
| Metric | Value |
|---|---|
| Mineral Enrichment Ingredients Value (2025) | USD 0.6 billion |
| Mineral Enrichment Ingredients Forecast Value (2035) | USD 0.9 billion |
| Mineral Enrichment Ingredients Forecast CAGR (2025-2035) | 3.60% |
The demand for mineral enrichment ingredients in the USA is growing due to the increasing focus on health and wellness, as consumers are becoming more conscious of their nutritional needs. Mineral enrichment ingredients are widely used in the food, beverage, and dietary supplement industries to fortify products with essential minerals such as calcium, iron, magnesium, and zinc. These ingredients play a critical role in addressing mineral deficiencies in the population, supporting overall health, and improving the nutritional value of processed foods.
The rising awareness of mineral deficiencies and the growing prevalence of conditions related to poor nutrition, such as osteoporosis and anemia, are driving the demand for mineral enrichment ingredients. With consumers seeking products that support their health and well-being, manufacturers are incorporating these ingredients into a wide range of food products, from dairy and cereals to energy bars and beverages. The increased demand for functional foods, as well as personalized nutrition solutions, is further boosting the adoption of mineral enrichment ingredients.
The expansion of the dietary supplement industry, as consumers seek convenient ways to meet their daily mineral intake needs, is also contributing to industry growth. Advancements in ingredient formulations, improved bioavailability, and regulatory support for fortified food products are further fueling demand. As the focus on preventive healthcare and nutrition continues to grow, the demand for mineral enrichment ingredients is expected to rise steadily over the coming years.
Demand is segmented by form, ingredient type, end use, and region. By form, demand is divided into powder and granule, with powder leading the demand. Based on ingredient type, demand is categorized into zinc, sodium, potassium, calcium, phosphorous, and magnesium, with zinc representing the largest share. Regionally, demand is divided into North America, Europe, Asia Pacific, and other key regions, with North America showing the highest concentration of demand for mineral enrichment ingredients.
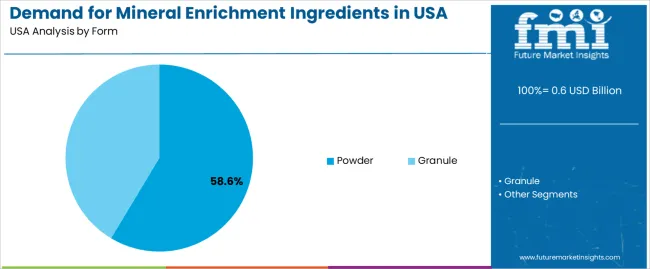
The powder form accounts for 58.60% of the demand for mineral enrichment ingredients in the USA, making it the dominant form. Powdered ingredients are preferred because they offer ease of use, excellent mixability, and versatility in a wide range of food and beverage products. The powdered form allows for uniform distribution of minerals throughout the product, ensuring consistent quality and maintaining the desired nutritional profile. It is also easier to handle, store, and transport compared to granules, and typically has a longer shelf life.
As manufacturers in the food industry continue to seek cost-effective and convenient solutions, powdered mineral ingredients have become the go-to choice. Powdered forms are highly adaptable to various food categories, including dairy, bakery products, and ready-to-eat meals, which fuels their widespread adoption. The powder form’s ability to seamlessly integrate into production processes is a key factor driving its leading position in the industry.
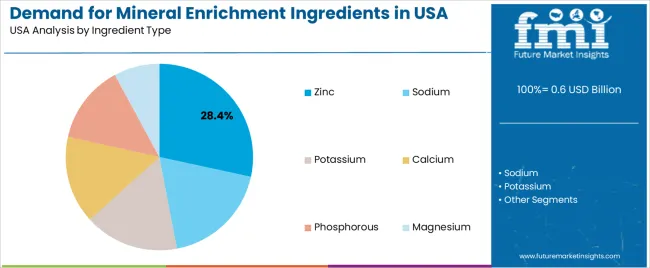
Zinc accounts for 28.40% of the demand for mineral enrichment ingredients in the USA. Zinc is an essential micronutrient involved in numerous bodily functions, including immune support, cell division, and protein synthesis, making it a crucial addition to many food products. The high demand for zinc-enriched foods is driven by its role in health promotion, especially in products aimed at boosting immune health and overall wellness.
Zinc is commonly added to processed foods, such as breakfast cereals, dairy products, and ready-to-eat meals, where it enhances the nutritional profile. The growing awareness of the importance of micronutrients in maintaining health has driven the adoption of zinc in food fortification. As consumers become more health-conscious and demand nutrient-rich foods, the need for zinc-enriched products continues to rise, cementing its place as the leading ingredient in the mineral enrichment sector in the USA.
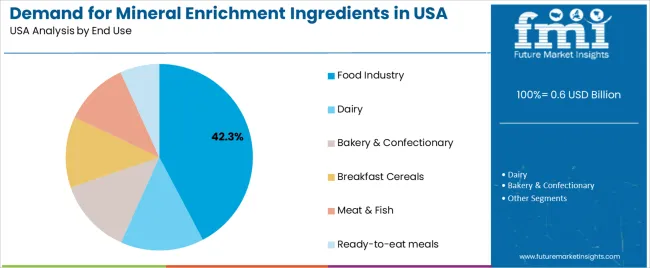
The food industry holds 42.3% of the demand for mineral enrichment ingredients in the USA, making it the dominant end-use segment. The increasing focus on health and wellness has led to a surge in the demand for fortified food products, as consumers seek to enhance their diets with essential nutrients. Mineral enrichment in the food industry is vital for products such as dairy, bakery goods, and ready-to-eat meals, where minerals like zinc, calcium, and magnesium are added to improve nutritional value.
Food manufacturers are incorporating mineral enrichment to cater to health-conscious consumers who prioritize nutrient-dense foods. The food industry’s large share reflects the growing trend of incorporating health-promoting ingredients into everyday products, addressing nutritional gaps and supporting public health goals. As fortified foods continue to gain popularity, the food industry remains the leading sector driving the demand for mineral enrichment ingredients in the USA, ensuring that this trend will persist.
Mineral enrichment such as calcium, magnesium, iron, and zinc are increasingly added to functional foods, beverages, dietary supplements, and plant‑based alternatives to address nutrition gaps and the needs of an aging population. Key drivers include heightened wellness awareness, strong fortification practices in the USA food industry, and the growing preference for "clean‑label" and high‑bioavailability mineral blends. Restraints include formulation challenges (taste, solubility, stability), tight regulatory requirements on nutrient claims and labeling, and cost pressures for premium fortification solutions.
Demand is growing because USA consumers are increasingly seeking products that go beyond basic nutrition and deliver functional benefits such as bone health, immune support, and energy metabolism. Manufacturers are integrating mineral enrichment into breakfast cereals, plant‑based milk alternatives, fortified beverages, and snack bars. Trends such as aging demographics, the rise of vegan/vegetarian diets, and a heightened focus on preventive nutrition contribute to this growth. The USA, as part of North America, is known for a well‑develop industry for fortified and enriched foods, which further fuels the usage of mineral enrichment ingredients in food processing and supplement sectors.
Technological and product innovations are driving growth in the USA industry for mineral enrichment ingredients. Ingredient suppliers are developing mineral forms with improved solubility, better bioavailability (such as chelated minerals or micro‑encapsulated powders), and neutral taste profiles, which make them easier to incorporate into a wider range of foods and beverages without compromising sensory quality. Innovation is also seen in plant‑based mineral sources, tailor‑made blends for targeted nutrition (e.g., bone health, metabolic support), and formats optimized for processing (powders, granules) that suit high‑speed food manufacturing lines. These advances make mineral enrichment more attractive to food formulators and, as a result, drive demand.
Despite the growth potential, several challenges limit the uptake of mineral enrichment ingredients in the USA industry. One challenge is the cost: high‑performance mineral forms (with enhanced bioavailability or clean‑label claims) often cost more than basic formulations, which can constrain margins for food and beverage producers. Formulation complexity is another barrier, as adding minerals can affect taste, texture, or stability of products, especially in sensitive formats like plant‑based milks or snack bars. Regulatory and labeling requirements around nutrient claims and fortification must also be navigated carefully to avoid mislabeling. Competition from natural, inherent nutrient sources and clean‑label skepticism among consumers may limit acceptance of heavily fortified products.
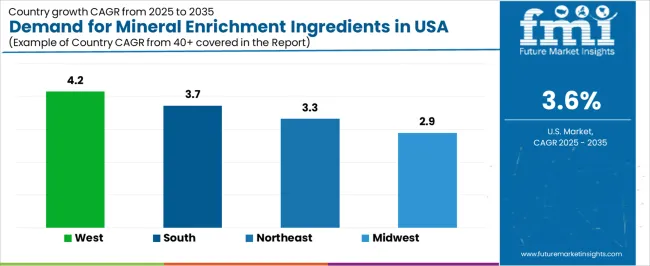
| Region | CAGR (%) |
|---|---|
| West | 4.2% |
| South | 3.7% |
| Northeast | 3.3% |
| Midwest | 2.9% |
The demand for mineral enrichment ingredients in the USA is growing across various regions, with the West leading at a 4.2% CAGR. This growth is driven by the increasing focus on health and wellness, as well as the rising demand for fortified food and beverages. The South follows with a 3.7% CAGR, supported by the growing food processing industry and an expanding focus on nutrition. The Northeast shows a 3.3% CAGR, bolstered by the region's demand for healthier food options and nutritional supplements. The Midwest, while growing at a more moderate 2.9%, continues to adopt mineral enrichment in food production to meet consumer demand for enhanced nutritional profiles in products.
The West is seeing the highest demand growth for mineral enrichment ingredients in the USA, with a 4.2% CAGR. The region’s strong health and wellness culture, particularly in states like California and Washington, drives the demand for fortified products. Health-conscious consumers in the West are increasingly prioritizing foods that support their nutritional needs, leading to a rise in the consumption of functional foods and beverages. As the demand for products that support health and well-being continues to grow, the use of mineral-enriched ingredients is becoming more common.
The West is also experiencing an increased focus on plant-based and organic foods. As more consumers opt for plant-based diets, the need for mineral enrichment to supplement potential nutrient gaps becomes more apparent. The region’s progressive food industry is responding to this demand by incorporating enriched ingredients into a wide range of food products, from snacks to beverages. Personalized nutrition, a growing trend, is further propelling the use of minerals to meet specific health needs. As consumers seek healthier, nutrient-dense food options, the West is expected to continue leading the demand for mineral enrichment in the coming years.
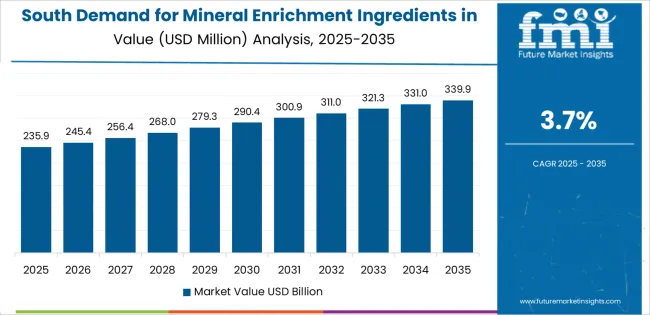
The South is witnessing steady growth in the demand for mineral enrichment ingredients, with a 3.7% CAGR. The region’s robust food processing and manufacturing sectors, particularly in states like Texas, Georgia, and Florida, are key drivers of this growth. As the South continues to expand its food production capabilities, there is a rising demand for fortified ingredients to improve the nutritional value of products, especially in processed foods, beverages, and nutritional supplements. This trend is being supported by a growing number of food companies adopting healthier and more nutrient-dense ingredients.
The increasing awareness among consumers about the importance of health and nutrition is contributing to the demand for mineral-enriched products. As people seek foods that offer more than just basic nutrition, the need for functional foods with added minerals is increasing. The South's diverse and evolving population also drives the demand for products that cater to various dietary preferences and health needs. With the growing focus on healthier lifestyles and nutrition, the use of mineral-enriched ingredients in food and beverages is expected to continue its upward trajectory in the South.
The Northeast is experiencing moderate growth in the demand for mineral enrichment ingredients, with a 3.3% CAGR. The region’s focus on healthy living, particularly in urban centers like New York and Boston, plays a significant role in this trend. As more consumers prioritize functional foods and beverages to support their health, the demand for products with added vitamins and minerals is steadily increasing. The region’s active lifestyle culture and health-conscious population are key factors driving the adoption of mineral-enriched products.
The Northeast also has a strong presence in the pharmaceutical and nutritional supplement industries, which further supports the demand for enriched ingredients in food and supplements. As preventive healthcare becomes a growing priority, more consumers are turning to fortified foods to enhance their overall health and well-being. The availability of fortified foods is expanding, making it easier for consumers to access products that meet their nutritional needs. As these health trends continue, the demand for mineral enrichment ingredients is expected to grow, especially as the food and beverage industry adapts to meet the region’s evolving health and wellness preferences.
The Midwest is seeing moderate growth in the demand for mineral enrichment ingredients, with a 2.9% CAGR. The region’s strong agricultural base, particularly in states like Illinois and Michigan, is a key driver of this growth. The Midwest is known for its food production and manufacturing industries, and as these industries innovate, the demand for fortified ingredients in food products is rising. Health-conscious consumers are seeking food options that provide added nutritional value, leading to increased use of mineral-enriched ingredients, especially in processed foods and supplements.
As the food industry in the Midwest focuses more on improving the nutritional quality of food, the demand for mineral enrichment is expected to grow steadily. The rising focus on nutrition and wellness among consumers, combined with a growing demand for healthier food options, is further supporting this trend. While the Midwest’s growth rate is slower compared to other regions, the region’s continued commitment to improving the health profile of food products and meeting consumer demand for enhanced nutritional benefits ensures steady growth in mineral enrichment USAge.
The demand for mineral enrichment ingredients in the United States has been steadily rising as consumers increasingly focus on health and wellness, with many turning to fortified foods, beverages, and dietary supplements to meet their nutritional needs. The growing awareness of micronutrient deficiencies and the need for better dietary balance have led to heightened demand for mineral-enriched products that support bone health, immune function, and overall metabolic wellness.
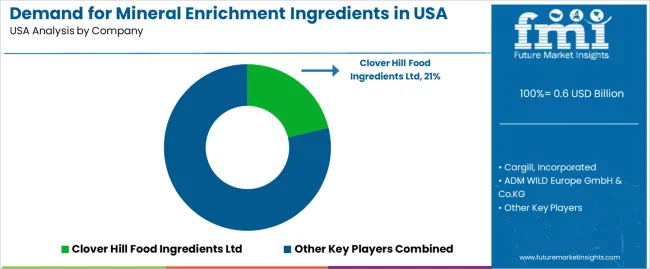
In the USA, Clover Hill Food Ingredients Ltd. leads the industry with a 21.2% share, benefiting from its strong product offerings in the mineral enrichment segment. Other major players in the industry include Cargill, Incorporated, ADM WILD Europe GmbH & Co.KG, Nestlé, and Wilmar International Limited, which provide a range of mineral-enriched ingredients catering to diverse sectors like food, beverages, and supplements. These companies are critical in meeting the growing demand for fortified products.
Key drivers of demand include the increasing consumption of health-conscious products and the rising incidence of conditions related to mineral deficiencies. As consumers demand more functional and fortified foods, companies are focusing on developing bioavailable forms of minerals like calcium, magnesium, and iron, which are essential for various bodily functions. The USA industry for mineral enrichment ingredients is expected to continue its growth, driven by trends in clean labels, plant-based diets, and personalized nutrition. Challenges such as regulatory hurdles and the cost of high-quality ingredients may temper some aspects of this demand. The outlook for mineral enrichment ingredients remains strong in the USA, with continued growth anticipated as health trends evolve.
| Items | Values |
|---|---|
| Quantitative Units | USD billion |
| Form | Powder, Granule |
| Ingredient Type | Zinc, Sodium, Potassium, Calcium, Phosphorous, Magnesium |
| End Use | Food Industry, Dairy, Bakery & Confectionery, Breakfast Cereals, Meat & Fish, Ready-to-eat Meals |
| Regions Covered | West, South, Northeast, Midwest |
| Key Players Profiled | Clover Hill Food Ingredients Ltd, Cargill, Incorporated, ADM WILD Europe GmbH & Co. KG, Nestlé, Wilmar International Limited |
| Additional Attributes | Dollar sales by form, ingredient type, and end-use categories, regional adoption trends, competitive landscape, advancements in mineral enrichment ingredients technologies, integration with food industry sectors. |
The global demand for mineral enrichment ingredients in USA is estimated to be valued at USD 0.6 billion in 2025.
The market size for the demand for mineral enrichment ingredients in USA is projected to reach USD 0.8 billion by 2035.
The demand for mineral enrichment ingredients in USA is expected to grow at a 3.6% CAGR between 2025 and 2035.
The key product types in demand for mineral enrichment ingredients in USA are powder and granule.
In terms of ingredient type, zinc segment to command 28.4% share in the demand for mineral enrichment ingredients in USA in 2025.


Our Research Products

The "Full Research Suite" delivers actionable market intel, deep dives on markets or technologies, so clients act faster, cut risk, and unlock growth.

The Leaderboard benchmarks and ranks top vendors, classifying them as Established Leaders, Leading Challengers, or Disruptors & Challengers.

Locates where complements amplify value and substitutes erode it, forecasting net impact by horizon

We deliver granular, decision-grade intel: market sizing, 5-year forecasts, pricing, adoption, usage, revenue, and operational KPIs—plus competitor tracking, regulation, and value chains—across 60 countries broadly.

Spot the shifts before they hit your P&L. We track inflection points, adoption curves, pricing moves, and ecosystem plays to show where demand is heading, why it is changing, and what to do next across high-growth markets and disruptive tech

Real-time reads of user behavior. We track shifting priorities, perceptions of today’s and next-gen services, and provider experience, then pace how fast tech moves from trial to adoption, blending buyer, consumer, and channel inputs with social signals (#WhySwitch, #UX).

Partner with our analyst team to build a custom report designed around your business priorities. From analysing market trends to assessing competitors or crafting bespoke datasets, we tailor insights to your needs.
Supplier Intelligence
Discovery & Profiling
Capacity & Footprint
Performance & Risk
Compliance & Governance
Commercial Readiness
Who Supplies Whom
Scorecards & Shortlists
Playbooks & Docs
Category Intelligence
Definition & Scope
Demand & Use Cases
Cost Drivers
Market Structure
Supply Chain Map
Trade & Policy
Operating Norms
Deliverables
Buyer Intelligence
Account Basics
Spend & Scope
Procurement Model
Vendor Requirements
Terms & Policies
Entry Strategy
Pain Points & Triggers
Outputs
Pricing Analysis
Benchmarks
Trends
Should-Cost
Indexation
Landed Cost
Commercial Terms
Deliverables
Brand Analysis
Positioning & Value Prop
Share & Presence
Customer Evidence
Go-to-Market
Digital & Reputation
Compliance & Trust
KPIs & Gaps
Outputs
Full Research Suite comprises of:
Market outlook & trends analysis
Interviews & case studies
Strategic recommendations
Vendor profiles & capabilities analysis
5-year forecasts
8 regions and 60+ country-level data splits
Market segment data splits
12 months of continuous data updates
DELIVERED AS:
PDF EXCEL ONLINE
Demand Signal Repository Solutions Market Size and Share Forecast Outlook 2025 to 2035
Demand Side Management Market Size and Share Forecast Outlook 2025 to 2035
Demand Response Market Analysis - Size, Share, and Forecast Outlook 2025 to 2035
North America Shipping Supplies Market Trends – Innovations & Growth 2024-2034
Demand of Kozani Saffron in Greece Analysis - Size, Share & Forecast 2025 to 2035
Demand of No-acid Whey Strained Dairy Processing Concepts in European Union Size and Share Forecast Outlook 2025 to 2035
Demand for Bronte Pistachio in Italy Analysis - Size, Share & Forecast 2025 to 2035
Demand and Trend Analysis of Gaming Monitor in Western Europe Size and Share Forecast Outlook 2025 to 2035
Demand and Trend Analysis of Gaming Monitor in Japan Size and Share Forecast Outlook 2025 to 2035
Demand and Trend Analysis of Gaming Monitor in Korea Size and Share Forecast Outlook 2025 to 2035
Glycine Soja (Soybean) Seed Extract Market Size and Share Forecast Outlook 2025 to 2035
Demand and Trend Analysis of Yeast in Japan - Size, Share, and Forecast Outlook 2025 to 2035
Demand and Trends Analysis of Stevia in Japan Size and Share Forecast Outlook 2025 to 2035
Japan Women’s Intimate Care Market Trends – Growth & Forecast 2024-2034
Western Europe Men’s Skincare Market Analysis – Forecast 2023-2033
Demand and Trend Analysis of Fabric Stain Remover in Korea Size and Share Forecast Outlook 2025 to 2035
Demand and Sales Analysis of Paper Cup in Japan Size and Share Forecast Outlook 2025 to 2035
Demand and Sales Analysis of Paper Cup in Korea Size and Share Forecast Outlook 2025 to 2035
Demand and Sales Analysis of Paper Cup in Western Europe Size and Share Forecast Outlook 2025 to 2035
Demand of MFGM-enriched Powders & RTDs in European Union Size and Share Forecast Outlook 2025 to 2035

Thank you!
You will receive an email from our Business Development Manager. Please be sure to check your SPAM/JUNK folder too.
Chat With
MaRIA