Mineral Insulated Cables Market Size, Share, and Forecast Outlook 2025 to 2035

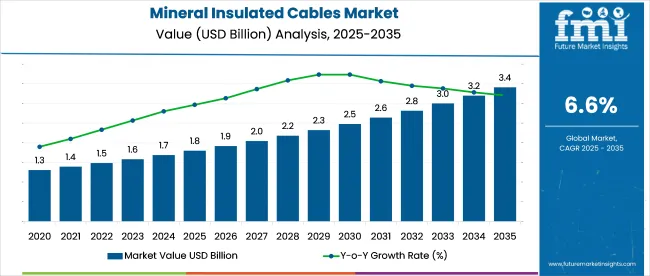
The mineral insulated cables market is expected to grow from USD 1.8 billion in 2025 to USD 3.4 billion by 2035, registering a CAGR of 6.6%. From 2020 to 2024, the market was driven by rising fire-safety codes and infrastructure upgrades in industrial facilities.
Quick Stats in Mineral Insulated Cables Market

  • Market Size (2025): USD 1.8 billion
  • Market Forecast (2035): USD 3.4 billion
  • CAGR (2025 to 2035): 6.6%
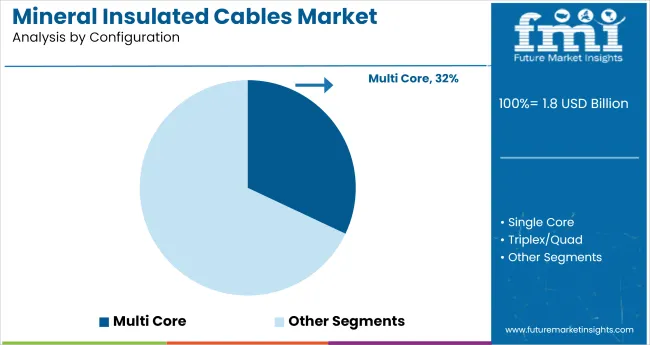
  • Top Configuration Segment: Multi Core (32% share in 2025)
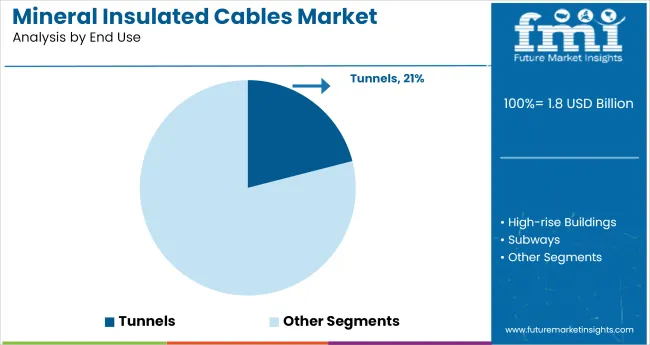
  • Leading End Use Segment: Tunnels (21% share in 2025)
  • Top Growing Country: India (7.5% CAGR)

Mineral Insulated Cables Market

Attribute Detail
Market Size (2025) USD 1.8 billion
Market Size (2035) USD 3.4 billion
CAGR (2025 to 2035) 6.6%

In 2023 alone, over 41% of newly constructed oil & gas processing units in the Middle East adopted MI wiring for zone-1 and zone-2 classified areas. In the UK, MI cable installations in rail tunnels grew by 12.5% YoY due to Transport for London's compliance retrofits.

By 2025, over 52% of demand is expected to come from high-temperature and fire-critical applications in energy, transportation, and heavy manufacturing sectors. Adoption is highest in the EU, where EN 60702-compliant cables are mandated for many critical infrastructure projects. In India and Southeast Asia, market penetration remains below 35% in commercial buildings due to cost constraints, though that figure is projected to reach 50% by 2030.

Growth through 2035 will be supported by USD 300+ billion global investments in grid modernization and clean energy infrastructure, where MI cables are preferred for durability and fire survival.

The mineral insulated cables market plays a specialized role across several industrial and infrastructure sectors. In the USD 200 billion global industrial cables industry, mineral insulated (MI) cables represent 2-3%, driven by demand for heat resistance and high-reliability performance. Within the USD 10 billion fire-resistant cables market, MI cables hold 12-15% share due to their unmatched fireproofing and longevity.

The power transmission and distribution segment, valued at over USD 300 billion, sees around 3-4% adoption for MI cables, particularly in mission-critical energy infrastructure. In the oil and gas cabling segment, roughly 7-9% is allocated to MI formats for explosion-proof safety. Even in the USD 50 billion building safety wiring sector, 5-6% involves mineral insulated solutions for emergency systems and temperature endurance.

Analyzing Mineral Insulated Cables Market by Top Investment Segments

The market is witnessing rising demand across fire-prone infrastructure, power-intensive industries, and high-temperature zones. Key segments such as magnesium oxide insulation, copper sheathing, and multi-core configurations are gaining traction due to their durability and thermal resistance.
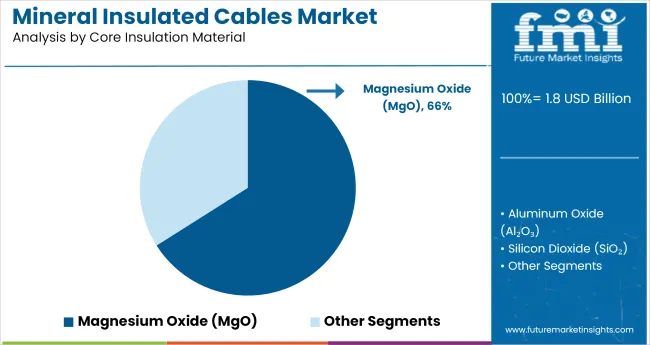
Magnesium Oxide Insulation Powers Market Leadership with 66% Share

Mineral Insulated Cables Market Analysis By Core Insulation Material

Magnesium oxide (MgO) is projected to dominate the core insulation material segment with a 66% share by 2025. Its non-combustible nature, thermal stability, and excellent dielectric strength make it ideal for fire-survivable cable designs. MgO is especially preferred in nuclear plants, airports, and tunnels.
  • High-temperature tolerance ensures continuity in emergency circuits and fire alarms.
  • Utilities and construction sectors favor MgO for its mechanical robustness and corrosion resistance.
  • Stringent safety regulations in Europe and Asia-Pacific encourage MgO-based cable installations.

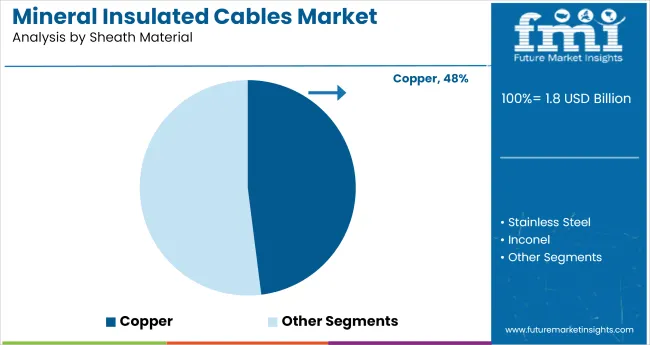
Copper Sheath Material Sets Industry Standard with 48% Share

Mineral Insulated Cables Market Analysis By Sheath Material

Copper is forecasted to hold a 48% share in the sheath material segment by 2025. Its superior conductivity, corrosion resistance, and mechanical flexibility make it the top choice for enclosing mineral insulated cables. Applications span power distribution, process industries, and infrastructure.
  • Installers prefer copper sheaths for ease of bending and long-term durability.
  • High electrical efficiency supports performance under elevated load conditions.
  • Urban retrofitting projects and metro systems are fueling large-scale copper sheath deployments.

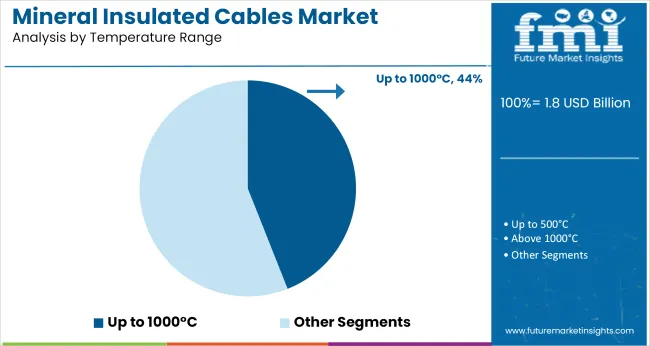
Up to 1000°C Temperature Range Gains Ground with 44% Share

Mineral Insulated Cables Market Analysis By Temperature Range

Cables rated for up to 1000°C are expected to account for 44% of the market by 2025. These cables are widely deployed in fire-resistant wiring systems, refractory environments, and emergency circuits. The segment benefits from increasing focus on high-heat safety compliance.
  • Heat endurance is essential for wiring inside furnaces, reactors, and tunnels.
  • Fire safety codes in public infrastructure boost demand for 1000°C-rated solutions.
  • Industrial OEMs favor high-temperature cables to meet plant-wide thermal resilience standards.

Multi-Core Configuration Expands Adoption with 32% Market Share

Mineral Insulated Cables Market Analysis By Configuration

Multi-core mineral insulated cables are set to secure 32% of the total market share by 2025. Their compact layout and capacity to transmit multiple circuits in one cable make them ideal for complex installations. Growth is driven by applications in airports, refineries, and energy facilities.
  • Bundled cores reduce space usage and streamline installation in confined areas.
  • Maintenance crews appreciate multi-core formats for simplified wiring diagnostics.
  • High adoption in smart buildings and BMS (building management systems) is accelerating growth.

Tunnels Remain High-Priority End Use with 21% Share

Mineral Insulated Cables Market Analysis By End Use

Tunnels are forecast to hold a 21% share in end-use applications by 2025. Due to the enclosed and fire-sensitive environment, mineral insulated cables offer unparalleled safety and reliability. Governments and city planners continue investing in tunnel upgrades worldwide.

  • Fire-rated cables ensure uninterrupted lighting, alarms, and ventilation during emergencies.
  • Rapid urbanization and metro rail expansion drive tunnel-specific cable installations.
  • European standards mandate use of MI cables in underground transport systems.

Top Mineral Insulated Cables Market Dynamics

Adoption of mineral insulated (MI) cables is rising in mission-critical environments due to unmatched fire resistance and thermal endurance. Demand is growing across nuclear, transportation, and oil & gas sectors. Supply-side shifts are favoring compact cable variants with faster pull-through installation and longer lifespan in corrosive and high-temperature zones.

Fire-Rated Infrastructure Fuels Rapid Deployment

Installations of MI cables in fire-critical projects rose 38% YoY as regulators tightened standards for emergency circuits and life-safety systems. Tunnels and high-rises adopting 950°C-rated cables reported a 41% drop in fire damage to critical power lines during tests. Contractors reduced conduit and insulation costs by 23% using compact MI variants that eliminated the need for secondary cladding.

Installation times dropped by 27% due to pre-terminated assemblies with sealed gland fittings. Municipal transport systems in Europe and Asia-Pacific led adoption, particularly in metro lines and airport hubs where uninterrupted power supply is mandated for evacuation protocols. These deployments now drive over 55% of new MI cable demand.

Oil & Gas Sector Demands Corrosion-Proof Performance

MI cable usage in offshore rigs and refineries grew 32% in 2025, with installations shifting toward stainless steel and Inconel sheathed variants. Facilities operating above 500°C reported a 19% increase in cable longevity when using high-nickel MI cables. Cathodic failure incidents dropped by 24% in coastal plants after transitioning from polymer to mineral insulation.

Lead time for corrosion-resistant custom assemblies improved by 21% as vendors streamlined batch production. Operators prioritized MI cables for RTD sensor loops and fire suppression circuits, citing their zero smoke emission and non-aging properties under thermal cycling. These specifications are reshaping procurement preferences in hazardous-zone cabling.
Top Countries Engineering, Certifying, Supplying, and Deploying Mineral Insulated Cables

Country Wise Analysis Of Mineral Insulated Cables

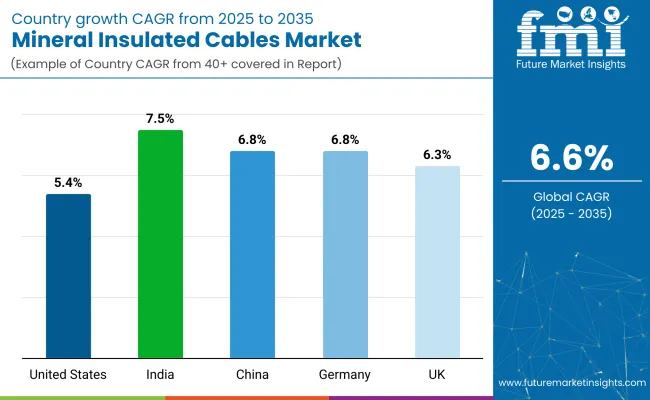
Countries CAGR (2025 to 2035)
India 7.5%
China 6.8%
Germany 6.8%
United Kingdom 6.3%
United States 5.4%

The global market is anticipated to expand at a CAGR of 6.6% from 2025 to 2035. India leads among the five profiled nations with a growth rate of 7.5%, exceeding the global benchmark by nearly 14%, supported by grid modernization and fire-resistant wiring demand in urban infrastructure.

China and Germany are aligned with the global trend at 6.8%, backed by industrial safety regulations and renewable energy projects that require heat-resistant cabling systems. The United Kingdom shows moderate growth at 6.3%, just below the global average, reflecting steady demand in rail and marine segments.

The United States posts the lowest CAGR at 5.4%, approximately 18% under the global rate, reflecting delayed upgrades in legacy systems and inconsistent building code enforcement across states. OECD countries are seeing mixed results, while BRICS and emerging Asian economies continue to push ahead in adoption and deployment.

The report provides insights across 40+ countries. The five below are highlighted for their strategic influence and growth trajectory.

Rising Infrastructure Safety Drives Adoption of Mineral Insulated Cables in India

India is projected to witness a CAGR of 7.5% between 2025 and 2035. From 2020 to 2024, demand was primarily centered on power generation and oil refineries. Moving forward, significant growth is expected in metro rail systems, smart grid projects, and public infrastructure that require fire-resistant cabling. Stringent fire safety codes and expanding investments in data centers are also boosting domestic uptake.

  • Over 220 industrial clusters slated for electrical safety upgrades by 2028
  • Increased preference for MICs in tunnel, airport, and high-rise developments
  • Indigenous manufacturing capacity for fireproof cables has doubled since 2022

Urban Fire Safety Upgrades Fuel Demand for MICs in China

The market in China is anticipated to grow at a CAGR of 6.8% through 2035. Between 2020 and 2024, growth was led by utility-scale projects and transportation tunnels. In the next phase, retrofitting initiatives in dense urban centers, coupled with enhanced enforcement of national building fire codes, are driving demand. Mineral insulated cables are being increasingly mandated in chemical plants, substations, and nuclear installations.

  • Nationwide rollout of Class A fire-rated cable mandates by 2026
  • MICs now specified in 80% of new metro and rail tunnel projects
  • Over 70 local manufacturers now certified under GB/T fire cable standards

Germany Enhances Industrial Resilience with Mineral Cable Systems

Germany is forecast to expand at a CAGR of 6.8% from 2025 to 2035. During 2020 to 2024, demand was steady across chemical processing zones and utility-scale energy grids. Looking ahead, MICs are gaining preference for automation systems, renewable energy infrastructure, and mission-critical data networks requiring low smoke and zero halogen performance.

  • New carbon-neutral factories are mandating mineral insulated wiring
  • Over 45% of offshore wind projects in development include MIC specifications
  • State-level procurement incentives support fireproof cabling in public transport

UK Sees Expanded Compliance for Mineral Insulated Wiring in Public Facilities

The United Kingdom is projected to grow at a CAGR of 6.3% during the forecast period. From 2020 to 2024, installations were mostly in legacy buildings and defense infrastructure. Since 2025, demand has risen sharply in healthcare, rail transport, and data centers, supported by revised BS 8434 standards and heightened compliance audits.

  • NHS facility upgrades prioritize MICs for critical systems
  • Over 60% of new-build schools now adopt fire-resistant cabling systems
  • London Underground refurbishment mandates fire-survivable wiring for stations

United States Embraces MICs for Resilient Energy and Transportation Networks

The US market is expected to register a CAGR of 5.4% from 2025 to 2035. Between 2020 and 2024, adoption was focused on military bases, nuclear energy, and industrial warehouses. The shift toward grid modernization, electric vehicle infrastructure, and energy resilience initiatives is expanding the scope of mineral insulated cable deployment.
  • US DOE programs promoting MIC use in grid-hardening initiatives
  • MICs increasingly favored in battery storage and EV charging stations
  • Federal mandates now require fire-rated cables in all new federal buildings

Leading Mineral Insulated Cables Suppliers

Mineral Insulated Cables Market Analysis By Company

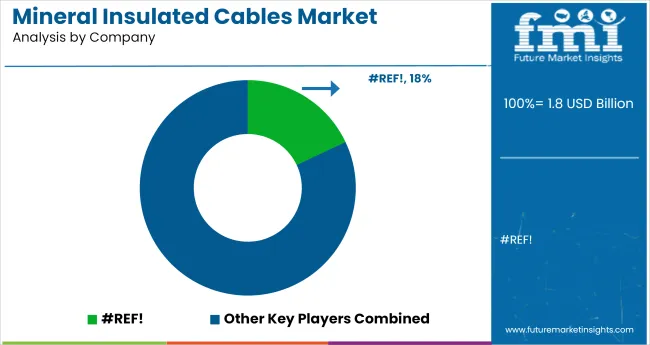
The mineral insulated cables market is moderately consolidated, led by vertically integrated manufacturers with strong footholds in high-temperature and hazardous applications. nVent holds a dominant position with over 18% market share, supported by its Raychem-branded MI cables used across industrial heating and fire protection systems. Thermon follows with significant traction in process heating applications, particularly in petrochemical and refinery operations.

Tempsens Instruments has expanded rapidly in Asia and the Middle East, offering customizable MI cables for power, thermocouple, and RTD applications. Okazaki Manufacturing and Yamari Industries remain key players in Japan, supplying precision thermocouple cables for nuclear and aerospace industries.

MI Cable Technologies Inc. and KME Germany GmbH focus on corrosion-resistant sheath materials and high-integrity cable designs tailored for offshore and subsea infrastructure. Growth is driven by increasing demand for fire-survivable wiring in tunnels, metros, and mission-critical facilities.

Recent Mineral Insulated Cables Industry News

In April 2024, Prysmian Group completed the USD 4.2 billion acquisition of Encore Wire, strengthening its presence in the North American market. The deal expanded Prysmian’s portfolio of mineral-insulated and infrastructure cables, enabling it to meet rising demand in the USA construction and energy sectors with localized, high-margin manufacturing capabilities.

Leading Players in Mineral Insulated Cables Market

  • nVent
  • Thermon
  • Tempsens Instruments
  • MI Cable Technologies Inc.
  • KME Germany GmbH
  • Okazaki Manufacturing Company
  • Yamari Industries Limited

Report Coverage and Scope Summary

Report Attributes Details
Market Size (2025) USD 1.8 billion
Projected Market Size (2035) USD 3.4 billion
CAGR (2025 to 2035) 6.6%
Base Year for Estimation 2024
Historical Period 2020 to 2024
Projections Period 2025 to 2035
Quantitative Units USD billion for market value
Core Insulation Materials Analyzed (Segment 1) Magnesium Oxide, Aluminum Oxide, Silicon Dioxide
Sheath Materials Analyzed (Segment 2) Copper, Stainless Steel, Inconel, Other Alloys
Temperature Ranges Analyzed (Segment 3) Up to 500°C, Up to 1000°C, Above 1000°C
Configurations Analyzed (Segment 4) Single Core, Multi-Core, Triplex/Quad
End Uses Analyzed (Segment 5) High-Rise Buildings, Subways, Tunnels, Airports, Healthcare Facilities, Oil & Gas, Power, Nuclear Facilities, Other Industrial Settings
Regions Covered North America, Latin America, Western Europe, Eastern Europe, East Asia, South Asia & Pacific, Middle East & Africa
Countries Covered United States, Canada, Germany, United Kingdom, France, Italy, Spain, China, India, Japan, South Korea, Australia, Brazil, Mexico, Argentina, Saudi Arabia, UAE, South Africa
Key Players nVent, Thermon, Tempsens Instruments, MI Cable Technologies Inc., KME Germany GmbH, Okazaki Manufacturing Company, Yamari Industries Limited
Additional Attributes Dollar sales by core and sheath material, rising demand in fire-critical infrastructure, growing use in harsh industrial zones, and long-term reliability driving adoption in nuclear and oil & gas sectors.

Key Segments

By Core Insulation Material:

Segmented into magnesium oxide, aluminum oxide, and silicon dioxide, each selected for superior thermal and electrical insulation under extreme conditions.

By Sheath Material:

Includes copper, stainless steel, Inconel, and other alloys, offering varied mechanical strength and corrosion resistance based on application needs.

By Temperature Range:

Divided into up to 500°C, up to 1000°C, and above 1000°C, depending on the cable’s thermal endurance in high-heat environments.

By Configuration:

Covers single-core, multi-core, and triplex/quad variants, tailored for different power transmission or instrumentation requirements.

By End Use:

Applications span high-rise buildings, subways, tunnels, airports, healthcare facilities, oil & gas, power, nuclear facilities, and other industrial settings.

By Region:

Regional analysis includes North America, Latin America, Western Europe, Eastern Europe, East Asia, South Asia & Pacific, and Middle East & Africa.

Table of Content

  1. Executive Summary
    • Global Market Outlook
    • Demand-side Trends
    • Supply-side Trends
    • Technology Roadmap Analysis
    • Analysis and Recommendations
  2. Market Overview
    • Market Coverage/Taxonomy
    • Market Definition/Scope/Limitations
  3. Market Background
    • Market Dynamics
      • Drivers
      • Restraints
      • Opportunity
      • Trends
    • Scenario Forecast
      • Demand in Optimistic Scenario
      • Demand in Likely Scenario
      • Demand in Conservative Scenario
    • Opportunity Map Analysis
    • Product Life Cycle Analysis
    • Supply Chain Analysis
      • Supply Side Participants and their Roles
        • Producers
        • Mid-Level Participants (Traders/ Agents/ Brokers)
        • Wholesalers and Distributors
      • Value Added and Value Created at Node in the Supply Chain
      • List of Raw Material Suppliers
      • List of Existing and Potential Buyer’s
    • Investment Feasibility Matrix
    • Value Chain Analysis
      • Profit Margin Analysis
      • Wholesalers and Distributors
      • Retailers
    • PESTLE and Porter’s Analysis
    • Regulatory Landscape
      • By Key Regions
      • By Key Countries
    • Regional Parent Market Outlook
    • Production and Consumption Statistics
    • Import and Export Statistics
  4. Global Market Analysis 2020 to 2024 and Forecast, 2025 to 2035
    • Historical Market Size Value (USD Billion) & Volume (MT) Analysis, 2020 to 2024
    • Current and Future Market Size Value (USD Billion) & Volume (MT) Projections, 2025 to 2035
      • Y-o-Y Growth Trend Analysis
      • Absolute $ Opportunity Analysis
  5. Global Market Pricing Analysis 2020 to 2024 and Forecast 2025 to 2035
  6. Global Market Analysis 2020 to 2024 and Forecast 2025 to 2035, By Core Insulation Material
    • Introduction/Key Findings
    • Historical Market Size Value (USD Billion) & Volume (MT) Analysis By Core Insulation Material, 2020 to 2024
    • Current and Future Market Size Value (USD Billion) & Volume (MT) Analysis and Forecast By Core Insulation Material, 2025 to 2035
      • Magnesium Oxide (MgO)
      • Aluminum Oxide (Al₂O₃)
      • Silicon Dioxide (SiO₂)
    • Y-o-Y Growth Trend Analysis By Core Insulation Material, 2020 to 2024
    • Absolute $ Opportunity Analysis By Core Insulation Material, 2025 to 2035
  7. Global Market Analysis 2020 to 2024 and Forecast 2025 to 2035, By Sheath Material
    • Introduction/Key Findings
    • Historical Market Size Value (USD Billion) & Volume (MT) Analysis By Sheath Material, 2020 to 2024
    • Current and Future Market Size Value (USD Billion) & Volume (MT) Analysis and Forecast By Sheath Material, 2025 to 2035
      • Copper
      • Stainless Steel
      • Inconel
      • Other Alloys
    • Y-o-Y Growth Trend Analysis By Sheath Material, 2020 to 2024
    • Absolute $ Opportunity Analysis By Sheath Material, 2025 to 2035
  8. Global Market Analysis 2020 to 2024 and Forecast 2025 to 2035, By Temperature Range
    • Introduction/Key Findings
    • Historical Market Size Value (USD Billion) & Volume (MT) Analysis By Temperature Range, 2020 to 2024
    • Current and Future Market Size Value (USD Billion) & Volume (MT) Analysis and Forecast By Temperature Range, 2025 to 2035
      • Up to 500°C
      • Up to 1000°C
      • Above 1000°C
    • Y-o-Y Growth Trend Analysis By Temperature Range, 2020 to 2024
    • Absolute $ Opportunity Analysis By Temperature Range, 2025 to 2035
  9. Global Market Analysis 2020 to 2024 and Forecast 2025 to 2035, By Configuration
    • Introduction/Key Findings
    • Historical Market Size Value (USD Billion) & Volume (MT) Analysis By Configuration, 2020 to 2024
    • Current and Future Market Size Value (USD Billion) & Volume (MT) Analysis and Forecast By Configuration, 2025 to 2035
      • Single Core
      • Multi Core
      • Triplex/Quad
    • Y-o-Y Growth Trend Analysis By Configuration, 2020 to 2024
    • Absolute $ Opportunity Analysis By Configuration, 2025 to 2035
  10. Global Market Analysis 2020 to 2024 and Forecast 2025 to 2035, By End Use
    • Introduction/Key Findings
    • Historical Market Size Value (USD Billion) & Volume (MT) Analysis By End Use, 2020 to 2024
    • Current and Future Market Size Value (USD Billion) & Volume (MT) Analysis and Forecast By End Use, 2025 to 2035
      • High-rise Buildings
      • Subways
      • Tunnels
      • Airports
      • Healthcare facilities
      • Oil & Gas
      • Power Industry
      • Nuclear Facilities
      • Other Industrial
    • Y-o-Y Growth Trend Analysis By End Use, 2020 to 2024
    • Absolute $ Opportunity Analysis By End Use, 2025 to 2035
  11. Global Market Analysis 2020 to 2024 and Forecast 2025 to 2035, By Region
    • Introduction
    • Historical Market Size Value (USD Billion) & Volume (MT) Analysis By Region, 2020 to 2024
    • Current Market Size Value (USD Billion) & Volume (MT) Analysis and Forecast By Region, 2025 to 2035
      • North America
      • Latin America
      • Western Europe
      • Eastern Europe
      • East Asia
      • South Asia & Pacific
      • Middle East and Africa
    • Market Attractiveness Analysis By Region
  12. North America Market Analysis 2020 to 2024 and Forecast 2025 to 2035, By Country
    • Historical Market Size Value (USD Billion) & Volume (MT) Trend Analysis By Market Taxonomy, 2020 to 2024
    • Market Size Value (USD Billion) & Volume (MT) Forecast By Market Taxonomy, 2025 to 2035
      • By Country
        • USa
        • Canada
        • Mexico
      • By Core Insulation Material
      • By Sheath Material
      • By Temperature Range
      • By Configuration
      • By End Use
    • Market Attractiveness Analysis
      • By Country
      • By Core Insulation Material
      • By Sheath Material
      • By Temperature Range
      • By Configuration
      • By End Use
    • Key Takeaways
  13. Latin America Market Analysis 2020 to 2024 and Forecast 2025 to 2035, By Country
    • Historical Market Size Value (USD Billion) & Volume (MT) Trend Analysis By Market Taxonomy, 2020 to 2024
    • Market Size Value (USD Billion) & Volume (MT) Forecast By Market Taxonomy, 2025 to 2035
      • By Country
        • Brazil
        • Argentina
        • Rest of LATAM
      • By Core Insulation Material
      • By Sheath Material
      • By Temperature Range
      • By Configuration
      • By End Use
    • Market Attractiveness Analysis
      • By Country
      • By Core Insulation Material
      • By Sheath Material
      • By Temperature Range
      • By Configuration
      • By End Use
    • Key Takeaways
  14. Western Europe Market Analysis 2020 to 2024 and Forecast 2025 to 2035, By Country
    • Historical Market Size Value (USD Billion) & Volume (MT) Trend Analysis By Market Taxonomy, 2020 to 2024
    • Market Size Value (USD Billion) & Volume (MT) Forecast By Market Taxonomy, 2025 to 2035
      • By Country
        • Germany
        • Italy
        • France
        • UK
        • Spain
        • BENELUX
        • Nordic
        • Rest of W.Europe
      • By Core Insulation Material
      • By Sheath Material
      • By Temperature Range
      • By Configuration
      • By End Use
    • Market Attractiveness Analysis
      • By Country
      • By Core Insulation Material
      • By Sheath Material
      • By Temperature Range
      • By Configuration
      • By End Use
    • Key Takeaways
  15. Eastern Europe Market Analysis 2020 to 2024 and Forecast 2025 to 2035, By Country
    • Historical Market Size Value (USD Billion) & Volume (MT) Trend Analysis By Market Taxonomy, 2020 to 2024
    • Market Size Value (USD Billion) & Volume (MT) Forecast By Market Taxonomy, 2025 to 2035
      • By Country
        • Russia
        • Hungary
        • Poland
        • Balkan & Baltics
        • Rest of E. Europe
      • By Core Insulation Material
      • By Sheath Material
      • By Temperature Range
      • By Configuration
      • By End Use
    • Market Attractiveness Analysis
      • By Country
      • By Core Insulation Material
      • By Sheath Material
      • By Temperature Range
      • By Configuration
      • By End Use
    • Key Takeaways
  16. East Asia Market Analysis 2020 to 2024 and Forecast 2025 to 2035, By Country
    • Historical Market Size Value (USD Billion) & Volume (MT) Trend Analysis By Market Taxonomy, 2020 to 2024
    • Market Size Value (USD Billion) & Volume (MT) Forecast By Market Taxonomy, 2025 to 2035
      • By Country
        • China
        • Japan
        • South Korea
      • By Core Insulation Material
      • By Sheath Material
      • By Temperature Range
      • By Configuration
      • By End Use
    • Market Attractiveness Analysis
      • By Country
      • By Core Insulation Material
      • By Sheath Material
      • By Temperature Range
      • By Configuration
      • By End Use
    • Key Takeaways
  17. South Asia & Pacific Market Analysis 2020 to 2024 and Forecast 2025 to 2035, By Country
    • Historical Market Size Value (USD Billion) & Volume (MT) Trend Analysis By Market Taxonomy, 2020 to 2024
    • Market Size Value (USD Billion) & Volume (MT) Forecast By Market Taxonomy, 2025 to 2035
      • By Country
        • India
        • Australia & New Zealand
        • ASEAN
        • Rest of SAP
      • By Core Insulation Material
      • By Sheath Material
      • By Temperature Range
      • By Configuration
      • By End Use
    • Market Attractiveness Analysis
      • By Country
      • By Core Insulation Material
      • By Sheath Material
      • By Temperature Range
      • By Configuration
      • By End Use
    • Key Takeaways
  18. Middle East and Africa Market Analysis 2020 to 2024 and Forecast 2025 to 2035, By Country
    • Historical Market Size Value (USD Billion) & Volume (MT) Trend Analysis By Market Taxonomy, 2020 to 2024
    • Market Size Value (USD Billion) & Volume (MT) Forecast By Market Taxonomy, 2025 to 2035
      • By Country
        • GCC Countries
        • Northern Africa
        • South Africa
        • Turkiye
        • Rest of MEA
      • By Core Insulation Material
      • By Sheath Material
      • By Temperature Range
      • By Configuration
      • By End Use
    • Market Attractiveness Analysis
      • By Country
      • By Core Insulation Material
      • By Sheath Material
      • By Temperature Range
      • By Configuration
      • By End Use
    • Key Takeaways
  19. Key Countries Market Analysis
    • USA
      • Pricing Analysis
      • Market Share Analysis, 2024
        • By Core Insulation Material
        • By Sheath Material
        • By Temperature Range
        • By Configuration
        • By End Use
    • Canada
      • Pricing Analysis
      • Market Share Analysis, 2024
        • By Core Insulation Material
        • By Sheath Material
        • By Temperature Range
        • By Configuration
        • By End Use
    • Brazil
      • Pricing Analysis
      • Market Share Analysis, 2024
        • By Core Insulation Material
        • By Sheath Material
        • By Temperature Range
        • By Configuration
        • By End Use
    • Mexico
      • Pricing Analysis
      • Market Share Analysis, 2024
        • By Core Insulation Material
        • By Sheath Material
        • By Temperature Range
        • By Configuration
        • By End Use
    • Argentina
      • Pricing Analysis
      • Market Share Analysis, 2024
        • By Core Insulation Material
        • By Sheath Material
        • By Temperature Range
        • By Configuration
        • By End Use
  20. Market Structure Analysis
    • Competition Dashboard
    • Competition Benchmarking
    • Market Share Analysis of Top Players
      • By Regional
      • By Core Insulation Material
      • By Sheath Material
      • By Temperature Range
      • By Configuration
      • By End Use
  21. Competition Analysis
    • Competition Deep Dive
      • nVent
        • Overview
        • Product Portfolio
        • Profitability by Market Segments (Product/Age /Sales Channel/Region)
        • Sales Footprint
        • Strategy Overview
          • Marketing Strategy
          • Product Strategy
          • Channel Strategy
      • Thermon
        • Overview
        • Product Portfolio
        • Profitability by Market Segments (Product/Age /Sales Channel/Region)
        • Sales Footprint
        • Strategy Overview
          • Marketing Strategy
          • Product Strategy
          • Channel Strategy
      • Tempsens Instruments
        • Overview
        • Product Portfolio
        • Profitability by Market Segments (Product/Age /Sales Channel/Region)
        • Sales Footprint
        • Strategy Overview
          • Marketing Strategy
          • Product Strategy
          • Channel Strategy
      • MI Cable Technologies Inc.
        • Overview
        • Product Portfolio
        • Profitability by Market Segments (Product/Age /Sales Channel/Region)
        • Sales Footprint
        • Strategy Overview
          • Marketing Strategy
          • Product Strategy
          • Channel Strategy
      • KME Germany GmbH
        • Overview
        • Product Portfolio
        • Profitability by Market Segments (Product/Age /Sales Channel/Region)
        • Sales Footprint
        • Strategy Overview
          • Marketing Strategy
          • Product Strategy
          • Channel Strategy
      • Okazaki Manufacturing Company
        • Overview
        • Product Portfolio
        • Profitability by Market Segments (Product/Age /Sales Channel/Region)
        • Sales Footprint
        • Strategy Overview
          • Marketing Strategy
          • Product Strategy
          • Channel Strategy
      • Yamari Industries Limited
        • Overview
        • Product Portfolio
        • Profitability by Market Segments (Product/Age /Sales Channel/Region)
        • Sales Footprint
        • Strategy Overview
          • Marketing Strategy
          • Product Strategy
          • Channel Strategy
  22. Assumptions & Acronyms Used
  23. Research Methodology

List of Tables

  • Table 1: Global Market Value (USD Billion) Forecast by Region, 2020-2035
  • Table 2: Global Market Volume (MT) Forecast by Region, 2020-2035
  • Table 3: Global Market Value (USD Billion) Forecast by Core Insulation Material, 2020-2035
  • Table 4: Global Market Volume (MT) Forecast by Core Insulation Material, 2020-2035
  • Table 5: Global Market Value (USD Billion) Forecast by Sheath Material, 2020-2035
  • Table 6: Global Market Volume (MT) Forecast by Sheath Material, 2020-2035
  • Table 7: Global Market Value (USD Billion) Forecast by Temperature Range, 2020-2035
  • Table 8: Global Market Volume (MT) Forecast by Temperature Range, 2020-2035
  • Table 9: Global Market Value (USD Billion) Forecast by Configuration, 2020-2035
  • Table 10: Global Market Volume (MT) Forecast by Configuration, 2020-2035
  • Table 11: Global Market Value (USD Billion) Forecast by End Use, 2020-2035
  • Table 12: Global Market Volume (MT) Forecast by End Use, 2020-2035
  • Table 13: North America Market Value (USD Billion) Forecast by Country, 2020-2035
  • Table 14: North America Market Volume (MT) Forecast by Country, 2020-2035
  • Table 15: North America Market Value (USD Billion) Forecast by Core Insulation Material, 2020-2035
  • Table 16: North America Market Volume (MT) Forecast by Core Insulation Material, 2020-2035
  • Table 17: North America Market Value (USD Billion) Forecast by Sheath Material, 2020-2035
  • Table 18: North America Market Volume (MT) Forecast by Sheath Material, 2020-2035
  • Table 19: North America Market Value (USD Billion) Forecast by Temperature Range, 2020-2035
  • Table 20: North America Market Volume (MT) Forecast by Temperature Range, 2020-2035
  • Table 21: North America Market Value (USD Billion) Forecast by Configuration, 2020-2035
  • Table 22: North America Market Volume (MT) Forecast by Configuration, 2020-2035
  • Table 23: North America Market Value (USD Billion) Forecast by End Use, 2020-2035
  • Table 24: North America Market Volume (MT) Forecast by End Use, 2020-2035
  • Table 25: Latin America Market Value (USD Billion) Forecast by Country, 2020-2035
  • Table 26: Latin America Market Volume (MT) Forecast by Country, 2020-2035
  • Table 27: Latin America Market Value (USD Billion) Forecast by Core Insulation Material, 2020-2035
  • Table 28: Latin America Market Volume (MT) Forecast by Core Insulation Material, 2020-2035
  • Table 29: Latin America Market Value (USD Billion) Forecast by Sheath Material, 2020-2035
  • Table 30: Latin America Market Volume (MT) Forecast by Sheath Material, 2020-2035
  • Table 31: Latin America Market Value (USD Billion) Forecast by Temperature Range, 2020-2035
  • Table 32: Latin America Market Volume (MT) Forecast by Temperature Range, 2020-2035
  • Table 33: Latin America Market Value (USD Billion) Forecast by Configuration, 2020-2035
  • Table 34: Latin America Market Volume (MT) Forecast by Configuration, 2020-2035
  • Table 35: Latin America Market Value (USD Billion) Forecast by End Use, 2020-2035
  • Table 36: Latin America Market Volume (MT) Forecast by End Use, 2020-2035
  • Table 37: Western Europe Market Value (USD Billion) Forecast by Country, 2020-2035
  • Table 38: Western Europe Market Volume (MT) Forecast by Country, 2020-2035
  • Table 39: Western Europe Market Value (USD Billion) Forecast by Core Insulation Material, 2020-2035
  • Table 40: Western Europe Market Volume (MT) Forecast by Core Insulation Material, 2020-2035
  • Table 41: Western Europe Market Value (USD Billion) Forecast by Sheath Material, 2020-2035
  • Table 42: Western Europe Market Volume (MT) Forecast by Sheath Material, 2020-2035
  • Table 43: Western Europe Market Value (USD Billion) Forecast by Temperature Range, 2020-2035
  • Table 44: Western Europe Market Volume (MT) Forecast by Temperature Range, 2020-2035
  • Table 45: Western Europe Market Value (USD Billion) Forecast by Configuration, 2020-2035
  • Table 46: Western Europe Market Volume (MT) Forecast by Configuration, 2020-2035
  • Table 47: Western Europe Market Value (USD Billion) Forecast by End Use, 2020-2035
  • Table 48: Western Europe Market Volume (MT) Forecast by End Use, 2020-2035
  • Table 49: Eastern Europe Market Value (USD Billion) Forecast by Country, 2020-2035
  • Table 50: Eastern Europe Market Volume (MT) Forecast by Country, 2020-2035
  • Table 51: Eastern Europe Market Value (USD Billion) Forecast by Core Insulation Material, 2020-2035
  • Table 52: Eastern Europe Market Volume (MT) Forecast by Core Insulation Material, 2020-2035
  • Table 53: Eastern Europe Market Value (USD Billion) Forecast by Sheath Material, 2020-2035
  • Table 54: Eastern Europe Market Volume (MT) Forecast by Sheath Material, 2020-2035
  • Table 55: Eastern Europe Market Value (USD Billion) Forecast by Temperature Range, 2020-2035
  • Table 56: Eastern Europe Market Volume (MT) Forecast by Temperature Range, 2020-2035
  • Table 57: Eastern Europe Market Value (USD Billion) Forecast by Configuration, 2020-2035
  • Table 58: Eastern Europe Market Volume (MT) Forecast by Configuration, 2020-2035
  • Table 59: Eastern Europe Market Value (USD Billion) Forecast by End Use, 2020-2035
  • Table 60: Eastern Europe Market Volume (MT) Forecast by End Use, 2020-2035
  • Table 61: East Asia Market Value (USD Billion) Forecast by Country, 2020-2035
  • Table 62: East Asia Market Volume (MT) Forecast by Country, 2020-2035
  • Table 63: East Asia Market Value (USD Billion) Forecast by Core Insulation Material, 2020-2035
  • Table 64: East Asia Market Volume (MT) Forecast by Core Insulation Material, 2020-2035
  • Table 65: East Asia Market Value (USD Billion) Forecast by Sheath Material, 2020-2035
  • Table 66: East Asia Market Volume (MT) Forecast by Sheath Material, 2020-2035
  • Table 67: East Asia Market Value (USD Billion) Forecast by Temperature Range, 2020-2035
  • Table 68: East Asia Market Volume (MT) Forecast by Temperature Range, 2020-2035
  • Table 69: East Asia Market Value (USD Billion) Forecast by Configuration, 2020-2035
  • Table 70: East Asia Market Volume (MT) Forecast by Configuration, 2020-2035
  • Table 71: East Asia Market Value (USD Billion) Forecast by End Use, 2020-2035
  • Table 72: East Asia Market Volume (MT) Forecast by End Use, 2020-2035
  • Table 73: South Asia & Pacific Market Value (USD Billion) Forecast by Country, 2020-2035
  • Table 74: South Asia & Pacific Market Volume (MT) Forecast by Country, 2020-2035
  • Table 75: South Asia & Pacific Market Value (USD Billion) Forecast by Core Insulation Material, 2020-2035
  • Table 76: South Asia & Pacific Market Volume (MT) Forecast by Core Insulation Material, 2020-2035
  • Table 77: South Asia & Pacific Market Value (USD Billion) Forecast by Sheath Material, 2020-2035
  • Table 78: South Asia & Pacific Market Volume (MT) Forecast by Sheath Material, 2020-2035
  • Table 79: South Asia & Pacific Market Value (USD Billion) Forecast by Temperature Range, 2020-2035
  • Table 80: South Asia & Pacific Market Volume (MT) Forecast by Temperature Range, 2020-2035
  • Table 81: South Asia & Pacific Market Value (USD Billion) Forecast by Configuration, 2020-2035
  • Table 82: South Asia & Pacific Market Volume (MT) Forecast by Configuration, 2020-2035
  • Table 83: South Asia & Pacific Market Value (USD Billion) Forecast by End Use, 2020-2035
  • Table 84: South Asia & Pacific Market Volume (MT) Forecast by End Use, 2020-2035
  • Table 85: Middle East and Africa Market Value (USD Billion) Forecast by Country, 2020-2035
  • Table 86: Middle East and Africa Market Volume (MT) Forecast by Country, 2020-2035
  • Table 87: Middle East and Africa Market Value (USD Billion) Forecast by Core Insulation Material, 2020-2035
  • Table 88: Middle East and Africa Market Volume (MT) Forecast by Core Insulation Material, 2020-2035
  • Table 89: Middle East and Africa Market Value (USD Billion) Forecast by Sheath Material, 2020-2035
  • Table 90: Middle East and Africa Market Volume (MT) Forecast by Sheath Material, 2020-2035
  • Table 91: Middle East and Africa Market Value (USD Billion) Forecast by Temperature Range, 2020-2035
  • Table 92: Middle East and Africa Market Volume (MT) Forecast by Temperature Range, 2020-2035
  • Table 93: Middle East and Africa Market Value (USD Billion) Forecast by Configuration, 2020-2035
  • Table 94: Middle East and Africa Market Volume (MT) Forecast by Configuration, 2020-2035
  • Table 95: Middle East and Africa Market Value (USD Billion) Forecast by End Use, 2020-2035
  • Table 96: Middle East and Africa Market Volume (MT) Forecast by End Use, 2020-2035

List of Figures

  • Figure 1: Global Market Volume (MT) Forecast 2020-2035
  • Figure 2: Global Market Pricing Analysis
  • Figure 3: Global Market Value (USD Billion) Forecast 2020-2035
  • Figure 4: Global Market Value Share and BPS Analysis by Core Insulation Material, 2025 and 2035
  • Figure 5: Global Market Y-o-Y Growth Comparison by Core Insulation Material, 2025-2035
  • Figure 6: Global Market Attractiveness Analysis by Core Insulation Material
  • Figure 7: Global Market Value Share and BPS Analysis by Sheath Material, 2025 and 2035
  • Figure 8: Global Market Y-o-Y Growth Comparison by Sheath Material, 2025-2035
  • Figure 9: Global Market Attractiveness Analysis by Sheath Material
  • Figure 10: Global Market Value Share and BPS Analysis by Temperature Range, 2025 and 2035
  • Figure 11: Global Market Y-o-Y Growth Comparison by Temperature Range, 2025-2035
  • Figure 12: Global Market Attractiveness Analysis by Temperature Range
  • Figure 13: Global Market Value Share and BPS Analysis by Configuration, 2025 and 2035
  • Figure 14: Global Market Y-o-Y Growth Comparison by Configuration, 2025-2035
  • Figure 15: Global Market Attractiveness Analysis by Configuration
  • Figure 16: Global Market Value Share and BPS Analysis by End Use, 2025 and 2035
  • Figure 17: Global Market Y-o-Y Growth Comparison by End Use, 2025-2035
  • Figure 18: Global Market Attractiveness Analysis by End Use
  • Figure 19: Global Market Value (USD Billion) Share and BPS Analysis by Region, 2025 and 2035
  • Figure 20: Global Market Y-o-Y Growth Comparison by Region, 2025-2035
  • Figure 21: Global Market Attractiveness Analysis by Region
  • Figure 22: North America Market Incremental $ Opportunity, 2025-2035
  • Figure 23: Latin America Market Incremental $ Opportunity, 2025-2035
  • Figure 24: Western Europe Market Incremental $ Opportunity, 2025-2035
  • Figure 25: Eastern Europe Market Incremental $ Opportunity, 2025-2035
  • Figure 26: East Asia Market Incremental $ Opportunity, 2025-2035
  • Figure 27: South Asia & Pacific Market Incremental $ Opportunity, 2025-2035
  • Figure 28: Middle East and Africa Market Incremental $ Opportunity, 2025-2035
  • Figure 29: North America Market Value Share and BPS Analysis by Country, 2025 and 2035
  • Figure 30: North America Market Value Share and BPS Analysis by Core Insulation Material, 2025 and 2035
  • Figure 31: North America Market Y-o-Y Growth Comparison by Core Insulation Material, 2025-2035
  • Figure 32: North America Market Attractiveness Analysis by Core Insulation Material
  • Figure 33: North America Market Value Share and BPS Analysis by Sheath Material, 2025 and 2035
  • Figure 34: North America Market Y-o-Y Growth Comparison by Sheath Material, 2025-2035
  • Figure 35: North America Market Attractiveness Analysis by Sheath Material
  • Figure 36: North America Market Value Share and BPS Analysis by Temperature Range, 2025 and 2035
  • Figure 37: North America Market Y-o-Y Growth Comparison by Temperature Range, 2025-2035
  • Figure 38: North America Market Attractiveness Analysis by Temperature Range
  • Figure 39: North America Market Value Share and BPS Analysis by Configuration, 2025 and 2035
  • Figure 40: North America Market Y-o-Y Growth Comparison by Configuration, 2025-2035
  • Figure 41: North America Market Attractiveness Analysis by Configuration
  • Figure 42: North America Market Value Share and BPS Analysis by End Use, 2025 and 2035
  • Figure 43: North America Market Y-o-Y Growth Comparison by End Use, 2025-2035
  • Figure 44: North America Market Attractiveness Analysis by End Use
  • Figure 45: Latin America Market Value Share and BPS Analysis by Country, 2025 and 2035
  • Figure 46: Latin America Market Value Share and BPS Analysis by Core Insulation Material, 2025 and 2035
  • Figure 47: Latin America Market Y-o-Y Growth Comparison by Core Insulation Material, 2025-2035
  • Figure 48: Latin America Market Attractiveness Analysis by Core Insulation Material
  • Figure 49: Latin America Market Value Share and BPS Analysis by Sheath Material, 2025 and 2035
  • Figure 50: Latin America Market Y-o-Y Growth Comparison by Sheath Material, 2025-2035
  • Figure 51: Latin America Market Attractiveness Analysis by Sheath Material
  • Figure 52: Latin America Market Value Share and BPS Analysis by Temperature Range, 2025 and 2035
  • Figure 53: Latin America Market Y-o-Y Growth Comparison by Temperature Range, 2025-2035
  • Figure 54: Latin America Market Attractiveness Analysis by Temperature Range
  • Figure 55: Latin America Market Value Share and BPS Analysis by Configuration, 2025 and 2035
  • Figure 56: Latin America Market Y-o-Y Growth Comparison by Configuration, 2025-2035
  • Figure 57: Latin America Market Attractiveness Analysis by Configuration
  • Figure 58: Latin America Market Value Share and BPS Analysis by End Use, 2025 and 2035
  • Figure 59: Latin America Market Y-o-Y Growth Comparison by End Use, 2025-2035
  • Figure 60: Latin America Market Attractiveness Analysis by End Use
  • Figure 61: Western Europe Market Value Share and BPS Analysis by Country, 2025 and 2035
  • Figure 62: Western Europe Market Value Share and BPS Analysis by Core Insulation Material, 2025 and 2035
  • Figure 63: Western Europe Market Y-o-Y Growth Comparison by Core Insulation Material, 2025-2035
  • Figure 64: Western Europe Market Attractiveness Analysis by Core Insulation Material
  • Figure 65: Western Europe Market Value Share and BPS Analysis by Sheath Material, 2025 and 2035
  • Figure 66: Western Europe Market Y-o-Y Growth Comparison by Sheath Material, 2025-2035
  • Figure 67: Western Europe Market Attractiveness Analysis by Sheath Material
  • Figure 68: Western Europe Market Value Share and BPS Analysis by Temperature Range, 2025 and 2035
  • Figure 69: Western Europe Market Y-o-Y Growth Comparison by Temperature Range, 2025-2035
  • Figure 70: Western Europe Market Attractiveness Analysis by Temperature Range
  • Figure 71: Western Europe Market Value Share and BPS Analysis by Configuration, 2025 and 2035
  • Figure 72: Western Europe Market Y-o-Y Growth Comparison by Configuration, 2025-2035
  • Figure 73: Western Europe Market Attractiveness Analysis by Configuration
  • Figure 74: Western Europe Market Value Share and BPS Analysis by End Use, 2025 and 2035
  • Figure 75: Western Europe Market Y-o-Y Growth Comparison by End Use, 2025-2035
  • Figure 76: Western Europe Market Attractiveness Analysis by End Use
  • Figure 77: Eastern Europe Market Value Share and BPS Analysis by Country, 2025 and 2035
  • Figure 78: Eastern Europe Market Value Share and BPS Analysis by Core Insulation Material, 2025 and 2035
  • Figure 79: Eastern Europe Market Y-o-Y Growth Comparison by Core Insulation Material, 2025-2035
  • Figure 80: Eastern Europe Market Attractiveness Analysis by Core Insulation Material
  • Figure 81: Eastern Europe Market Value Share and BPS Analysis by Sheath Material, 2025 and 2035
  • Figure 82: Eastern Europe Market Y-o-Y Growth Comparison by Sheath Material, 2025-2035
  • Figure 83: Eastern Europe Market Attractiveness Analysis by Sheath Material
  • Figure 84: Eastern Europe Market Value Share and BPS Analysis by Temperature Range, 2025 and 2035
  • Figure 85: Eastern Europe Market Y-o-Y Growth Comparison by Temperature Range, 2025-2035
  • Figure 86: Eastern Europe Market Attractiveness Analysis by Temperature Range
  • Figure 87: Eastern Europe Market Value Share and BPS Analysis by Configuration, 2025 and 2035
  • Figure 88: Eastern Europe Market Y-o-Y Growth Comparison by Configuration, 2025-2035
  • Figure 89: Eastern Europe Market Attractiveness Analysis by Configuration
  • Figure 90: Eastern Europe Market Value Share and BPS Analysis by End Use, 2025 and 2035
  • Figure 91: Eastern Europe Market Y-o-Y Growth Comparison by End Use, 2025-2035
  • Figure 92: Eastern Europe Market Attractiveness Analysis by End Use
  • Figure 93: East Asia Market Value Share and BPS Analysis by Country, 2025 and 2035
  • Figure 94: East Asia Market Value Share and BPS Analysis by Core Insulation Material, 2025 and 2035
  • Figure 95: East Asia Market Y-o-Y Growth Comparison by Core Insulation Material, 2025-2035
  • Figure 96: East Asia Market Attractiveness Analysis by Core Insulation Material
  • Figure 97: East Asia Market Value Share and BPS Analysis by Sheath Material, 2025 and 2035
  • Figure 98: East Asia Market Y-o-Y Growth Comparison by Sheath Material, 2025-2035
  • Figure 99: East Asia Market Attractiveness Analysis by Sheath Material
  • Figure 100: East Asia Market Value Share and BPS Analysis by Temperature Range, 2025 and 2035
  • Figure 101: East Asia Market Y-o-Y Growth Comparison by Temperature Range, 2025-2035
  • Figure 102: East Asia Market Attractiveness Analysis by Temperature Range
  • Figure 103: East Asia Market Value Share and BPS Analysis by Configuration, 2025 and 2035
  • Figure 104: East Asia Market Y-o-Y Growth Comparison by Configuration, 2025-2035
  • Figure 105: East Asia Market Attractiveness Analysis by Configuration
  • Figure 106: East Asia Market Value Share and BPS Analysis by End Use, 2025 and 2035
  • Figure 107: East Asia Market Y-o-Y Growth Comparison by End Use, 2025-2035
  • Figure 108: East Asia Market Attractiveness Analysis by End Use
  • Figure 109: South Asia & Pacific Market Value Share and BPS Analysis by Country, 2025 and 2035
  • Figure 110: South Asia & Pacific Market Value Share and BPS Analysis by Core Insulation Material, 2025 and 2035
  • Figure 111: South Asia & Pacific Market Y-o-Y Growth Comparison by Core Insulation Material, 2025-2035
  • Figure 112: South Asia & Pacific Market Attractiveness Analysis by Core Insulation Material
  • Figure 113: South Asia & Pacific Market Value Share and BPS Analysis by Sheath Material, 2025 and 2035
  • Figure 114: South Asia & Pacific Market Y-o-Y Growth Comparison by Sheath Material, 2025-2035
  • Figure 115: South Asia & Pacific Market Attractiveness Analysis by Sheath Material
  • Figure 116: South Asia & Pacific Market Value Share and BPS Analysis by Temperature Range, 2025 and 2035
  • Figure 117: South Asia & Pacific Market Y-o-Y Growth Comparison by Temperature Range, 2025-2035
  • Figure 118: South Asia & Pacific Market Attractiveness Analysis by Temperature Range
  • Figure 119: South Asia & Pacific Market Value Share and BPS Analysis by Configuration, 2025 and 2035
  • Figure 120: South Asia & Pacific Market Y-o-Y Growth Comparison by Configuration, 2025-2035
  • Figure 121: South Asia & Pacific Market Attractiveness Analysis by Configuration
  • Figure 122: South Asia & Pacific Market Value Share and BPS Analysis by End Use, 2025 and 2035
  • Figure 123: South Asia & Pacific Market Y-o-Y Growth Comparison by End Use, 2025-2035
  • Figure 124: South Asia & Pacific Market Attractiveness Analysis by End Use
  • Figure 125: Middle East and Africa Market Value Share and BPS Analysis by Country, 2025 and 2035
  • Figure 126: Middle East and Africa Market Value Share and BPS Analysis by Core Insulation Material, 2025 and 2035
  • Figure 127: Middle East and Africa Market Y-o-Y Growth Comparison by Core Insulation Material, 2025-2035
  • Figure 128: Middle East and Africa Market Attractiveness Analysis by Core Insulation Material
  • Figure 129: Middle East and Africa Market Value Share and BPS Analysis by Sheath Material, 2025 and 2035
  • Figure 130: Middle East and Africa Market Y-o-Y Growth Comparison by Sheath Material, 2025-2035
  • Figure 131: Middle East and Africa Market Attractiveness Analysis by Sheath Material
  • Figure 132: Middle East and Africa Market Value Share and BPS Analysis by Temperature Range, 2025 and 2035
  • Figure 133: Middle East and Africa Market Y-o-Y Growth Comparison by Temperature Range, 2025-2035
  • Figure 134: Middle East and Africa Market Attractiveness Analysis by Temperature Range
  • Figure 135: Middle East and Africa Market Value Share and BPS Analysis by Configuration, 2025 and 2035
  • Figure 136: Middle East and Africa Market Y-o-Y Growth Comparison by Configuration, 2025-2035
  • Figure 137: Middle East and Africa Market Attractiveness Analysis by Configuration
  • Figure 138: Middle East and Africa Market Value Share and BPS Analysis by End Use, 2025 and 2035
  • Figure 139: Middle East and Africa Market Y-o-Y Growth Comparison by End Use, 2025-2035
  • Figure 140: Middle East and Africa Market Attractiveness Analysis by End Use
  • Figure 141: Global Market - Tier Structure Analysis
  • Figure 142: Global Market - Company Share Analysis

Frequently Asked Questions

What is the market size of the mineral insulated cables market in 2025?

The market is expected to reach USD 1.8 billion in 2025.

What is the projected market size of the mineral insulated cables market by 2035?

The market is forecasted to reach USD 3.4 billion by 2035.

What is the CAGR of the mineral insulated cables market from 2025 to 2035?

The market is projected to grow at a CAGR of 6.6% during the forecast period.

Which configuration type leads the mineral insulated cables market?

Multi core cables account for the largest share at 32% in 2025.

Which country is expected to show the fastest growth in the mineral insulated cables market?

India is projected to be the fastest-growing country with a CAGR of 7.5% from 2025 to 2035.

Explore Similar Insights

Future Market Insights

Mineral Insulated Cables Market