Custom Face Care Market Size and Share Forecast Outlook From 2024 to 2034

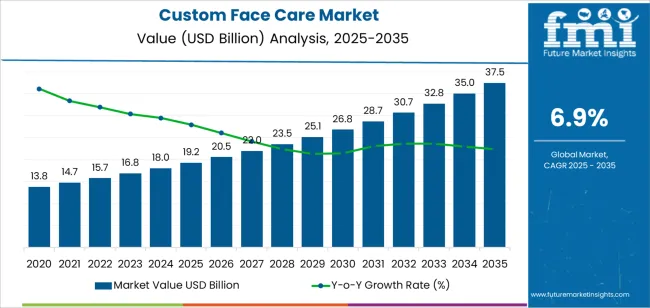
The custom face care market is projected to be valued at USD 17.98 billion by 2024 and rise to USD 34.99 billion by 2034. Custom face care is predicted to rise at a moderate CAGR of 6.9% from 2024 to 2034.

Attributes Key Insights
Estimated Market Size in 2024 USD 17.98 billion
Projected Market Value in 2034 USD 34.99 billion
Value-based CAGR from 2024 to 2034 6.9%

Top Custom Face Care Market Dynamics and Industry Trends

  • Increasing preference for products formulated with natural and organic ingredients, driven by consumer awareness of health and sustainability.
  • Adoption of advanced technologies such as artificial intelligence and machine learning for personalized skin analysis and product recommendations.
  • Rising demand for eco-friendly packaging and cruelty-free formulations, reflecting consumer values towards environmental responsibility.

Comparison of Historical vs Future Outlook on Changing Consumer Trends for Custom Face Care Industry

Between 2019 and 2023, the custom face care market steadily rose, with a historical CAGR of 5.7%. During this period, the market witnessed increasing consumer awareness regarding skincare ingredients, preferences for personalized solutions, and the emergence of innovative technologies in the beauty industry.

Customized face care products gained traction as consumers sought tailored solutions for their skin concerns and preferences. This period also saw the rise of direct-to-consumer brands offering personalized skincare regimens and technology integration for skin analysis and product recommendations.

Looking ahead to the forecasted period from 2024 to 2034, the market is projected to maintain a robust growth trajectory, with a forecasted CAGR of 6.9%. Several factors contribute to this anticipated growth, including continued consumer demand for personalized skincare solutions, ingredient technology advancements, and expanding distribution channels, particularly online platforms.

The forecasted period is expected to witness further integration of artificial intelligence and machine learning algorithms for enhanced personalization and customization in face care products. The market is poised to benefit from increasing consumer focus on sustainability, leading to the rise of eco-friendly and cruelty-free face care options.

Historical CAGR from 2019 to 2023 5.7%
Forecast CAGR from 2024 to 2034 6.9%

Key Growth Drivers Fueling the Custom Face Care Industry

  • Increasingly, consumers seek personalized skincare solutions tailored to their skin types, concerns, and preferences. This demand drives innovation and competition among brands, leading to the development of bespoke skincare products and regimens.
  • Technological advancements, such as artificial intelligence and machine learning, enable brands to offer personalized skin analysis and product recommendations. These technologies enhance the customer experience and drive the adoption of customized skincare solutions.
  • Growing awareness about the importance of skincare and the desire for effective solutions fuel demand for custom face care products. Consumers prioritize products that address their individual needs, leading to a surge in the popularity of personalized skincare regimens.

Factors Restraining the Demand for Custom Face Care Products

  • Developing customized skincare products requires intricate formulation processes and specialized manufacturing capabilities. Brands face challenges in sourcing high-quality ingredients, ensuring product stability, and maintaining consistency across customized formulations.
  • Custom face care products must comply with stringent regulatory standards to ensure safety and efficacy. Brands encounter challenges in navigating regulatory requirements, conducting comprehensive product testing, and obtaining certifications for personalized skincare solutions.
  • Personalized skincare solutions often rely on customer data for skin analysis and product recommendations. Brands must prioritize data privacy and security to safeguard sensitive customer information from potential breaches or misuse, ensuring consumer trust and confidence.

Analysis of Top Countries Formulating, Certifying, Packaging, and Using Custom Face Care Solutions

The provided table illustrates the top five countries in terms of revenue, with China holding a prominent position in the market.

China leads the market due to its embrace of technologically advanced skincare solutions. Leveraging artificial intelligence and machine learning, brands of China offer personalized skin analysis and tailored product recommendations.

This tech-driven approach resonates with consumers seeking innovative and effective skincare solutions, positioning China at the forefront of the custom face care market.

Countries Forecast CAGRs from 2024 to 2034
The United States 3.9%
Canada 4.7%
Australia 7.1%
China 7.7%
Singapore 6.2%

United States is considered a Skincare Innovation Hub

In the United States, the market is a hub for skincare innovation. With a diverse population and varying skincare needs, customized face care products cater to individual preferences and concerns.

From personalized formulations for sensitive skin to targeted treatments for specific skin issues, the market thrives on delivering tailored solutions to American consumers.

Canada Impresses the Market by the Holistic Skincare Approach

Canada embraces a holistic approach to skincare, where the market plays a significant role. Customized face care products in Canada emphasize natural and organic ingredients, aligning with the commitment of the country to sustainability and wellness.

Canada customers prioritize skincare routines that promote overall skin health and well-being, from personalized serums to bespoke moisturizers.

Sustainable Beauty Frontier Drives the Market Growth of Australia

In Australia, the market leads the charge towards sustainable beauty practices. With a strong focus on eco-friendly formulations and packaging, customized face care products cater to environmentally-conscious consumers.

The market pioneers sustainable beauty solutions, from personalized cleansers packaged in recyclable materials to bespoke moisturizers made with ethically sourced ingredients.

Tech-Driven Skincare Solutions Improve the China Market

Tech-driven skincare solutions characterize the custom face care market in China. Leveraging advanced technologies such as artificial intelligence and machine learning, customized face care products offer personalized skin analysis and treatment recommendations.

From smart serums to personalized sheet masks, consumers embrace cutting-edge innovations in skincare to achieve optimal skin health and beauty.

Luxury Personalization Experience Boosts the Market Growth in Singapore

In Singapore, the market offers a luxury personalization experience for discerning consumers. Customized face care products in Singapore combine high-quality ingredients with bespoke formulations, creating an indulgent skincare experience.

From personalized facial oils to customized night creams, custom face care market in Singapore caters to individuals seeking premium skincare solutions tailored to their unique needs.

Custom Face Care Industry Analysis by Top Investment Segments

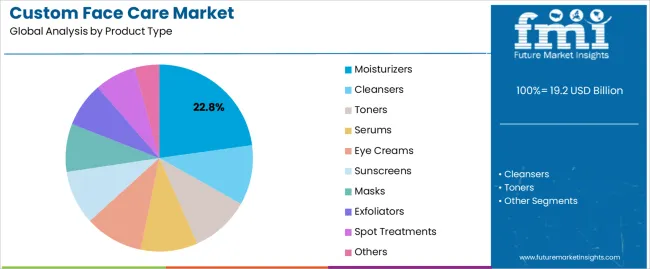
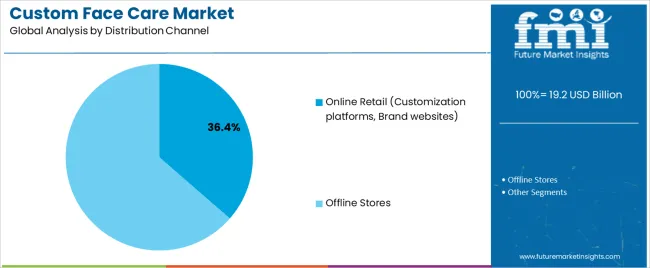
The below section shows the leading segment. Based on product type, the cleansers segment is accounted to hold a market share of 29.6% in 2024. Based on the distribution channel, the offline stores are anticipated to hold a market share of 58.2% in 2024.

With consumers prioritizing clean and healthy skin, the demand for effective cleansers rises, as they play a crucial role in removing impurities, pollutants, and excess oil from the skin, thereby maintaining skin health and preventing issues like acne and blemishes.

The driver behind the continued dominance of offline stores as a distribution channel is the personalized shopping experience they offer.

Category Market Share in 2024
Cleansers 29.6%
Offline Stores 58.2%

Cleansers Segment to Hold a Significant Share in the Market

In 2024, the cleansers segment commands a significant market share of 29.6%. This dominance is attributed to the essential role cleansers play in skincare routines, effectively removing impurities, makeup, and excess oil. With consumers prioritizing skincare hygiene, demand for cleansers, including traditional and specialized formulations, continues to drive growth in the skincare industry.

Offline Stores to Hold a Dominant Share in the Market

The offline stores segment is projected to maintain a substantial market share of 58.2% in 2024. Despite the rise of online shopping, offline stores remain preferred for skincare purchases, offering a tactile shopping experience and personalized assistance from beauty consultants.

Consumers value the immediacy of purchasing skincare products in-store, enabling them to make informed decisions based on product demonstrations and recommendations.
Key Custom Face Care Market Players and Concentration

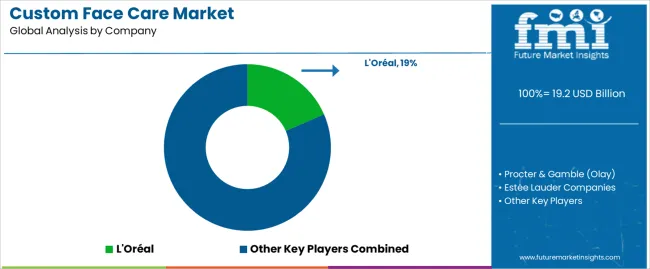
The custom face care market boasts a competitive landscape of established players and emerging brands vying for market share. Key companies like L'Oréal, Estée Lauder, and Procter & Gamble dominate with their extensive product offerings and global presence. These industry leaders invest in research, innovation, and marketing to maintain their competitive edge.

Niche and indie brands leverage innovation, sustainability, and personalization to carve out their market niche. With consumers increasingly seeking tailored skincare solutions, competition intensifies as brands strive to meet evolving preferences and capture a larger share of the market.

Some of the key developments are:

  • In January 2022, L'Oréal and Verily announced an exclusive partnership in the beauty sector to advance skin health. This collaboration aims to deepen understanding of skin and hair aging mechanisms through innovative initiatives.
  • In January 2022, Procter & Gamble (P&G) acquired Tula, a luxury skincare brand known for its clean formulations powered by probiotic extracts and superfoods. Tula's products improve skin balance, soothe irritation, and enhance hydration.

Key Shifting Preferences Covered in Custom Face Care Market Report

  • Adjacent Study on Custom Face Care Market, Mens’ Skincare Products Market
  • Custom Face Care Market Size, Current Insights, and Demographic Trends
  • Personalized Skin Care Products Market Growth Analysis
  • United States Skin Care Market
  • Sales Forecast for Vietnam Skin Care Market

Scope and Coverage of the Custom Face Care Market Report

Attributes Details
Estimated Market Size in 2024 USD 17.98 billion
Projected Market Valuation in 2034 USD 34.99 billion
Value-based CAGR 2024 to 2034 6.9%
Forecast Period 2024 to 2034
Historical Data Available for 2019 to 2023
Market Analysis Value in USD billion
Key Regions Covered North America; Latin America; Western Europe; Eastern Europe; South Asia and Pacific; East Asia; The Middle East and Africa
Key Market Segments Covered Product Type, Skin Concerns, Distribution Channel, Packaging Type, Region
Key Countries Profiled The United States, Canada, Brazil, Mexico, Germany, The United Kingdom, France, Spain, Italy, Russia, Poland, Czech Republic, Romania, India, Bangladesh, Australia, New Zealand, China, Japan, South Korea, GCC countries, South Africa, Israel
Key Companies Profiled Procter & Gamble (Olay); L'Oréal; Estée Lauder Companies; Unilever; Johnson & Johnson; Shiseido; Beiersdorf AG; Amway; Avon Products Inc.; Mary Kay Inc.; Kiehl's (L'Oréal); Lancôme (L'Oréal); Neutrogena (Johnson & Johnson); Clinique (Estée Lauder Companies); Clarins; Caudalie; The Body Shop (L'Oréal); Origins (Estée Lauder Companies); Murad; Tatcha

Top Segments Studied in the Custom Face Care Market Report

By Product Type:

  • Cleansers
  • Toners
  • Serums
  • Moisturizers
  • Eye creams
  • Sunscreens
  • Masks
  • Exfoliators
  • Spot treatments
  • Others

By Skin Concerns:

  • Acne-prone skin
  • Aging skin
  • Dry skin
  • Oily skin
  • Combination skin
  • Sensitive skin
  • Hyperpigmentation
  • Rosacea
  • Eczema
  • Psoriasis
  • Others

By Distribution Channel:

  • Offline Stores
    • Specialty Stores (Skincare boutiques, Custom skincare studios)
    • Pharmacies/Drugstores
    • Department Stores
    • Hypermarkets/Supermarkets
    • Beauty Salons/Spas
    • Direct Sales (Company-owned stores)
    • Others
  • Online Retail (Customization platforms, Brand websites)
    • Direct to Consumer
    • Third-party to Consumer

By Packaging Type:

  • Bottles
  • Jars
  • Tubes
  • Pump Dispensers
  • Sachets
  • Others

By Region:

  • North America
  • Latin America
  • Western Europe
  • Eastern Europe
  • South Asia and Pacific
  • East Asia
  • The Middle East and Africa

Table of Content

  • 1. Executive Summary
  • 2. Market Overview
  • 3. Market Background
  • 4. Global Market Analysis 2019 to 2023 and Forecast, 2024 to 2034
  • 5. Global Market Analysis 2019 to 2023 and Forecast 2024 to 2034, By Product Type
    • 5.1. Cleansers
    • 5.2. Toners
    • 5.3. Serums
    • 5.4. Moisturizers
    • 5.5. Eye creams
    • 5.6. Sunscreens
    • 5.7. Masks
    • 5.8. Exfoliators
    • 5.9. Spot Treatments
    • 5.10. Others
  • 6. Global Market Analysis 2019 to 2023 and Forecast 2024 to 2034, By Skin Concerns
    • 6.1. Acne-prone Skin
    • 6.2. Aging Skin
    • 6.3. Dry Skin
    • 6.4. Oily Skin
    • 6.5. Combination Skin
    • 6.6. Sensitive Skin
    • 6.7. Hyperpigmentation
    • 6.8. Rosacea
    • 6.9. Eczema
    • 6.10. Psoriasis
    • 6.11. Others
  • 7. Global Market Analysis 2019 to 2023 and Forecast 2024 to 2034, By Distribution Channel
    • 7.1. Offline Stores
      • 7.1.1. Specialty Stores (Skincare boutiques, Custom skincare studios)
      • 7.1.2. Pharmacies/Drugstores
      • 7.1.3. Department Stores
      • 7.1.4. Hypermarkets/Supermarkets
      • 7.1.5. Beauty Salons/Spas
      • 7.1.6. Direct Sales (Company-owned stores)
      • 7.1.7. Others
    • 7.2. Online Retail (Customization platforms, Brand websites)
      • 7.2.1. Direct to Consumer
      • 7.2.2. Third-party to Consumer
  • 8. Global Market Analysis 2019 to 2023 and Forecast 2024 to 2034, By Packaging Type
    • 8.1. Bottles
    • 8.2. Jars
    • 8.3. Tubes
    • 8.4. Pump Dispensers
    • 8.5. Sachets
    • 8.6. Others
  • 9. Global Market Analysis 2019 to 2023 and Forecast 2024 to 2034, By Region
    • 9.1. North America
    • 9.2. Latin America
    • 9.3. Western Europe
    • 9.4. Eastern Europe
    • 9.5. South Asia and Pacific
    • 9.6. East Asia
    • 9.7. Middle East and Africa
  • 10. North America Market Analysis 2019 to 2023 and Forecast 2024 to 2034, By Country
  • 11. Latin America Market Analysis 2019 to 2023 and Forecast 2024 to 2034, By Country
  • 12. Western Europe Market Analysis 2019 to 2023 and Forecast 2024 to 2034, By Country
  • 13. Eastern Europe Market Analysis 2019 to 2023 and Forecast 2024 to 2034, By Country
  • 14. South Asia and Pacific Market Analysis 2019 to 2023 and Forecast 2024 to 2034, By Country
  • 15. East Asia Market Analysis 2019 to 2023 and Forecast 2024 to 2034, By Country
  • 16. Middle East and Africa Market Analysis 2019 to 2023 and Forecast 2024 to 2034, By Country
  • 17. Key Countries Market Analysis
  • 18. Market Structure Analysis
  • 19. Competition Analysis
    • 19.1. Procter & Gamble (Olay)
    • 19.2. L'Oréal
    • 19.3. Estée Lauder Companies
    • 19.4. Unilever
    • 19.5. Johnson & Johnson
    • 19.6. Shiseido
    • 19.7. Beiersdorf AG
    • 19.8. Amway
    • 19.9. Avon Products Inc.
    • 19.10. Mary Kay Inc.
    • 19.11. Kiehl's (L'Oréal)
    • 19.12. Lancôme (L'Oréal)
    • 19.13. Neutrogena (Johnson & Johnson)
    • 19.14. Clinique (Estée Lauder Companies)
    • 19.15. Clarins
    • 19.16. Caudalie
    • 19.17. The Body Shop (L'Oréal)
    • 19.18. Origins (Estée Lauder Companies)
    • 19.19. Murad
    • 19.20. Tatcha
  • 20. Assumptions & Acronyms Used
  • 21. Research Methodology

List of Tables

Table 1: Global Market Value (US$ Million) Forecast by Region, 2019 to 2034

Table 2: Global Market Volume (Unit Pack) Forecast by Region, 2019 to 2034

Table 3: Global Market Value (US$ Million) Forecast by Product Type, 2019 to 2034

Table 4: Global Market Volume (Unit Pack) Forecast by Product Type, 2019 to 2034

Table 5: Global Market Value (US$ Million) Forecast by Skin Concerns, 2019 to 2034

Table 6: Global Market Volume (Unit Pack) Forecast by Skin Concerns, 2019 to 2034

Table 7: Global Market Value (US$ Million) Forecast by Distribution Channel, 2019 to 2034

Table 8: Global Market Volume (Unit Pack) Forecast by Distribution Channel, 2019 to 2034

Table 9: Global Market Value (US$ Million) Forecast by Packaging Type, 2019 to 2034

Table 10: Global Market Volume (Unit Pack) Forecast by Packaging Type, 2019 to 2034

Table 11: North America Market Value (US$ Million) Forecast by Country, 2019 to 2034

Table 12: North America Market Volume (Unit Pack) Forecast by Country, 2019 to 2034

Table 13: North America Market Value (US$ Million) Forecast by Product Type, 2019 to 2034

Table 14: North America Market Volume (Unit Pack) Forecast by Product Type, 2019 to 2034

Table 15: North America Market Value (US$ Million) Forecast by Skin Concerns, 2019 to 2034

Table 16: North America Market Volume (Unit Pack) Forecast by Skin Concerns, 2019 to 2034

Table 17: North America Market Value (US$ Million) Forecast by Distribution Channel, 2019 to 2034

Table 18: North America Market Volume (Unit Pack) Forecast by Distribution Channel, 2019 to 2034

Table 19: North America Market Value (US$ Million) Forecast by Packaging Type, 2019 to 2034

Table 20: North America Market Volume (Unit Pack) Forecast by Packaging Type, 2019 to 2034

Table 21: Latin America Market Value (US$ Million) Forecast by Country, 2019 to 2034

Table 22: Latin America Market Volume (Unit Pack) Forecast by Country, 2019 to 2034

Table 23: Latin America Market Value (US$ Million) Forecast by Product Type, 2019 to 2034

Table 24: Latin America Market Volume (Unit Pack) Forecast by Product Type, 2019 to 2034

Table 25: Latin America Market Value (US$ Million) Forecast by Skin Concerns, 2019 to 2034

Table 26: Latin America Market Volume (Unit Pack) Forecast by Skin Concerns, 2019 to 2034

Table 27: Latin America Market Value (US$ Million) Forecast by Distribution Channel, 2019 to 2034

Table 28: Latin America Market Volume (Unit Pack) Forecast by Distribution Channel, 2019 to 2034

Table 29: Latin America Market Value (US$ Million) Forecast by Packaging Type, 2019 to 2034

Table 30: Latin America Market Volume (Unit Pack) Forecast by Packaging Type, 2019 to 2034

Table 31: Western Europe Market Value (US$ Million) Forecast by Country, 2019 to 2034

Table 32: Western Europe Market Volume (Unit Pack) Forecast by Country, 2019 to 2034

Table 33: Western Europe Market Value (US$ Million) Forecast by Product Type, 2019 to 2034

Table 34: Western Europe Market Volume (Unit Pack) Forecast by Product Type, 2019 to 2034

Table 35: Western Europe Market Value (US$ Million) Forecast by Skin Concerns, 2019 to 2034

Table 36: Western Europe Market Volume (Unit Pack) Forecast by Skin Concerns, 2019 to 2034

Table 37: Western Europe Market Value (US$ Million) Forecast by Distribution Channel, 2019 to 2034

Table 38: Western Europe Market Volume (Unit Pack) Forecast by Distribution Channel, 2019 to 2034

Table 39: Western Europe Market Value (US$ Million) Forecast by Packaging Type, 2019 to 2034

Table 40: Western Europe Market Volume (Unit Pack) Forecast by Packaging Type, 2019 to 2034

Table 41: Eastern Europe Market Value (US$ Million) Forecast by Country, 2019 to 2034

Table 42: Eastern Europe Market Volume (Unit Pack) Forecast by Country, 2019 to 2034

Table 43: Eastern Europe Market Value (US$ Million) Forecast by Product Type, 2019 to 2034

Table 44: Eastern Europe Market Volume (Unit Pack) Forecast by Product Type, 2019 to 2034

Table 45: Eastern Europe Market Value (US$ Million) Forecast by Skin Concerns, 2019 to 2034

Table 46: Eastern Europe Market Volume (Unit Pack) Forecast by Skin Concerns, 2019 to 2034

Table 47: Eastern Europe Market Value (US$ Million) Forecast by Distribution Channel, 2019 to 2034

Table 48: Eastern Europe Market Volume (Unit Pack) Forecast by Distribution Channel, 2019 to 2034

Table 49: Eastern Europe Market Value (US$ Million) Forecast by Packaging Type, 2019 to 2034

Table 50: Eastern Europe Market Volume (Unit Pack) Forecast by Packaging Type, 2019 to 2034

Table 51: South Asia and Pacific Market Value (US$ Million) Forecast by Country, 2019 to 2034

Table 52: South Asia and Pacific Market Volume (Unit Pack) Forecast by Country, 2019 to 2034

Table 53: South Asia and Pacific Market Value (US$ Million) Forecast by Product Type, 2019 to 2034

Table 54: South Asia and Pacific Market Volume (Unit Pack) Forecast by Product Type, 2019 to 2034

Table 55: South Asia and Pacific Market Value (US$ Million) Forecast by Skin Concerns, 2019 to 2034

Table 56: South Asia and Pacific Market Volume (Unit Pack) Forecast by Skin Concerns, 2019 to 2034

Table 57: South Asia and Pacific Market Value (US$ Million) Forecast by Distribution Channel, 2019 to 2034

Table 58: South Asia and Pacific Market Volume (Unit Pack) Forecast by Distribution Channel, 2019 to 2034

Table 59: South Asia and Pacific Market Value (US$ Million) Forecast by Packaging Type, 2019 to 2034

Table 60: South Asia and Pacific Market Volume (Unit Pack) Forecast by Packaging Type, 2019 to 2034

Table 61: East Asia Market Value (US$ Million) Forecast by Country, 2019 to 2034

Table 62: East Asia Market Volume (Unit Pack) Forecast by Country, 2019 to 2034

Table 63: East Asia Market Value (US$ Million) Forecast by Product Type, 2019 to 2034

Table 64: East Asia Market Volume (Unit Pack) Forecast by Product Type, 2019 to 2034

Table 65: East Asia Market Value (US$ Million) Forecast by Skin Concerns, 2019 to 2034

Table 66: East Asia Market Volume (Unit Pack) Forecast by Skin Concerns, 2019 to 2034

Table 67: East Asia Market Value (US$ Million) Forecast by Distribution Channel, 2019 to 2034

Table 68: East Asia Market Volume (Unit Pack) Forecast by Distribution Channel, 2019 to 2034

Table 69: East Asia Market Value (US$ Million) Forecast by Packaging Type, 2019 to 2034

Table 70: East Asia Market Volume (Unit Pack) Forecast by Packaging Type, 2019 to 2034

Table 71: Middle East and Africa Market Value (US$ Million) Forecast by Country, 2019 to 2034

Table 72: Middle East and Africa Market Volume (Unit Pack) Forecast by Country, 2019 to 2034

Table 73: Middle East and Africa Market Value (US$ Million) Forecast by Product Type, 2019 to 2034

Table 74: Middle East and Africa Market Volume (Unit Pack) Forecast by Product Type, 2019 to 2034

Table 75: Middle East and Africa Market Value (US$ Million) Forecast by Skin Concerns, 2019 to 2034

Table 76: Middle East and Africa Market Volume (Unit Pack) Forecast by Skin Concerns, 2019 to 2034

Table 77: Middle East and Africa Market Value (US$ Million) Forecast by Distribution Channel, 2019 to 2034

Table 78: Middle East and Africa Market Volume (Unit Pack) Forecast by Distribution Channel, 2019 to 2034

Table 79: Middle East and Africa Market Value (US$ Million) Forecast by Packaging Type, 2019 to 2034

Table 80: Middle East and Africa Market Volume (Unit Pack) Forecast by Packaging Type, 2019 to 2034

List of Figures

Figure 1: Global Market Value (US$ Million) by Product Type, 2024 to 2034

Figure 2: Global Market Value (US$ Million) by Skin Concerns, 2024 to 2034

Figure 3: Global Market Value (US$ Million) by Distribution Channel, 2024 to 2034

Figure 4: Global Market Value (US$ Million) by Packaging Type, 2024 to 2034

Figure 5: Global Market Value (US$ Million) by Region, 2024 to 2034

Figure 6: Global Market Value (US$ Million) Analysis by Region, 2019 to 2034

Figure 7: Global Market Volume (Unit Pack) Analysis by Region, 2019 to 2034

Figure 8: Global Market Value Share (%) and BPS Analysis by Region, 2024 to 2034

Figure 9: Global Market Y-o-Y Growth (%) Projections by Region, 2024 to 2034

Figure 10: Global Market Value (US$ Million) Analysis by Product Type, 2019 to 2034

Figure 11: Global Market Volume (Unit Pack) Analysis by Product Type, 2019 to 2034

Figure 12: Global Market Value Share (%) and BPS Analysis by Product Type, 2024 to 2034

Figure 13: Global Market Y-o-Y Growth (%) Projections by Product Type, 2024 to 2034

Figure 14: Global Market Value (US$ Million) Analysis by Skin Concerns, 2019 to 2034

Figure 15: Global Market Volume (Unit Pack) Analysis by Skin Concerns, 2019 to 2034

Figure 16: Global Market Value Share (%) and BPS Analysis by Skin Concerns, 2024 to 2034

Figure 17: Global Market Y-o-Y Growth (%) Projections by Skin Concerns, 2024 to 2034

Figure 18: Global Market Value (US$ Million) Analysis by Distribution Channel, 2019 to 2034

Figure 19: Global Market Volume (Unit Pack) Analysis by Distribution Channel, 2019 to 2034

Figure 20: Global Market Value Share (%) and BPS Analysis by Distribution Channel, 2024 to 2034

Figure 21: Global Market Y-o-Y Growth (%) Projections by Distribution Channel, 2024 to 2034

Figure 22: Global Market Value (US$ Million) Analysis by Packaging Type, 2019 to 2034

Figure 23: Global Market Volume (Unit Pack) Analysis by Packaging Type, 2019 to 2034

Figure 24: Global Market Value Share (%) and BPS Analysis by Packaging Type, 2024 to 2034

Figure 25: Global Market Y-o-Y Growth (%) Projections by Packaging Type, 2024 to 2034

Figure 26: Global Market Attractiveness by Product Type, 2024 to 2034

Figure 27: Global Market Attractiveness by Skin Concerns, 2024 to 2034

Figure 28: Global Market Attractiveness by Distribution Channel, 2024 to 2034

Figure 29: Global Market Attractiveness by Packaging Type, 2024 to 2034

Figure 30: Global Market Attractiveness by Region, 2024 to 2034

Figure 31: North America Market Value (US$ Million) by Product Type, 2024 to 2034

Figure 32: North America Market Value (US$ Million) by Skin Concerns, 2024 to 2034

Figure 33: North America Market Value (US$ Million) by Distribution Channel, 2024 to 2034

Figure 34: North America Market Value (US$ Million) by Packaging Type, 2024 to 2034

Figure 35: North America Market Value (US$ Million) by Country, 2024 to 2034

Figure 36: North America Market Value (US$ Million) Analysis by Country, 2019 to 2034

Figure 37: North America Market Volume (Unit Pack) Analysis by Country, 2019 to 2034

Figure 38: North America Market Value Share (%) and BPS Analysis by Country, 2024 to 2034

Figure 39: North America Market Y-o-Y Growth (%) Projections by Country, 2024 to 2034

Figure 40: North America Market Value (US$ Million) Analysis by Product Type, 2019 to 2034

Figure 41: North America Market Volume (Unit Pack) Analysis by Product Type, 2019 to 2034

Figure 42: North America Market Value Share (%) and BPS Analysis by Product Type, 2024 to 2034

Figure 43: North America Market Y-o-Y Growth (%) Projections by Product Type, 2024 to 2034

Figure 44: North America Market Value (US$ Million) Analysis by Skin Concerns, 2019 to 2034

Figure 45: North America Market Volume (Unit Pack) Analysis by Skin Concerns, 2019 to 2034

Figure 46: North America Market Value Share (%) and BPS Analysis by Skin Concerns, 2024 to 2034

Figure 47: North America Market Y-o-Y Growth (%) Projections by Skin Concerns, 2024 to 2034

Figure 48: North America Market Value (US$ Million) Analysis by Distribution Channel, 2019 to 2034

Figure 49: North America Market Volume (Unit Pack) Analysis by Distribution Channel, 2019 to 2034

Figure 50: North America Market Value Share (%) and BPS Analysis by Distribution Channel, 2024 to 2034

Figure 51: North America Market Y-o-Y Growth (%) Projections by Distribution Channel, 2024 to 2034

Figure 52: North America Market Value (US$ Million) Analysis by Packaging Type, 2019 to 2034

Figure 53: North America Market Volume (Unit Pack) Analysis by Packaging Type, 2019 to 2034

Figure 54: North America Market Value Share (%) and BPS Analysis by Packaging Type, 2024 to 2034

Figure 55: North America Market Y-o-Y Growth (%) Projections by Packaging Type, 2024 to 2034

Figure 56: North America Market Attractiveness by Product Type, 2024 to 2034

Figure 57: North America Market Attractiveness by Skin Concerns, 2024 to 2034

Figure 58: North America Market Attractiveness by Distribution Channel, 2024 to 2034

Figure 59: North America Market Attractiveness by Packaging Type, 2024 to 2034

Figure 60: North America Market Attractiveness by Country, 2024 to 2034

Figure 61: Latin America Market Value (US$ Million) by Product Type, 2024 to 2034

Figure 62: Latin America Market Value (US$ Million) by Skin Concerns, 2024 to 2034

Figure 63: Latin America Market Value (US$ Million) by Distribution Channel, 2024 to 2034

Figure 64: Latin America Market Value (US$ Million) by Packaging Type, 2024 to 2034

Figure 65: Latin America Market Value (US$ Million) by Country, 2024 to 2034

Figure 66: Latin America Market Value (US$ Million) Analysis by Country, 2019 to 2034

Figure 67: Latin America Market Volume (Unit Pack) Analysis by Country, 2019 to 2034

Figure 68: Latin America Market Value Share (%) and BPS Analysis by Country, 2024 to 2034

Figure 69: Latin America Market Y-o-Y Growth (%) Projections by Country, 2024 to 2034

Figure 70: Latin America Market Value (US$ Million) Analysis by Product Type, 2019 to 2034

Figure 71: Latin America Market Volume (Unit Pack) Analysis by Product Type, 2019 to 2034

Figure 72: Latin America Market Value Share (%) and BPS Analysis by Product Type, 2024 to 2034

Figure 73: Latin America Market Y-o-Y Growth (%) Projections by Product Type, 2024 to 2034

Figure 74: Latin America Market Value (US$ Million) Analysis by Skin Concerns, 2019 to 2034

Figure 75: Latin America Market Volume (Unit Pack) Analysis by Skin Concerns, 2019 to 2034

Figure 76: Latin America Market Value Share (%) and BPS Analysis by Skin Concerns, 2024 to 2034

Figure 77: Latin America Market Y-o-Y Growth (%) Projections by Skin Concerns, 2024 to 2034

Figure 78: Latin America Market Value (US$ Million) Analysis by Distribution Channel, 2019 to 2034

Figure 79: Latin America Market Volume (Unit Pack) Analysis by Distribution Channel, 2019 to 2034

Figure 80: Latin America Market Value Share (%) and BPS Analysis by Distribution Channel, 2024 to 2034

Figure 81: Latin America Market Y-o-Y Growth (%) Projections by Distribution Channel, 2024 to 2034

Figure 82: Latin America Market Value (US$ Million) Analysis by Packaging Type, 2019 to 2034

Figure 83: Latin America Market Volume (Unit Pack) Analysis by Packaging Type, 2019 to 2034

Figure 84: Latin America Market Value Share (%) and BPS Analysis by Packaging Type, 2024 to 2034

Figure 85: Latin America Market Y-o-Y Growth (%) Projections by Packaging Type, 2024 to 2034

Figure 86: Latin America Market Attractiveness by Product Type, 2024 to 2034

Figure 87: Latin America Market Attractiveness by Skin Concerns, 2024 to 2034

Figure 88: Latin America Market Attractiveness by Distribution Channel, 2024 to 2034

Figure 89: Latin America Market Attractiveness by Packaging Type, 2024 to 2034

Figure 90: Latin America Market Attractiveness by Country, 2024 to 2034

Figure 91: Western Europe Market Value (US$ Million) by Product Type, 2024 to 2034

Figure 92: Western Europe Market Value (US$ Million) by Skin Concerns, 2024 to 2034

Figure 93: Western Europe Market Value (US$ Million) by Distribution Channel, 2024 to 2034

Figure 94: Western Europe Market Value (US$ Million) by Packaging Type, 2024 to 2034

Figure 95: Western Europe Market Value (US$ Million) by Country, 2024 to 2034

Figure 96: Western Europe Market Value (US$ Million) Analysis by Country, 2019 to 2034

Figure 97: Western Europe Market Volume (Unit Pack) Analysis by Country, 2019 to 2034

Figure 98: Western Europe Market Value Share (%) and BPS Analysis by Country, 2024 to 2034

Figure 99: Western Europe Market Y-o-Y Growth (%) Projections by Country, 2024 to 2034

Figure 100: Western Europe Market Value (US$ Million) Analysis by Product Type, 2019 to 2034

Figure 101: Western Europe Market Volume (Unit Pack) Analysis by Product Type, 2019 to 2034

Figure 102: Western Europe Market Value Share (%) and BPS Analysis by Product Type, 2024 to 2034

Figure 103: Western Europe Market Y-o-Y Growth (%) Projections by Product Type, 2024 to 2034

Figure 104: Western Europe Market Value (US$ Million) Analysis by Skin Concerns, 2019 to 2034

Figure 105: Western Europe Market Volume (Unit Pack) Analysis by Skin Concerns, 2019 to 2034

Figure 106: Western Europe Market Value Share (%) and BPS Analysis by Skin Concerns, 2024 to 2034

Figure 107: Western Europe Market Y-o-Y Growth (%) Projections by Skin Concerns, 2024 to 2034

Figure 108: Western Europe Market Value (US$ Million) Analysis by Distribution Channel, 2019 to 2034

Figure 109: Western Europe Market Volume (Unit Pack) Analysis by Distribution Channel, 2019 to 2034

Figure 110: Western Europe Market Value Share (%) and BPS Analysis by Distribution Channel, 2024 to 2034

Figure 111: Western Europe Market Y-o-Y Growth (%) Projections by Distribution Channel, 2024 to 2034

Figure 112: Western Europe Market Value (US$ Million) Analysis by Packaging Type, 2019 to 2034

Figure 113: Western Europe Market Volume (Unit Pack) Analysis by Packaging Type, 2019 to 2034

Figure 114: Western Europe Market Value Share (%) and BPS Analysis by Packaging Type, 2024 to 2034

Figure 115: Western Europe Market Y-o-Y Growth (%) Projections by Packaging Type, 2024 to 2034

Figure 116: Western Europe Market Attractiveness by Product Type, 2024 to 2034

Figure 117: Western Europe Market Attractiveness by Skin Concerns, 2024 to 2034

Figure 118: Western Europe Market Attractiveness by Distribution Channel, 2024 to 2034

Figure 119: Western Europe Market Attractiveness by Packaging Type, 2024 to 2034

Figure 120: Western Europe Market Attractiveness by Country, 2024 to 2034

Figure 121: Eastern Europe Market Value (US$ Million) by Product Type, 2024 to 2034

Figure 122: Eastern Europe Market Value (US$ Million) by Skin Concerns, 2024 to 2034

Figure 123: Eastern Europe Market Value (US$ Million) by Distribution Channel, 2024 to 2034

Figure 124: Eastern Europe Market Value (US$ Million) by Packaging Type, 2024 to 2034

Figure 125: Eastern Europe Market Value (US$ Million) by Country, 2024 to 2034

Figure 126: Eastern Europe Market Value (US$ Million) Analysis by Country, 2019 to 2034

Figure 127: Eastern Europe Market Volume (Unit Pack) Analysis by Country, 2019 to 2034

Figure 128: Eastern Europe Market Value Share (%) and BPS Analysis by Country, 2024 to 2034

Figure 129: Eastern Europe Market Y-o-Y Growth (%) Projections by Country, 2024 to 2034

Figure 130: Eastern Europe Market Value (US$ Million) Analysis by Product Type, 2019 to 2034

Figure 131: Eastern Europe Market Volume (Unit Pack) Analysis by Product Type, 2019 to 2034

Figure 132: Eastern Europe Market Value Share (%) and BPS Analysis by Product Type, 2024 to 2034

Figure 133: Eastern Europe Market Y-o-Y Growth (%) Projections by Product Type, 2024 to 2034

Figure 134: Eastern Europe Market Value (US$ Million) Analysis by Skin Concerns, 2019 to 2034

Figure 135: Eastern Europe Market Volume (Unit Pack) Analysis by Skin Concerns, 2019 to 2034

Figure 136: Eastern Europe Market Value Share (%) and BPS Analysis by Skin Concerns, 2024 to 2034

Figure 137: Eastern Europe Market Y-o-Y Growth (%) Projections by Skin Concerns, 2024 to 2034

Figure 138: Eastern Europe Market Value (US$ Million) Analysis by Distribution Channel, 2019 to 2034

Figure 139: Eastern Europe Market Volume (Unit Pack) Analysis by Distribution Channel, 2019 to 2034

Figure 140: Eastern Europe Market Value Share (%) and BPS Analysis by Distribution Channel, 2024 to 2034

Figure 141: Eastern Europe Market Y-o-Y Growth (%) Projections by Distribution Channel, 2024 to 2034

Figure 142: Eastern Europe Market Value (US$ Million) Analysis by Packaging Type, 2019 to 2034

Figure 143: Eastern Europe Market Volume (Unit Pack) Analysis by Packaging Type, 2019 to 2034

Figure 144: Eastern Europe Market Value Share (%) and BPS Analysis by Packaging Type, 2024 to 2034

Figure 145: Eastern Europe Market Y-o-Y Growth (%) Projections by Packaging Type, 2024 to 2034

Figure 146: Eastern Europe Market Attractiveness by Product Type, 2024 to 2034

Figure 147: Eastern Europe Market Attractiveness by Skin Concerns, 2024 to 2034

Figure 148: Eastern Europe Market Attractiveness by Distribution Channel, 2024 to 2034

Figure 149: Eastern Europe Market Attractiveness by Packaging Type, 2024 to 2034

Figure 150: Eastern Europe Market Attractiveness by Country, 2024 to 2034

Figure 151: South Asia and Pacific Market Value (US$ Million) by Product Type, 2024 to 2034

Figure 152: South Asia and Pacific Market Value (US$ Million) by Skin Concerns, 2024 to 2034

Figure 153: South Asia and Pacific Market Value (US$ Million) by Distribution Channel, 2024 to 2034

Figure 154: South Asia and Pacific Market Value (US$ Million) by Packaging Type, 2024 to 2034

Figure 155: South Asia and Pacific Market Value (US$ Million) by Country, 2024 to 2034

Figure 156: South Asia and Pacific Market Value (US$ Million) Analysis by Country, 2019 to 2034

Figure 157: South Asia and Pacific Market Volume (Unit Pack) Analysis by Country, 2019 to 2034

Figure 158: South Asia and Pacific Market Value Share (%) and BPS Analysis by Country, 2024 to 2034

Figure 159: South Asia and Pacific Market Y-o-Y Growth (%) Projections by Country, 2024 to 2034

Figure 160: South Asia and Pacific Market Value (US$ Million) Analysis by Product Type, 2019 to 2034

Figure 161: South Asia and Pacific Market Volume (Unit Pack) Analysis by Product Type, 2019 to 2034

Figure 162: South Asia and Pacific Market Value Share (%) and BPS Analysis by Product Type, 2024 to 2034

Figure 163: South Asia and Pacific Market Y-o-Y Growth (%) Projections by Product Type, 2024 to 2034

Figure 164: South Asia and Pacific Market Value (US$ Million) Analysis by Skin Concerns, 2019 to 2034

Figure 165: South Asia and Pacific Market Volume (Unit Pack) Analysis by Skin Concerns, 2019 to 2034

Figure 166: South Asia and Pacific Market Value Share (%) and BPS Analysis by Skin Concerns, 2024 to 2034

Figure 167: South Asia and Pacific Market Y-o-Y Growth (%) Projections by Skin Concerns, 2024 to 2034

Figure 168: South Asia and Pacific Market Value (US$ Million) Analysis by Distribution Channel, 2019 to 2034

Figure 169: South Asia and Pacific Market Volume (Unit Pack) Analysis by Distribution Channel, 2019 to 2034

Figure 170: South Asia and Pacific Market Value Share (%) and BPS Analysis by Distribution Channel, 2024 to 2034

Figure 171: South Asia and Pacific Market Y-o-Y Growth (%) Projections by Distribution Channel, 2024 to 2034

Figure 172: South Asia and Pacific Market Value (US$ Million) Analysis by Packaging Type, 2019 to 2034

Figure 173: South Asia and Pacific Market Volume (Unit Pack) Analysis by Packaging Type, 2019 to 2034

Figure 174: South Asia and Pacific Market Value Share (%) and BPS Analysis by Packaging Type, 2024 to 2034

Figure 175: South Asia and Pacific Market Y-o-Y Growth (%) Projections by Packaging Type, 2024 to 2034

Figure 176: South Asia and Pacific Market Attractiveness by Product Type, 2024 to 2034

Figure 177: South Asia and Pacific Market Attractiveness by Skin Concerns, 2024 to 2034

Figure 178: South Asia and Pacific Market Attractiveness by Distribution Channel, 2024 to 2034

Figure 179: South Asia and Pacific Market Attractiveness by Packaging Type, 2024 to 2034

Figure 180: South Asia and Pacific Market Attractiveness by Country, 2024 to 2034

Figure 181: East Asia Market Value (US$ Million) by Product Type, 2024 to 2034

Figure 182: East Asia Market Value (US$ Million) by Skin Concerns, 2024 to 2034

Figure 183: East Asia Market Value (US$ Million) by Distribution Channel, 2024 to 2034

Figure 184: East Asia Market Value (US$ Million) by Packaging Type, 2024 to 2034

Figure 185: East Asia Market Value (US$ Million) by Country, 2024 to 2034

Figure 186: East Asia Market Value (US$ Million) Analysis by Country, 2019 to 2034

Figure 187: East Asia Market Volume (Unit Pack) Analysis by Country, 2019 to 2034

Figure 188: East Asia Market Value Share (%) and BPS Analysis by Country, 2024 to 2034

Figure 189: East Asia Market Y-o-Y Growth (%) Projections by Country, 2024 to 2034

Figure 190: East Asia Market Value (US$ Million) Analysis by Product Type, 2019 to 2034

Figure 191: East Asia Market Volume (Unit Pack) Analysis by Product Type, 2019 to 2034

Figure 192: East Asia Market Value Share (%) and BPS Analysis by Product Type, 2024 to 2034

Figure 193: East Asia Market Y-o-Y Growth (%) Projections by Product Type, 2024 to 2034

Figure 194: East Asia Market Value (US$ Million) Analysis by Skin Concerns, 2019 to 2034

Figure 195: East Asia Market Volume (Unit Pack) Analysis by Skin Concerns, 2019 to 2034

Figure 196: East Asia Market Value Share (%) and BPS Analysis by Skin Concerns, 2024 to 2034

Figure 197: East Asia Market Y-o-Y Growth (%) Projections by Skin Concerns, 2024 to 2034

Figure 198: East Asia Market Value (US$ Million) Analysis by Distribution Channel, 2019 to 2034

Figure 199: East Asia Market Volume (Unit Pack) Analysis by Distribution Channel, 2019 to 2034

Figure 200: East Asia Market Value Share (%) and BPS Analysis by Distribution Channel, 2024 to 2034

Figure 201: East Asia Market Y-o-Y Growth (%) Projections by Distribution Channel, 2024 to 2034

Figure 202: East Asia Market Value (US$ Million) Analysis by Packaging Type, 2019 to 2034

Figure 203: East Asia Market Volume (Unit Pack) Analysis by Packaging Type, 2019 to 2034

Figure 204: East Asia Market Value Share (%) and BPS Analysis by Packaging Type, 2024 to 2034

Figure 205: East Asia Market Y-o-Y Growth (%) Projections by Packaging Type, 2024 to 2034

Figure 206: East Asia Market Attractiveness by Product Type, 2024 to 2034

Figure 207: East Asia Market Attractiveness by Skin Concerns, 2024 to 2034

Figure 208: East Asia Market Attractiveness by Distribution Channel, 2024 to 2034

Figure 209: East Asia Market Attractiveness by Packaging Type, 2024 to 2034

Figure 210: East Asia Market Attractiveness by Country, 2024 to 2034

Figure 211: Middle East and Africa Market Value (US$ Million) by Product Type, 2024 to 2034

Figure 212: Middle East and Africa Market Value (US$ Million) by Skin Concerns, 2024 to 2034

Figure 213: Middle East and Africa Market Value (US$ Million) by Distribution Channel, 2024 to 2034

Figure 214: Middle East and Africa Market Value (US$ Million) by Packaging Type, 2024 to 2034

Figure 215: Middle East and Africa Market Value (US$ Million) by Country, 2024 to 2034

Figure 216: Middle East and Africa Market Value (US$ Million) Analysis by Country, 2019 to 2034

Figure 217: Middle East and Africa Market Volume (Unit Pack) Analysis by Country, 2019 to 2034

Figure 218: Middle East and Africa Market Value Share (%) and BPS Analysis by Country, 2024 to 2034

Figure 219: Middle East and Africa Market Y-o-Y Growth (%) Projections by Country, 2024 to 2034

Figure 220: Middle East and Africa Market Value (US$ Million) Analysis by Product Type, 2019 to 2034

Figure 221: Middle East and Africa Market Volume (Unit Pack) Analysis by Product Type, 2019 to 2034

Figure 222: Middle East and Africa Market Value Share (%) and BPS Analysis by Product Type, 2024 to 2034

Figure 223: Middle East and Africa Market Y-o-Y Growth (%) Projections by Product Type, 2024 to 2034

Figure 224: Middle East and Africa Market Value (US$ Million) Analysis by Skin Concerns, 2019 to 2034

Figure 225: Middle East and Africa Market Volume (Unit Pack) Analysis by Skin Concerns, 2019 to 2034

Figure 226: Middle East and Africa Market Value Share (%) and BPS Analysis by Skin Concerns, 2024 to 2034

Figure 227: Middle East and Africa Market Y-o-Y Growth (%) Projections by Skin Concerns, 2024 to 2034

Figure 228: Middle East and Africa Market Value (US$ Million) Analysis by Distribution Channel, 2019 to 2034

Figure 229: Middle East and Africa Market Volume (Unit Pack) Analysis by Distribution Channel, 2019 to 2034

Figure 230: Middle East and Africa Market Value Share (%) and BPS Analysis by Distribution Channel, 2024 to 2034

Figure 231: Middle East and Africa Market Y-o-Y Growth (%) Projections by Distribution Channel, 2024 to 2034

Figure 232: Middle East and Africa Market Value (US$ Million) Analysis by Packaging Type, 2019 to 2034

Figure 233: Middle East and Africa Market Volume (Unit Pack) Analysis by Packaging Type, 2019 to 2034

Figure 234: Middle East and Africa Market Value Share (%) and BPS Analysis by Packaging Type, 2024 to 2034

Figure 235: Middle East and Africa Market Y-o-Y Growth (%) Projections by Packaging Type, 2024 to 2034

Figure 236: Middle East and Africa Market Attractiveness by Product Type, 2024 to 2034

Figure 237: Middle East and Africa Market Attractiveness by Skin Concerns, 2024 to 2034

Figure 238: Middle East and Africa Market Attractiveness by Distribution Channel, 2024 to 2034

Figure 239: Middle East and Africa Market Attractiveness by Packaging Type, 2024 to 2034

Figure 240: Middle East and Africa Market Attractiveness by Country, 2024 to 2034

Frequently Asked Questions

What is the expected worth of the custom face care market in 2024?

As of 2024, the market for custom face care is expected to be valued at USD 17.98 billion.

What is the anticipated market value for custom face care in 2034?

By 2034, the market value of custom face care is expected to reach USD 34.99 billion.

What is the projected forecast CAGR for the custom face care market from 2024 to 2034?

From 2024 to 2034, the custom face care market is expected to flourish at a CAGR of 6.9%.

Based on product type, which segment dominates the custom face care market?

The cleansers segment is accounted to hold a market share of 29.6% in 2024.

Which country is likely to dominate the custom face care market?

China is likely the top-performing market, with a CAGR of 7.7%.

Explore Beauty & Wellness Insights

Future Market Insights

Custom Face Care Market