Custom Probiotics Market Size and Share Forecast Outlook 2025 to 2035

The Custom Probiotics Market is projected to reach a valuation of USD 635.6 million in 2025 and USD 1,106.6 million by 2035. This marks an increase of USD 471.0 million, representing an overall growth of approximately 74% across the decade. A compound annual growth rate (CAGR) of 5.7% has been forecasted, indicating robust yet sustainable expansion.
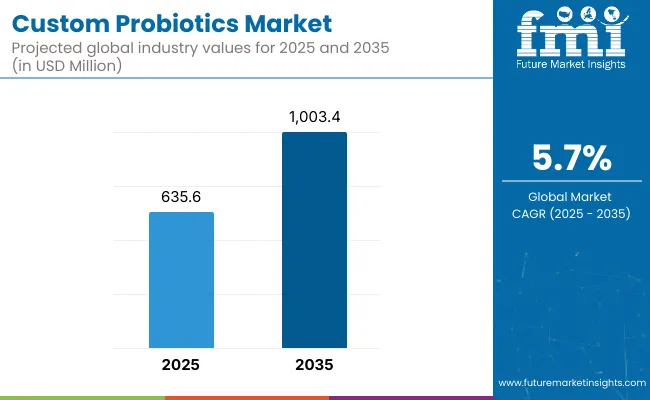
Quick Stats for Custom Probiotics Market

  • Custom Probiotics Value (2025): USD 635.6 million
  • Custom Probiotics Forecast Value (2035): USD 1,106.6 million
  • Custom Probiotics Forecast CAGR: 5.7%
  • Leading Segment in Custom Probiotics in 2025, by Customization Type: Strain-Specific Formulations (25.0%)
  • Key Growth Regions in the Custom Probiotics: North America, Asia-Pacific, Europe
  • Top Key Players in Custom Probiotics: DSM-Firmenich, DuPont Nutrition & Health, BioGaia, Probi AB, Winclove Probiotics, Lallemand Health Solutions, Novonesis, Yakult Honsha, Probiotec Group, and Seroyal.

Custom Probiotics Market

Custom Probiotics Key Takeaways

Metric Value
Estimated Value in (2025E) USD 635.6 million
Forecast Value in (2035F) USD 1,106.6 million
Forecast CAGR (2025 to 2035) 5.7%

Over the first half of the forecast period (2025-2030), the market is expected to expand from USD 635.6 million to approximately USD 844.0 million, contributing USD 208.4 million or 44% of the total decade growth.

This initial phase is expected to be driven by increasing adoption of strain-specific and condition-targeted probiotic formulations, particularly among early adopters in North America, Europe, and South Asia & Pacific. Heightened consumer demand for personalized gut health and women’s wellness applications is projected to anchor early momentum, supported by the rise of at-home microbiome diagnostics.

During the second half (2030-2035), the market is forecasted to rise from USD 844.0 million to USD 1,106.6 million, adding USD 262.6 million, which represents 56% of the total growth. This phase is expected to be accelerated by the mainstream integration of AI-guided formulation platforms, direct-to-consumer (DTC) personalization models, and increasing inclusion of custom probiotics in clinical-grade nutrition protocols. Recurring revenue from subscription-based models and microbiome data services is anticipated to become more prominent, deepening market penetration and increasing lifetime customer value.

From 2020 to 2024, the Custom Probiotics market grew from an estimated USD ~410 million to USD 635.6 million, driven primarily by demand for pharmaceutical-grade and encapsulated cognitive support solutions. During this period, the competitive landscape was led by biological material suppliers, who held a dominant share by offering standardized, research-ready formulations across regulated industries.

Growth was driven by academic research, early cosmeceutical exploration, and clinical interest in neuro-supportive bioactives. Service-based models including custom formulation, GMP certification support, and regulatory documentation contributed under 15% of market value but showed rising potential.

By 2025, demand is expected to surpass USD 635.6 million, with revenue share gradually shifting toward functional and cosmetic-grade innovations. Traditional bulk extract suppliers are now facing competition from digitally integrated nutraceutical brands and therapeutic peptide formulators, offering enhanced traceability, application-specific peptides, and regionally customized delivery systems. Competitive advantage is moving beyond raw extract volume to ecosystem integration, bioavailability optimization, and B2B customization at scale.

Why the Custom Probiotics is growing?

Rapid growth in the Custom Probiotics Market is being fueled by increasing awareness of the gut microbiome’s role in systemic health. Demand has been amplified by a shift toward personalized wellness, where off-the-shelf formulations are being replaced by microbiome-matched probiotics. This transition is being supported by the widespread availability of at-home gut testing kits and digital health platforms capable of generating individualized strain recommendations.

Healthcare practitioners have increasingly prescribed personalized probiotic regimens for chronic digestive, immune, and women’s health concerns, further legitimizing the category. Direct-to-consumer subscription models have been adopted widely, ensuring continuous engagement and improving adherence rates.

Data-driven formulation strategies are being used to tailor probiotics based on consumer lifestyle, diet, and health goals, making the market more resilient to commoditization. As precision nutrition continues to be embraced, long-term growth is expected to be supported by AI-integrated formulation systems and growing clinical validation of strain-specific therapeutic effects.

Segmental Analysis

The Custom Probiotics Market has been segmented across multiple axes to reflect the precision-driven nature of product development and consumer targeting. Key segments include customization type, application, formulation type, delivery technology, sales channel, and end user.

Each segment reflects the industry's shift toward personalized health outcomes, microbiome-based decision making, and functional delivery innovation. Among them, the customization type, application, and formulation type segments are viewed as core to competitive differentiation and consumer value creation.

These segments enable brands to tailor probiotics based not only on health objectives but also on lifestyle, convenience, and absorption efficacy. As demand for personalization intensifies, these segmental levers are expected to define category leadership and long-term consumer engagement.
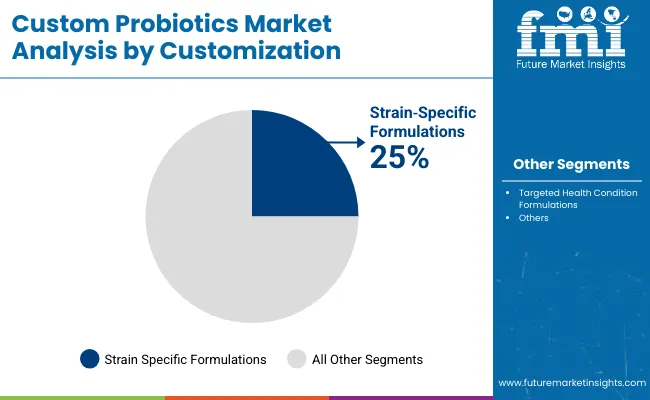
Insights into the Customization Type Segment with Strain Specific Formulations Leading in Market Share

Custom Probiotics Market By Costomization

Customization Type 2025 Share %
Strain Specific Formulations 25.0%
Targeted Health Condition Formulations 20.0%

The Customization Type segment has been characterized by a balanced distribution between Strain-Specific and Targeted Health Condition Formulations, each commanding a 25.0% share in 2025. Growth in this segment is being driven by consumer demand for targeted results and transparent health claims.

Strain-specific products have been validated through clinical studies and have been increasingly favored for their precision in addressing digestive and immune concerns. Meanwhile, multi-strain blends have been positioned as holistic wellness solutions, appealing to users seeking broad-spectrum benefits.

Notably, Personalized Gut Microbiome-Based Probiotics, although smaller in current share, are forecasted to grow the fastest, with a CAGR of 10.2%. This is being enabled by AI-driven diagnostics, at-home gut testing kits, and digital therapeutics platforms. As consumer expectations shift toward tailored, data-backed interventions, customization will remain a strategic growth lever in probiotic product development.
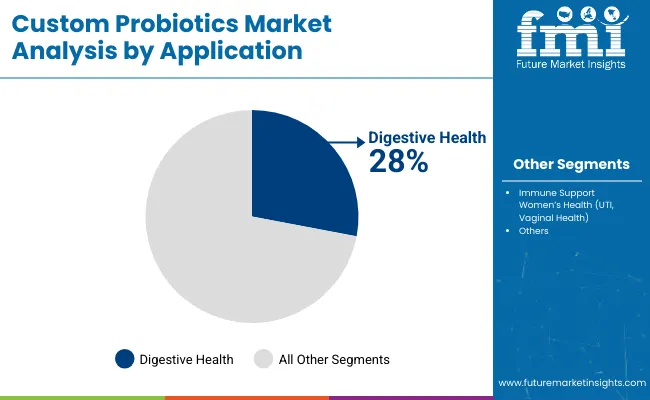
Insights into the Application Segment with Digestive Health Dominating the Demand

Custom Probiotics Market By Application

Application 2025 Share %
Digestive Health 28.0%
Immune Support 20.0%
Women’s Health (UTI, Vaginal Health) 12.0%

Digestive Health is expected to retain its dominant share of 28.0% in 2025, driven by widespread probiotic familiarity and rising cases of functional gastrointestinal disorders. Market penetration has been highest in this segment due to strong consumer trust and frequent recommendations from healthcare professionals.

Immune Support follows closely, benefiting from post-pandemic awareness and increased probiotic prescriptions for immunity modulation. In parallel, Women’s HealthandMental Health & Mood are gaining momentum, supported by expanding clinical literature on the gut-brain and gut-vaginal microbiome axes.

Innovations are increasingly being steered toward multifactorial formulations addressing these interconnected health domains. As end users grow more health-conscious and proactive in prevention, emerging applications such as SkinHealthandPediatric Care are also poised to contribute meaningfully. Strategic formulation will continue to revolve around scientifically validated outcomes, especially in consumer segments where condition-specific efficacy is prioritized.
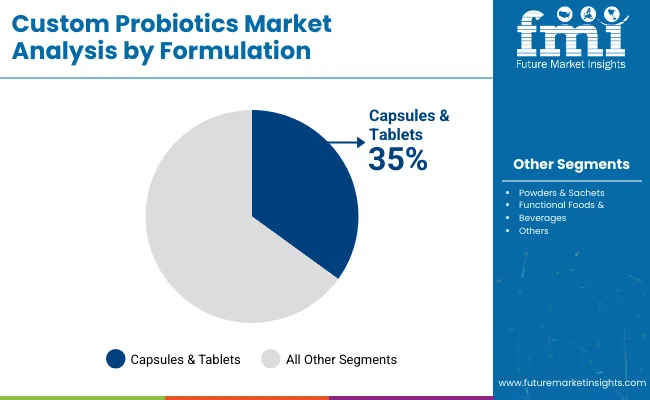
Insights into the Formulation Type Segment with Focus on Capsules & Tablets

Custom Probiotics Market By Formulation

Formulation Type 2025 Share %
Capsules & Tablets 35.0%
Powders & Sachets 20.0%
Functional Foods & Beverages 19.2%

Capsules & Tablets are projected to lead the Formulation Type segment with a commanding 35.0% share in 2025. Their dominance has been sustained by ease of dosing, high consumer familiarity, and superior shelf stability. These formats have become the preferred choice for pharmaceutical-grade custom probiotics due to their compatibility with enteric coatings and precision-release mechanisms. In contrast, formats like Powders & Sachets and Functional Foods & Beverages are registering rapid adoption, especially among younger, convenience-driven consumers seeking lifestyle-integrated health options.

Growth in these segments is being catalyzed by improved strain viability and palatability enhancements. Oral Sprays and Reconstitution Sachets are gaining relevance in pediatric and geriatric segments where swallowing capsules may be challenging. As next-gen delivery innovations are brought to market, formulation strategy is expected to play a critical role in improving adherence, bioavailability, and user engagement across health-focused demographics.

What are the Drivers, Restraints, and Key Trends of the Custom Probiotics?

Rising regulatory scrutiny and clinical validation demands are reshaping how custom probiotics are formulated and positioned, even as global interest accelerates in microbiome-targeted health solutions that promise personalized and measurable outcomes across gut, immune, and mental wellness categories.

AI-Powered Personalization Platforms Are Reshaping Product Development

Market growth is being catalyzed by the integration of AI-driven personalization platforms that match probiotic strains to individual microbiome profiles. Algorithms are now being used to analyze gut sequencing data, dietary habits, and health history to generate real-time probiotic recommendations.

These platforms have enabled custom product formulations to be developed at scale without compromising efficacy. As diagnostic costs decrease and data privacy protocols improve, a higher volume of users is expected to engage with such platforms, transforming product development from R&D-centric to user-centric. This advancement is expected to increase consumer confidence while reducing product return rates and compliance drop-offs.

Clinical-Grade Custom Probiotics Are Gaining Therapeutic Traction

A growing trend has been observed in the repositioning of custom probiotics from general wellness supplements to clinically validated therapeutic adjuncts. Leading manufacturers have begun to collaborate with academic institutions and hospitals to design condition-specific probiotics supported by randomized clinical trials. This shift is not only enhancing regulatory credibility but also opening new reimbursement pathways in integrative medicine.

As probiotic interventions become more targeted, new indications ranging from metabolic syndrome to anxiety are expected to be supported by custom formulations. This trend is positioning the market closer to pharmaceutical-grade therapeutics, potentially redefining the regulatory classification of advanced probiotic solutions.
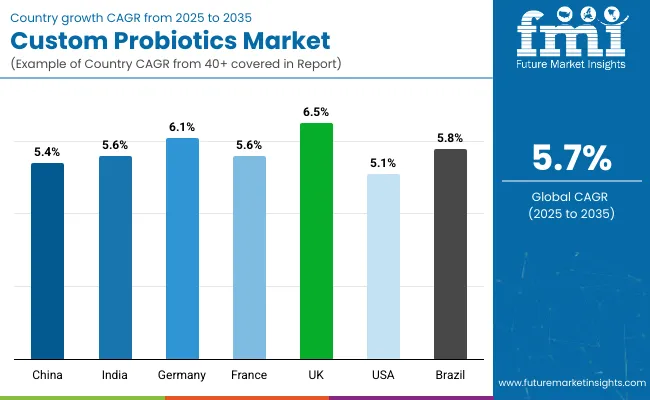
Analysis of Custom Probioticsby Key Countries

Custom Probiotics Market By Country

Countries CAGR
China 5.4%
India 5.6%
Germany 6.1%
France 5.6%
UK 6.5%
USA 5.1%
Brazil 5.8%

Adoption of custom probiotics has been observed to vary widely across countries, shaped by national health priorities, regulatory maturity, and the integration of personalized nutrition into mainstream care pathways. Among key global economies, Europe has emerged as a frontrunner, with the UK projected to record the highest CAGR of 6.5%, followed by Germany at 6.1% and France at 5.6%. This growth has been supported by the region’s clinical validation standards, early integration of microbiome science into healthcare, and a strong consumer shift toward functional and personalized supplementation.

In the Asia-Pacific region, strong forward momentum has been reported in India (5.6%) and China (5.4%), where digital health platforms, D2C wellness brands, and gut health awareness campaigns have significantly expanded addressable markets. India’s rising nutraceutical manufacturing base has also supported export-oriented probiotic innovation. In North America, the United States is expected to post a CAGR of 5.1%, reflecting steady maturity in personalized nutrition platforms and functional food formulations.

Meanwhile, Brazil is gaining attention in Latin America with a projected 5.8% CAGR, fueled by demand in pediatric and digestive health categories. Country-specific regulatory harmonization and digital diagnostics adoption are expected to shape the competitive landscape over the next decade.

Sales Outlook for Custom Probiotics in the United States

Years 2025 2026 2027 2028 2029 2030 2031 2032 2033 2034 2035
USA Custom Probiotics 152.5 161.8 171.3 183.0 193.3 205.0 218.7 233.4 247.1 261.7 276.0

The Custom Probiotics Market in the United States is projected to expand at a CAGR of 6.1% between 2025 and 2035, underpinned by rising consumer demand for condition-specific gut health interventions and the widespread integration of personalized nutrition platforms. Growth has been supported by high digital health literacy, robust e-commerce infrastructure, and the availability of at-home gut microbiome testing kits.

Functional medicine practitioners have increasingly prescribed custom probiotic formulations for digestive, immune, and metabolic health, leading to growing inclusion in patient-centric wellness protocols. Partnerships between diagnostics labs and D2C brands have enabled data-driven customization at scale.

The USA market is also witnessing growth in pediatric and senior health applications, where strain specificity and delivery format innovation are being prioritized. Trends in clean-label formulation, real-time AI-guided dosing, and practitioner-distributed personalized supplements are contributing to higher brand loyalty and consumer lifetime value.

  • Clinician-guided customization is being widely adopted in functional and integrative healthcare.
  • Growth is being supported by DTC testing platforms that enable hyper-personalized probiotic formulation.
  • Pediatric and geriatric-specific delivery formats are gaining traction due to usability and compliance advantages.

Growth and Expansion Outlook for Custom Probiotics in the United Kingdom

The Custom Probiotics Market in the United Kingdom is projected to grow at a CAGR of 6.5% through 2035, fueled by increasing consumer preference for science-backed, personalized wellness solutions. The integration of gut microbiome testing into mainstream health services has been supported by NHS partnerships with digital health platforms.

Functional nutrition has been increasingly prescribed for managing stress, IBS, PCOS, and skin health, boosting clinical probiotic use. Brands offering condition-specific and age-adapted formulations have been widely adopted by health-conscious millennials and seniors alike. Formulation innovations such as dual-release capsules and vegan-friendly options are enhancing differentiation.

  • AI-powered subscription models are being deployed by local wellness startups.
  • Clinical practitioners are incorporating personalized strains into routine care.
  • Regulation is favoring products with EFSA-backed strain claims and traceability.
  • Post-antibiotic gut repair and immune defense have emerged as key use cases.

Growth and Expansion Outlook for Custom Probiotics in India

India’s Custom Probiotics Market is forecasted to expand at a CAGR of 5.6% from 2025 to 2035, driven by growing middle-class health awareness, increased gut health education, and digitization of preventive healthcare. Rising disposable incomes and the mainstreaming of functional nutrition are enabling higher probiotic uptake, particularly in urban and semi-urban centers.

The popularity of sachets, powders, and Ayurvedic-inspired synbiotic blends is enabling mass customization at accessible price points. Meanwhile, India's status as a nutraceutical manufacturing hub is supporting low-cost, high-quality custom probiotic production for both domestic and export markets.

  • Functional foods fortified with probiotics are gaining appeal in modern retail.
  • Microbiome mapping services are being bundled with online consultations.
  • Pediatric and maternal health segments are adopting probiotic sachets widely.
  • B2B manufacturing for global D2C brands is strengthening India's role in exports.

Sales Outlook for Custom Probioticsin China

The Custom Probiotics Market in China is projected to register a CAGR of 5.4% from 2025 to 2035, supported by strong national health-tech infrastructure and early consumer adoption of personalized nutrition. The market is being shaped by digitally native DTC brands offering gut microbiome kits paired with custom supplements.

Demand has surged in digestive, immunity, and skin health segments, especially among young adults and postnatal women. Integration with Traditional Chinese Medicine (TCM) principles has given rise to hybrid probiotic formulas tailored to body constitution types, creating localized innovation opportunities.

  • Cross-border e-commerce platforms are amplifying access to foreign strain patents.
  • AI-based diagnostic engines are matching probiotics to lifestyle profiles.
  • Condition-specific SKUs for women’s hormonal health and children’s immunity are scaling.
  • Regulatory frameworks are evolving to validate product claims and encourage data privacy.

In-depth Analysis of Custom Probioticsin Europe

Countries 2025 2035
UK 18.3% 19.9%
Germany 21.5% 21.6%
Italy 10.5% 11.4%
France 13.3% 13.1%
Spain 11.3% 10.3%
BENELUX 6.2% 5.9%
Nordic 5.7% 5.9%
Rest of Europe 13.1% 11.9%

Germany’s Custom Probiotics Market is expected to grow at a CAGR of 6.1% between 2025 and 2035, driven by high clinical trust, integration of naturopathic protocols, and demand for scientifically validated formulations. Customized probiotics have been adopted as adjunctive therapies in gastroenterology, psychiatry, and dermatology, with strain specificity playing a key role in formulation.

Growth has been further supported by a maturing diagnostics ecosystem and insurer-backed preventive health programs. The availability of pharmacist-guided subscription models is also improving adherence.

  • Universities and biotech firms are co-developing strain-personalization engines.
  • Functional foods with probiotic claims are regulated under high EFSA standards.
  • Mental wellness probiotics are gaining regulatory and practitioner endorsement.
  • Senior-focused products are being reformulated with delayed-release technologies and enhanced viability.

Growth Outlook for Custom Probiotics in Japan

Customization Type 2025 Share %
Strain Specific Formulations 26.0%
Targeted Health Condition Formulations 22.0%
Personalized Gut Microbiome Based Probiotics 14.0%
Multi Strain Blends 23.0%
Single Strain Probiotics 15.0%

The Custom Probiotics Market in Japan is projected to reach USD 26.7 million in 2025, with growth underpinned by the nation’s high health literacy, aging population, and clinical emphasis on digestive and immune support. Strain-Specific Formulations hold the largest share at 26.0%, driven by demand for clinically validated solutions addressing condition-specific symptoms. Close behind, Multi-Strain Blends account for 23.0%, reflecting interest in holistic wellness strategies. Meanwhile, Targeted Health Condition Formulations comprise 22.0%, bolstered by Japan’s rising focus on probiotics for skin health, metabolic function, and mental well-being.

Personalized microbiome-based products remain nascent at 14.0%, yet rapid digitization and AI-enabled diagnostic integration are expected to drive adoption. Custom probiotics are increasingly being positioned as adjuncts in managing chronic lifestyle disorders, particularly among elderly populations.

Formulation development is being guided by Japan’s emphasis on scientific substantiation and functional food regulation under FOSHU. As gut-brain axis research expands and digital diagnostics are embedded in preventive care, greater personalization is expected across probiotic formats.

  • Clinical-grade probiotics dominate, with strain-specific products leading at 26%.
  • Aging population and gut-brain research are key adoption catalysts.
  • FOSHU regulations and AI-powered gut testing are shaping personalization trends.

Opportunity Analysis of South Korea Custom Probiotics

Application Segment Market Value Share, 2025
Digestive Health 30.0%
Immune Support 20.0%
Women’s Health (UTI, Vaginal Health) 12.0%
Mental Health & Mood (Gut Brain Axis) 9.0%
Skin Health 7.0%
Pediatric & Infant Health 10.0%
Metabolic Health 7.0%
Oral Health 5.0%

The Custom Probiotics Market in South Korea is projected to reach USD 15.3 million in 2025, led by growing consumer awareness of microbiome-linked wellness and a digitally sophisticated health ecosystem. Digestive Health is expected to remain the dominant application at 30.0%, reflecting its deep-rooted presence in daily dietary routines and its widespread clinical recommendation. Immune Support follows at 20.0%, bolstered by post-pandemic resilience trends and increased demand for daily immunity boosters.

Notably, Women’s Health and Mental Health & Mood applications are witnessing rapid acceleration, with CAGRs of 9.3% and 9.5%, respectively. These categories are being supported by expanding R&D into the gut-brain and gut-vaginal axes and by the adoption of condition-specific probiotic solutions through pharmacies and direct-to-consumer channels.

Consumer preference for beauty-from-within solutions is also propelling growth in Skin Health probiotics, especially among younger women. Meanwhile, Pediatric and Infant Health is gaining traction through age-specific delivery formats such as drops and sachets.

  • South Korea is emerging as a precision-driven probiotic innovation hub in East Asia.
  • Mental wellness and women's health applications are outpacing core digestive segments.
  • Consumer trust in pharmacy-endorsed formulations is accelerating high-value purchases.
  • Functional skin probiotics are gaining popularity through beauty and wellness convergence.

Competitive Landscape of Custom Probiotics

Frontrunners Global Value Share 2025
Novonesis 11%
Others 89%

The Custom Probiotics Market is moderately fragmented, with a blend of global biotech leaders, mid-sized innovators, and specialist formulators competing across therapeutic and wellness-driven application areas. Industry frontrunners such as DSM (including OptiBiotix), DuPont Nutrition & Health, and Chr. Hansen hold significant share, enabled by their proprietary strain libraries, clinical trial infrastructure, and vertically integrated manufacturing. Their strategies are increasingly centered on AI-guided personalization engines, microbiome diagnostics, and clinically backed strain portfolios tailored to condition-specific outcomes.

Established mid-sized players such as Probi AB, Winclove Probiotics, and BioGaia have focused on targeted formulations for immune, pediatric, and mental wellness. Partnerships with healthcare practitioners and e-pharmacies are being used to scale personalized delivery. These players are advancing competitive differentiation through spore-forming technologies, enteric coatings, and adaptive delivery formats.

Specialized providers like Lallemand Health Solutions, Yakult Honsha, Probiotec Group, and Seroyal operate with strong regional presence and formulation agility. Custom blends for niche needs such as UTI prevention, oral microbiome balance, or gut-brain axis modulation are being developed for practitioner-exclusive or direct-to-consumer (D2C) distribution.

Competitive advantage is shifting toward integrated personalization ecosystems that connect diagnostic platforms with dynamic probiotic recommendations, backed by subscription services, remote consultations, and digital adherence tracking.

Key Developments in Custom Probiotics

  • In April 2025, Lallemand Health Solutions and FrieslandCampina Ingredients jointly advanced their Natural PRO‑Digest synbiotic solution, combining prebiotic GOS‑OP with probiotic B. lactis Lafti B94. Synergistic gut‑health effects were validated in mechanistic studies, marking increased momentum in clinically substantiated synbiotic innovation.
  • In March 2025, Creative Biolabs announced leadership in next‑generation probiotic development, emphasizing engineered strains such as Akkermansia muciniphila and Bacteroides species. Strain engineering using CRISPR and metagenomics for immunomodulatory and metabolic applications was deployed, fueling innovation at the strain-design frontier.

Scope of the Report

Item Value
Quantitative Units USD 635.6 Million
Customization Type Strain-Specific Formulations, Multi-Strain Blends, Single-Strain Probiotics, Targeted Health Condition Formulations, Personalized Gut Microbiome-Based Probiotics
Application Digestive Health, Immune Support, Women’s Health (UTI, Vaginal Health), Mental Health & Mood (Gut-Brain Axis), Skin Health, Pediatric & Infant Health, Metabolic Health, Oral Health
Formulation Type Capsules & Tablets, Powders & Sachets, Functional Foods & Beverages, Oral Sprays & Lozenges, Sachets for Reconstitution
Delivery Technology Enteric-Coated Probiotics, Spore-Forming Probiotics, Microencapsulated Probiotics, Symbiotic s (Probiotics + Prebiotics)
Sales Channel Pharmacies & Drugstores, Nutraceutical & Supplement Manufacturers (B2B), Research Institutions & Laboratories, Cosmetic Ingredient Suppliers, Online Retail
End User General Adult Consumers, Infants & Children, Seniors, Patients with Specific Health Conditions
Regions Covered North America, Europe, Asia-Pacific, Latin America, Middle East & Africa
Country Covered United States, Canada, Germany, France, United Kingdom, China, Japan, India, Brazil, South Africa
Key Companies Profiled Novonesis, DSM-Firmenich, DuPont Nutrition & Health, BioGaia, Lallemand Health Solutions, Probi AB, Winclove Probiotics, Yakult Honsha, Probiotec Group, Seroyal
Additional Attributes Segment-wise dollar sales by customization and delivery type, growing D2C and personalized health adoption, clinical trial-backed strain development, microbiome diagnostics integration, growth in AI-powered personalization engines, subscription models for recurring probiotic delivery, pediatric and women’s health focus, and regulation trends across N orth America, Europe, and APAC.

Key Segments

By Customization Type:

  • Strain-Specific Formulations
  • Targeted Health Condition Formulations
  • Personalized Gut Microbiome-Based Probiotics
  • Multi-Strain Blends
  • Single-Strain Probiotics

By Application:

  • Digestive Health
  • Immune Support
  • Women’s Health (UTI, Vaginal Health)
  • Mental Health & Mood (Gut-Brain Axis)
  • Skin Health
  • Pediatric & Infant Health
  • Metabolic Health
  • Oral Health

By Formulation Type:

  • Capsules & Tablets
  • Powders & Sachets
  • Functional Foods & Beverages
  • Oral Sprays & Lozenges
  • Sachets for Reconstitution

By Delivery Technology:

  • Enteric-Coated Probiotics
  • Spore-Forming Probiotics
  • Microencapsulated Probiotics
  • Synbiotics (Probiotics + Prebiotics)

By Sales Channel:

  • Direct-to-Consumer (D2C)
  • Health & Nutrition Stores
  • Pharmacies & Drugstores
  • Online Retail
  • B2B Supply to Supplement Brands & Healthcare Providers

By End User:

  • General Adult Consumers
  • Infants & Children
  • Seniors
  • Patients with Specific Health Conditions

By Region:

  • North America
  • Latin America
  • Europe
  • East Asia
  • South Asia & Pacific
  • Middle East and Africa

Table of Content

  1. Executive Summary
    • Global Market Outlook
    • Demand-side Trends
    • Supply-side Trends
    • Technology Roadmap Analysis
    • Analysis and Recommendations
  2. Market Overview
    • Market Coverage / Taxonomy
    • Market Definition / Scope / Limitations
  3. Market Background
    • Market Dynamics
      • Drivers
      • Restraints
      • Opportunity
      • Trends
    • Scenario Forecast
      • Demand in Optimistic Scenario
      • Demand in Likely Scenario
      • Demand in Conservative Scenario
    • Opportunity Map Analysis
    • Product Life Cycle Analysis
    • Supply Chain Analysis
    • Investment Feasibility Matrix
    • Value Chain Analysis
    • PESTLE and Porter’s Analysis
    • Regulatory Landscape
    • Regional Parent Market Outlook
    • Production and Consumption Statistics
    • Import and Export Statistics
  4. Global Market Analysis 2020 to 2024 and Forecast, 2025 to 2035
    • Historical Market Size Value (USD Million) & Volume (Units) Analysis, 2020 to 2024
    • Current and Future Market Size Value (USD Million) & Volume (Units) Projections, 2025 to 2035
      • Y-o-Y Growth Trend Analysis
      • Absolute $ Opportunity Analysis
  5. Global Market Pricing Analysis 2020 to 2024 and Forecast 2025 to 2035
  6. Global Market Analysis 2020 to 2024 and Forecast 2025 to 2035, By Customization Type
    • Introduction / Key Findings
    • Historical Market Size Value (USD Million) & Volume (Units) Analysis By Customization Type, 2020 to 2024
    • Current and Future Market Size Value (USD Million) & Volume (Units) Analysis and Forecast By Customization Type, 2025 to 2035
      • Strain-Specific Formulations
      • Targeted Health Condition Formulations
      • Personalized Gut Microbiome-Based Probiotics
      • Multi-Strain Blends
      • Single-Strain Probiotics
    • Y-o-Y Growth Trend Analysis By Customization Type, 2020 to 2024
    • Absolute $ Opportunity Analysis By Customization Type, 2025 to 2035
  7. Global Market Analysis 2020 to 2024 and Forecast 2025 to 2035, By Application
    • Introduction / Key Findings
    • Historical Market Size Value (USD Million) & Volume (Units) Analysis By Application, 2020 to 2024
    • Current and Future Market Size Value (USD Million) & Volume (Units) Analysis and Forecast By Application, 2025 to 2035
      • Digestive Health
      • Immune Support
      • Women’s Health (UTI, Vaginal Health)
      • Mental Health & Mood (Gut-Brain Axis)
      • Skin Health
      • Pediatric & Infant Health
      • Metabolic Health
      • Oral Health
    • Y-o-Y Growth Trend Analysis By Application, 2020 to 2024
    • Absolute $ Opportunity Analysis By Application, 2025 to 2035
  8. Global Market Analysis 2020 to 2024 and Forecast 2025 to 2035, By Formulation Type
    • Introduction / Key Findings
    • Historical Market Size Value (USD Million) & Volume (Units) Analysis By Formulation Type, 2020 to 2024
    • Current and Future Market Size Value (USD Million) & Volume (Units) Analysis and Forecast By Formulation Type, 2025 to 2035
      • Capsules & Tablets
      • Powders & Sachets
      • Functional Foods & Beverages
      • Oral Sprays & Lozenges
      • Sachets for Reconstitution
    • Y-o-Y Growth Trend Analysis By Formulation Type, 2020 to 2024
    • Absolute $ Opportunity Analysis By Formulation Type, 2025 to 2035
  9. Global Market Analysis 2020 to 2024 and Forecast 2025 to 2035, By Delivery Technology
    • Introduction / Key Findings
    • Historical Market Size Value (USD Million) & Volume (Units) Analysis By Delivery Technology, 2020 to 2024
    • Current and Future Market Size Value (USD Million) & Volume (Units) Analysis and Forecast By Delivery Technology, 2025 to 2035
      • Enteric-Coated Probiotics
      • Spore-Forming Probiotics
      • Microencapsulated Probiotics
      • Synbiotics (Probiotics + Prebiotics)
    • Y-o-Y Growth Trend Analysis By Delivery Technology, 2020 to 2024
    • Absolute $ Opportunity Analysis By Delivery Technology, 2025 to 2035
  10. Global Market Analysis 2020 to 2024 and Forecast 2025 to 2035, By Sales Channel
    • Introduction / Key Findings
    • Historical Market Size Value (USD Million) & Volume (Units) Analysis By Sales Channel, 2020 to 2024
    • Current and Future Market Size Value (USD Million) & Volume (Units) Analysis and Forecast By Sales Channel, 2025 to 2035
      • Direct-to-Consumer (D2C)
      • Health & Nutrition Stores
      • Pharmacies & Drugstores
      • Online Retail
      • B2B Supply to Supplement Brands & Healthcare Providers
    • Y-o-Y Growth Trend Analysis By Sales Channel, 2020 to 2024
    • Absolute $ Opportunity Analysis By Sales Channel, 2025 to 2035
  11. Global Market Analysis 2020 to 2024 and Forecast 2025 to 2035, By End User
    • Introduction / Key Findings
    • Historical Market Size Value (USD Million) & Volume (Units) Analysis By End User, 2020 to 2024
    • Current and Future Market Size Value (USD Million) & Volume (Units) Analysis and Forecast By End User, 2025 to 2035
      • General Adult Consumers
      • Infants & Children
      • Seniors
      • Patients with Specific Health Conditions
    • Y-o-Y Growth Trend Analysis By End User, 2020 to 2024
    • Absolute $ Opportunity Analysis By End User, 2025 to 2035
  12. Global Market Analysis 2020 to 2024 and Forecast 2025 to 2035, By Region
    • Introduction
    • Historical Market Size Value (USD Million) & Volume (Units) Analysis By Region, 2020 to 2024
    • Current Market Size Value (USD Million) & Volume (Units) Analysis and Forecast By Region, 2025 to 2035
      • North America
      • Latin America
      • Europe
      • East Asia
      • South Asia & Pacific
      • Middle East and Africa
    • Market Attractiveness Analysis By Region
  13. North America Market Analysis 2020 to 2024 and Forecast 2025 to 2035, By Country
    • Historical Market Size Value (USD Million) & Volume (Units) Trend Analysis By Market Taxonomy, 2020 to 2024
    • Market Size Value (USD Million) & Volume (Units) Forecast By Market Taxonomy, 2025 to 2035
      • By Country
        • USA
        • Canada
      • By Customization Type
      • By Application
      • By Formulation Type
      • By Delivery Technology
      • By Sales Channel
      • By End User
    • Market Attractiveness Analysis
      • By Country
      • By Customization Type
      • By Application
      • By Formulation Type
      • By Delivery Technology
      • By Sales Channel
      • By End User
    • Key Takeaways
  14. Latin America Market Analysis 2020 to 2024 and Forecast 2025 to 2035, By Country
    • Historical Market Size Value (USD Million) & Volume (Units) Trend Analysis By Market Taxonomy, 2020 to 2024
    • Market Size Value (USD Million) & Volume (Units) Forecast By Market Taxonomy, 2025 to 2035
      • By Country
        • Brazil
        • Mexico
        • Colombia
        • Rest of Latin America
      • By Customization Type
      • By Application
      • By Formulation Type
      • By Delivery Technology
      • By Sales Channel
      • By End User
    • Market Attractiveness Analysis
      • By Country
      • By Customization Type
      • By Application
      • By Formulation Type
      • By Delivery Technology
      • By Sales Channel
      • By End User
    • Key Takeaways
  15. Europe Market Analysis 2020 to 2024 and Forecast 2025 to 2035, By Country
    • Historical Market Size Value (USD Million) & Volume (Units) Trend Analysis By Market Taxonomy, 2020 to 2024
    • Market Size Value (USD Million) & Volume (Units) Forecast By Market Taxonomy, 2025 to 2035
      • By Country
        • Germany
        • UK
        • France
        • Italy
        • Spain
        • Belgium
        • Netherlands
        • Nordic
        • Switzerland
        • Russia
        • Poland
        • Rest of Europe
      • By Customization Type
      • By Application
      • By Formulation Type
      • By Delivery Technology
      • By Sales Channel
      • By End User
    • Market Attractiveness Analysis
      • By Country
      • By Customization Type
      • By Application
      • By Formulation Type
      • By Delivery Technology
      • By Sales Channel
      • By End User
    • Key Takeaways
  16. East Asia Market Analysis 2020 to 2024 and Forecast 2025 to 2035, By Country
    • Historical Market Size Value (USD Million) & Volume (Units) Trend Analysis By Market Taxonomy, 2020 to 2024
    • Market Size Value (USD Million) & Volume (Units) Forecast By Market Taxonomy, 2025 to 2035
      • By Country
        • China
        • Japan
        • South Korea
      • By Customization Type
      • By Application
      • By Formulation Type
      • By Delivery Technology
      • By Sales Channel
      • By End User
    • Market Attractiveness Analysis
      • By Country
      • By Customization Type
      • By Application
      • By Formulation Type
      • By Delivery Technology
      • By Sales Channel
      • By End User
    • Key Takeaways
  17. South Asia & Pacific Market Analysis 2020 to 2024 and Forecast 2025 to 2035, By Country
    • Historical Market Size Value (USD Million) & Volume (Units) Trend Analysis By Market Taxonomy, 2020 to 2024
    • Market Size Value (USD Million) & Volume (Units) Forecast By Market Taxonomy, 2025 to 2035
      • By Country
        • India
        • Thailand
        • Malaysia
        • Indonesia
        • Singapore
        • Vietnam
        • Australia
        • New Zealand
        • Rest of South Asia & Pacific
      • By Customization Type
      • By Application
      • By Formulation Type
      • By Delivery Technology
      • By Sales Channel
      • By End User
    • Market Attractiveness Analysis
      • By Country
      • By Customization Type
      • By Application
      • By Formulation Type
      • By Delivery Technology
      • By Sales Channel
      • By End User
    • Key Takeaways
  18. Middle East and Africa Market Analysis 2020 to 2024 and Forecast 2025 to 2035, By Country
    • Historical Market Size Value (USD Million) & Volume (Units) Trend Analysis By Market Taxonomy, 2020 to 2024
    • Market Size Value (USD Million) & Volume (Units) Forecast By Market Taxonomy, 2025 to 2035
      • By Country
        • Turkey
        • UAE
        • Saudi Arabia
        • Israel
        • Other GCC Countries
        • North Africa
        • South Africa
      • By Customization Type
      • By Application
      • By Formulation Type
      • By Delivery Technology
      • By Sales Channel
      • By End User
    • Market Attractiveness Analysis
      • By Country
      • By Customization Type
      • By Application
      • By Formulation Type
      • By Delivery Technology
      • By Sales Channel
      • By End User
    • Key Takeaways
  19. Key Countries Market Analysis
    • U.S
      • Pricing Analysis
      • Market Share Analysis, 2024
        • By Customization Type
        • By Application
        • By Formulation Type
        • By Delivery Technology
        • By Sales Channel
        • By End User
    • Canada
      • Pricing Analysis
      • Market Share Analysis, 2024
        • By Customization Type
        • By Application
        • By Formulation Type
        • By Delivery Technology
        • By Sales Channel
        • By End User
    • Brazil
      • Pricing Analysis
      • Market Share Analysis, 2024
        • By Customization Type
        • By Application
        • By Formulation Type
        • By Delivery Technology
        • By Sales Channel
        • By End User
    • Mexico
      • Pricing Analysis
      • Market Share Analysis, 2024
        • By Customization Type
        • By Application
        • By Formulation Type
        • By Delivery Technology
        • By Sales Channel
        • By End User
    • Germany
      • Pricing Analysis
      • Market Share Analysis, 2024
        • By Customization Type
        • By Application
        • By Formulation Type
        • By Delivery Technology
        • By Sales Channel
        • By End User
    • UK
      • Pricing Analysis
      • Market Share Analysis, 2024
        • By Customization Type
        • By Application
        • By Formulation Type
        • By Delivery Technology
        • By Sales Channel
        • By End User
    • France
      • Pricing Analysis
      • Market Share Analysis, 2024
        • By Customization Type
        • By Application
        • By Formulation Type
        • By Delivery Technology
        • By Sales Channel
        • By End User
    • Italy
      • Pricing Analysis
      • Market Share Analysis, 2024
        • By Customization Type
        • By Application
        • By Formulation Type
        • By Delivery Technology
        • By Sales Channel
        • By End User
    • Spain
      • Pricing Analysis
      • Market Share Analysis, 2024
        • By Customization Type
        • By Application
        • By Formulation Type
        • By Delivery Technology
        • By Sales Channel
        • By End User
    • Belgium
      • Pricing Analysis
      • Market Share Analysis, 2024
        • By Customization Type
        • By Application
        • By Formulation Type
        • By Delivery Technology
        • By Sales Channel
        • By End User
    • Netherlands
      • Pricing Analysis
      • Market Share Analysis, 2024
        • By Customization Type
        • By Application
        • By Formulation Type
        • By Delivery Technology
        • By Sales Channel
        • By End User
    • Nordic
      • Pricing Analysis
      • Market Share Analysis, 2024
        • By Customization Type
        • By Application
        • By Formulation Type
        • By Delivery Technology
        • By Sales Channel
        • By End User
    • Switzerland
      • Pricing Analysis
      • Market Share Analysis, 2024
        • By Customization Type
        • By Application
        • By Formulation Type
        • By Delivery Technology
        • By Sales Channel
        • By End User
    • Russia
      • Pricing Analysis
      • Market Share Analysis, 2024
        • By Customization Type
        • By Application
        • By Formulation Type
        • By Delivery Technology
        • By Sales Channel
        • By End User
    • Poland
      • Pricing Analysis
      • Market Share Analysis, 2024
        • By Customization Type
        • By Application
        • By Formulation Type
        • By Delivery Technology
        • By Sales Channel
        • By End User
    • China
      • Pricing Analysis
      • Market Share Analysis, 2024
        • By Customization Type
        • By Application
        • By Formulation Type
        • By Delivery Technology
        • By Sales Channel
        • By End User
    • Japan
      • Pricing Analysis
      • Market Share Analysis, 2024
        • By Customization Type
        • By Application
        • By Formulation Type
        • By Delivery Technology
        • By Sales Channel
        • By End User
    • South Korea
      • Pricing Analysis
      • Market Share Analysis, 2024
        • By Customization Type
        • By Application
        • By Formulation Type
        • By Delivery Technology
        • By Sales Channel
        • By End User
    • India
      • Pricing Analysis
      • Market Share Analysis, 2024
        • By Customization Type
        • By Application
        • By Formulation Type
        • By Delivery Technology
        • By Sales Channel
        • By End User
    • Thailand
      • Pricing Analysis
      • Market Share Analysis, 2024
        • By Customization Type
        • By Application
        • By Formulation Type
        • By Delivery Technology
        • By Sales Channel
        • By End User
    • Malaysia
      • Pricing Analysis
      • Market Share Analysis, 2024
        • By Customization Type
        • By Application
        • By Formulation Type
        • By Delivery Technology
        • By Sales Channel
        • By End User
    • Indonesia
      • Pricing Analysis
      • Market Share Analysis, 2024
        • By Customization Type
        • By Application
        • By Formulation Type
        • By Delivery Technology
        • By Sales Channel
        • By End User
    • Singapore
      • Pricing Analysis
      • Market Share Analysis, 2024
        • By Customization Type
        • By Application
        • By Formulation Type
        • By Delivery Technology
        • By Sales Channel
        • By End User
    • Vietnam
      • Pricing Analysis
      • Market Share Analysis, 2024
        • By Customization Type
        • By Application
        • By Formulation Type
        • By Delivery Technology
        • By Sales Channel
        • By End User
    • Australia
      • Pricing Analysis
      • Market Share Analysis, 2024
        • By Customization Type
        • By Application
        • By Formulation Type
        • By Delivery Technology
        • By Sales Channel
        • By End User
    • New Zealand
      • Pricing Analysis
      • Market Share Analysis, 2024
        • By Customization Type
        • By Application
        • By Formulation Type
        • By Delivery Technology
        • By Sales Channel
        • By End User
    • Turkey
      • Pricing Analysis
      • Market Share Analysis, 2024
        • By Customization Type
        • By Application
        • By Formulation Type
        • By Delivery Technology
        • By Sales Channel
        • By End User
    • UAE
      • Pricing Analysis
      • Market Share Analysis, 2024
        • By Customization Type
        • By Application
        • By Formulation Type
        • By Delivery Technology
        • By Sales Channel
        • By End User
    • Saudi Arabia
      • Pricing Analysis
      • Market Share Analysis, 2024
        • By Customization Type
        • By Application
        • By Formulation Type
        • By Delivery Technology
        • By Sales Channel
        • By End User
    • Israel
      • Pricing Analysis
      • Market Share Analysis, 2024
        • By Customization Type
        • By Application
        • By Formulation Type
        • By Delivery Technology
        • By Sales Channel
        • By End User
  20. Market Structure Analysis
    • Competition Dashboard
    • Competition Benchmarking
    • Market Share Analysis of Top Players
      • By Regional
      • By Customization Type
      • By Application
      • By Formulation Type
      • By Delivery Technology
      • By Sales Channel
      • By End User
  21. Competition Analysis
    • Competition Deep Dive
      • DSM (including OptiBiotix)
        • Overview
        • Product Portfolio
        • Profitability by Market Segments (Product/Age /Sales Channel/Region)
        • Sales Footprint
        • Strategy Overview
        • DuPont Nutrition & Health
        • Chr. Hansen
        • Probi AB
        • Winclove Probiotics
        • BioGaia
        • Lallemand Health Solutions
        • Yakult Honsha
        • Probiotec Group
        • Seroyal
    • Assumptions & Acronyms Used
    • Research Methodology

List of Tables

  • Table 1: Global Market Value (USD Million) Forecast by Region, 2020-2035
  • Table 2: Global Market Volume (MT) Forecast by Region, 2020-2035
  • Table 3: Global Market Value (USD Million) Forecast by Customization Type, 2020-2035
  • Table 4: Global Market Volume (MT) Forecast by Customization Type, 2020-2035
  • Table 5: Global Market Value (USD Million) Forecast by Application, 2020-2035
  • Table 6: Global Market Volume (MT) Forecast by Application, 2020-2035
  • Table 7: Global Market Value (USD Million) Forecast by Formulation Type, 2020-2035
  • Table 8: Global Market Volume (MT) Forecast by Formulation Type, 2020-2035
  • Table 9: Global Market Value (USD Million) Forecast by Delivery Technology, 2020-2035
  • Table 10: Global Market Volume (MT) Forecast by Delivery Technology, 2020-2035
  • Table 11: Global Market Value (USD Million) Forecast by End User, 2020-2035
  • Table 12: Global Market Volume (MT) Forecast by End User, 2020-2035
  • Table 13: Global Market Value (USD Million) Forecast by Sales Channel, 2020-2035
  • Table 14: Global Market Volume (MT) Forecast by Sales Channel, 2020-2035
  • Table 15: North America Market Value (USD Million) Forecast by Country, 2020-2035
  • Table 16: North America Market Volume (MT) Forecast by Country, 2020-2035
  • Table 17: North America Market Value (USD Million) Forecast by Customization Type, 2020-2035
  • Table 18: North America Market Volume (MT) Forecast by Customization Type, 2020-2035
  • Table 19: North America Market Value (USD Million) Forecast by Application, 2020-2035
  • Table 20: North America Market Volume (MT) Forecast by Application, 2020-2035
  • Table 21: North America Market Value (USD Million) Forecast by Formulation Type, 2020-2035
  • Table 22: North America Market Volume (MT) Forecast by Formulation Type, 2020-2035
  • Table 23: North America Market Value (USD Million) Forecast by Delivery Technology, 2020-2035
  • Table 24: North America Market Volume (MT) Forecast by Delivery Technology, 2020-2035
  • Table 25: North America Market Value (USD Million) Forecast by End User, 2020-2035
  • Table 26: North America Market Volume (MT) Forecast by End User, 2020-2035
  • Table 27: North America Market Value (USD Million) Forecast by Sales Channel, 2020-2035
  • Table 28: North America Market Volume (MT) Forecast by Sales Channel, 2020-2035
  • Table 29: Latin America Market Value (USD Million) Forecast by Country, 2020-2035
  • Table 30: Latin America Market Volume (MT) Forecast by Country, 2020-2035
  • Table 31: Latin America Market Value (USD Million) Forecast by Customization Type, 2020-2035
  • Table 32: Latin America Market Volume (MT) Forecast by Customization Type, 2020-2035
  • Table 33: Latin America Market Value (USD Million) Forecast by Application, 2020-2035
  • Table 34: Latin America Market Volume (MT) Forecast by Application, 2020-2035
  • Table 35: Latin America Market Value (USD Million) Forecast by Formulation Type, 2020-2035
  • Table 36: Latin America Market Volume (MT) Forecast by Formulation Type, 2020-2035
  • Table 37: Latin America Market Value (USD Million) Forecast by Delivery Technology, 2020-2035
  • Table 38: Latin America Market Volume (MT) Forecast by Delivery Technology, 2020-2035
  • Table 39: Latin America Market Value (USD Million) Forecast by End User, 2020-2035
  • Table 40: Latin America Market Volume (MT) Forecast by End User, 2020-2035
  • Table 41: Latin America Market Value (USD Million) Forecast by Sales Channel, 2020-2035
  • Table 42: Latin America Market Volume (MT) Forecast by Sales Channel, 2020-2035
  • Table 43: Europe Market Value (USD Million) Forecast by Country, 2020-2035
  • Table 44: Europe Market Volume (MT) Forecast by Country, 2020-2035
  • Table 45: Europe Market Value (USD Million) Forecast by Customization Type, 2020-2035
  • Table 46: Europe Market Volume (MT) Forecast by Customization Type, 2020-2035
  • Table 47: Europe Market Value (USD Million) Forecast by Application, 2020-2035
  • Table 48: Europe Market Volume (MT) Forecast by Application, 2020-2035
  • Table 49: Europe Market Value (USD Million) Forecast by Formulation Type, 2020-2035
  • Table 50: Europe Market Volume (MT) Forecast by Formulation Type, 2020-2035
  • Table 51: Europe Market Value (USD Million) Forecast by Delivery Technology, 2020-2035
  • Table 52: Europe Market Volume (MT) Forecast by Delivery Technology, 2020-2035
  • Table 53: Europe Market Value (USD Million) Forecast by End User, 2020-2035
  • Table 54: Europe Market Volume (MT) Forecast by End User, 2020-2035
  • Table 55: Europe Market Value (USD Million) Forecast by Sales Channel, 2020-2035
  • Table 56: Europe Market Volume (MT) Forecast by Sales Channel, 2020-2035
  • Table 57: East Asia Market Value (USD Million) Forecast by Country, 2020-2035
  • Table 58: East Asia Market Volume (MT) Forecast by Country, 2020-2035
  • Table 59: East Asia Market Value (USD Million) Forecast by Customization Type, 2020-2035
  • Table 60: East Asia Market Volume (MT) Forecast by Customization Type, 2020-2035
  • Table 61: East Asia Market Value (USD Million) Forecast by Application, 2020-2035
  • Table 62: East Asia Market Volume (MT) Forecast by Application, 2020-2035
  • Table 63: East Asia Market Value (USD Million) Forecast by Formulation Type, 2020-2035
  • Table 64: East Asia Market Volume (MT) Forecast by Formulation Type, 2020-2035
  • Table 65: East Asia Market Value (USD Million) Forecast by Delivery Technology, 2020-2035
  • Table 66: East Asia Market Volume (MT) Forecast by Delivery Technology, 2020-2035
  • Table 67: East Asia Market Value (USD Million) Forecast by End User, 2020-2035
  • Table 68: East Asia Market Volume (MT) Forecast by End User, 2020-2035
  • Table 69: East Asia Market Value (USD Million) Forecast by Sales Channel, 2020-2035
  • Table 70: East Asia Market Volume (MT) Forecast by Sales Channel, 2020-2035
  • Table 71: South Asia & Pacific Market Value (USD Million) Forecast by Country, 2020-2035
  • Table 72: South Asia & Pacific Market Volume (MT) Forecast by Country, 2020-2035
  • Table 73: South Asia & Pacific Market Value (USD Million) Forecast by Customization Type, 2020-2035
  • Table 74: South Asia & Pacific Market Volume (MT) Forecast by Customization Type, 2020-2035
  • Table 75: South Asia & Pacific Market Value (USD Million) Forecast by Application, 2020-2035
  • Table 76: South Asia & Pacific Market Volume (MT) Forecast by Application, 2020-2035
  • Table 77: South Asia & Pacific Market Value (USD Million) Forecast by Formulation Type, 2020-2035
  • Table 78: South Asia & Pacific Market Volume (MT) Forecast by Formulation Type, 2020-2035
  • Table 79: South Asia & Pacific Market Value (USD Million) Forecast by Delivery Technology, 2020-2035
  • Table 80: South Asia & Pacific Market Volume (MT) Forecast by Delivery Technology, 2020-2035
  • Table 81: South Asia & Pacific Market Value (USD Million) Forecast by End User, 2020-2035
  • Table 82: South Asia & Pacific Market Volume (MT) Forecast by End User, 2020-2035
  • Table 83: South Asia & Pacific Market Value (USD Million) Forecast by Sales Channel, 2020-2035
  • Table 84: South Asia & Pacific Market Volume (MT) Forecast by Sales Channel, 2020-2035
  • Table 85: MEA Market Value (USD Million) Forecast by Country, 2020-2035
  • Table 86: MEA Market Volume (MT) Forecast by Country, 2020-2035
  • Table 87: MEA Market Value (USD Million) Forecast by Customization Type, 2020-2035
  • Table 88: MEA Market Volume (MT) Forecast by Customization Type, 2020-2035
  • Table 89: MEA Market Value (USD Million) Forecast by Application, 2020-2035
  • Table 90: MEA Market Volume (MT) Forecast by Application, 2020-2035
  • Table 91: MEA Market Value (USD Million) Forecast by Formulation Type, 2020-2035
  • Table 92: MEA Market Volume (MT) Forecast by Formulation Type, 2020-2035
  • Table 93: MEA Market Value (USD Million) Forecast by Delivery Technology, 2020-2035
  • Table 94: MEA Market Volume (MT) Forecast by Delivery Technology, 2020-2035
  • Table 95: MEA Market Value (USD Million) Forecast by End User, 2020-2035
  • Table 96: MEA Market Volume (MT) Forecast by End User, 2020-2035
  • Table 97: MEA Market Value (USD Million) Forecast by Sales Channel, 2020-2035
  • Table 98: MEA Market Volume (MT) Forecast by Sales Channel, 2020-2035

List of Figures

  • Figure 1: Global Market Value (US$ Mn) by Customization Type, 2025-2035
  • Figure 2: Global Market Value (US$ Mn) by Application, 2025-2035
  • Figure 3: Global Market Value (US$ Mn) by Formulation Type, 2025-2035
  • Figure 4: Global Market Value (US$ Mn) by Delivery Technology, 2025-2035
  • Figure 5: Global Market Value (US$ Mn) by End User, 2025-2035
  • Figure 6: Global Market Value (US$ Mn) by Sales Channel, 2025-2035
  • Figure 7: Global Market Value (US$ Mn) by Region, 2025-2035
  • Figure 8: Global Market Value (US$ Mn) Analysis by Region, 2020-2035
  • Figure 9: Global Market Volume (MT) Analysis by Region, 2020-2035
  • Figure 10: Global Market Value Share (%) and BPS Analysis by Region, 2025-2035
  • Figure 11: Global Market Y-o-Y Growth (%) Projections by Region, 2025-2035
  • Figure 12: Global Market Value (US$ Mn) Analysis by Customization Type, 2020-2035
  • Figure 13: Global Market Volume (MT) Analysis by Customization Type, 2020-2035
  • Figure 14: Global Market Value Share (%) and BPS Analysis by Customization Type, 2025-2035
  • Figure 15: Global Market Y-o-Y Growth (%) Projections by Customization Type, 2025-2035
  • Figure 16: Global Market Value (US$ Mn) Analysis by Application, 2020-2035
  • Figure 17: Global Market Volume (MT) Analysis by Application, 2020-2035
  • Figure 18: Global Market Value Share (%) and BPS Analysis by Application, 2025-2035
  • Figure 19: Global Market Y-o-Y Growth (%) Projections by Application, 2025-2035
  • Figure 20: Global Market Value (US$ Mn) Analysis by Formulation Type, 2020-2035
  • Figure 21: Global Market Volume (MT) Analysis by Formulation Type, 2020-2035
  • Figure 22: Global Market Value Share (%) and BPS Analysis by Formulation Type, 2025-2035
  • Figure 23: Global Market Y-o-Y Growth (%) Projections by Formulation Type, 2025-2035
  • Figure 24: Global Market Value (US$ Mn) Analysis by Delivery Technology, 2020-2035
  • Figure 25: Global Market Volume (MT) Analysis by Delivery Technology, 2020-2035
  • Figure 26: Global Market Value Share (%) and BPS Analysis by Delivery Technology, 2025-2035
  • Figure 27: Global Market Y-o-Y Growth (%) Projections by Delivery Technology, 2025-2035
  • Figure 28: Global Market Value (US$ Mn) Analysis by End User, 2020-2035
  • Figure 29: Global Market Volume (MT) Analysis by End User, 2020-2035
  • Figure 30: Global Market Value Share (%) and BPS Analysis by End User, 2025-2035
  • Figure 31: Global Market Y-o-Y Growth (%) Projections by End User, 2025-2035
  • Figure 32: Global Market Value (US$ Mn) Analysis by Sales Channel, 2020-2035
  • Figure 33: Global Market Volume (MT) Analysis by Sales Channel, 2020-2035
  • Figure 34: Global Market Value Share (%) and BPS Analysis by Sales Channel, 2025-2035
  • Figure 35: Global Market Y-o-Y Growth (%) Projections by Sales Channel, 2025-2035
  • Figure 36: Global Market Attractiveness by Customization Type, 2025-2035
  • Figure 37: Global Market Attractiveness by Application, 2025-2035
  • Figure 38: Global Market Attractiveness by Formulation Type, 2025-2035
  • Figure 39: Global Market Attractiveness by Delivery Technology, 2025-2035
  • Figure 40: Global Market Attractiveness by End User, 2025-2035
  • Figure 41: Global Market Attractiveness by Sales Channel, 2025-2035
  • Figure 42: Global Market Attractiveness by Region, 2025-2035
  • Figure 43: North America Market Value (US$ Mn) by Customization Type, 2025-2035
  • Figure 44: North America Market Value (US$ Mn) by Application, 2025-2035
  • Figure 45: North America Market Value (US$ Mn) by Formulation Type, 2025-2035
  • Figure 46: North America Market Value (US$ Mn) by Delivery Technology, 2025-2035
  • Figure 47: North America Market Value (US$ Mn) by End User, 2025-2035
  • Figure 48: North America Market Value (US$ Mn) by Sales Channel, 2025-2035
  • Figure 49: North America Market Value (US$ Mn) by Country, 2025-2035
  • Figure 50: North America Market Value (US$ Mn) Analysis by Country, 2020-2035
  • Figure 51: North America Market Volume (MT) Analysis by Country, 2020-2035
  • Figure 52: North America Market Value Share (%) and BPS Analysis by Country, 2025-2035
  • Figure 53: North America Market Y-o-Y Growth (%) Projections by Country, 2025-2035
  • Figure 54: North America Market Value (US$ Mn) Analysis by Customization Type, 2020-2035
  • Figure 55: North America Market Volume (MT) Analysis by Customization Type, 2020-2035
  • Figure 56: North America Market Value Share (%) and BPS Analysis by Customization Type, 2025-2035
  • Figure 57: North America Market Y-o-Y Growth (%) Projections by Customization Type, 2025-2035
  • Figure 58: North America Market Value (US$ Mn) Analysis by Application, 2020-2035
  • Figure 59: North America Market Volume (MT) Analysis by Application, 2020-2035
  • Figure 60: North America Market Value Share (%) and BPS Analysis by Application, 2025-2035
  • Figure 61: North America Market Y-o-Y Growth (%) Projections by Application, 2025-2035
  • Figure 62: North America Market Value (US$ Mn) Analysis by Formulation Type, 2020-2035
  • Figure 63: North America Market Volume (MT) Analysis by Formulation Type, 2020-2035
  • Figure 64: North America Market Value Share (%) and BPS Analysis by Formulation Type, 2025-2035
  • Figure 65: North America Market Y-o-Y Growth (%) Projections by Formulation Type, 2025-2035
  • Figure 66: North America Market Value (US$ Mn) Analysis by Delivery Technology, 2020-2035
  • Figure 67: North America Market Volume (MT) Analysis by Delivery Technology, 2020-2035
  • Figure 68: North America Market Value Share (%) and BPS Analysis by Delivery Technology, 2025-2035
  • Figure 69: North America Market Y-o-Y Growth (%) Projections by Delivery Technology, 2025-2035
  • Figure 70: North America Market Value (US$ Mn) Analysis by End User, 2020-2035
  • Figure 71: North America Market Volume (MT) Analysis by End User, 2020-2035
  • Figure 72: North America Market Value Share (%) and BPS Analysis by End User, 2025-2035
  • Figure 73: North America Market Y-o-Y Growth (%) Projections by End User, 2025-2035
  • Figure 74: North America Market Value (US$ Mn) Analysis by Sales Channel, 2020-2035
  • Figure 75: North America Market Volume (MT) Analysis by Sales Channel, 2020-2035
  • Figure 76: North America Market Value Share (%) and BPS Analysis by Sales Channel, 2025-2035
  • Figure 77: North America Market Y-o-Y Growth (%) Projections by Sales Channel, 2025-2035
  • Figure 78: North America Market Attractiveness by Customization Type, 2025-2035
  • Figure 79: North America Market Attractiveness by Application, 2025-2035
  • Figure 80: North America Market Attractiveness by Formulation Type, 2025-2035
  • Figure 81: North America Market Attractiveness by Delivery Technology, 2025-2035
  • Figure 82: North America Market Attractiveness by End User, 2025-2035
  • Figure 83: North America Market Attractiveness by Sales Channel, 2025-2035
  • Figure 84: North America Market Attractiveness by Country, 2025-2035
  • Figure 85: Latin America Market Value (US$ Mn) by Customization Type, 2025-2035
  • Figure 86: Latin America Market Value (US$ Mn) by Application, 2025-2035
  • Figure 87: Latin America Market Value (US$ Mn) by Formulation Type, 2025-2035
  • Figure 88: Latin America Market Value (US$ Mn) by Delivery Technology, 2025-2035
  • Figure 89: Latin America Market Value (US$ Mn) by End User, 2025-2035
  • Figure 90: Latin America Market Value (US$ Mn) by Sales Channel, 2025-2035
  • Figure 91: Latin America Market Value (US$ Mn) by Country, 2025-2035
  • Figure 92: Latin America Market Value (US$ Mn) Analysis by Country, 2020-2035
  • Figure 93: Latin America Market Volume (MT) Analysis by Country, 2020-2035
  • Figure 94: Latin America Market Value Share (%) and BPS Analysis by Country, 2025-2035
  • Figure 95: Latin America Market Y-o-Y Growth (%) Projections by Country, 2025-2035
  • Figure 96: Latin America Market Value (US$ Mn) Analysis by Customization Type, 2020-2035
  • Figure 97: Latin America Market Volume (MT) Analysis by Customization Type, 2020-2035
  • Figure 98: Latin America Market Value Share (%) and BPS Analysis by Customization Type, 2025-2035
  • Figure 99: Latin America Market Y-o-Y Growth (%) Projections by Customization Type, 2025-2035
  • Figure 100: Latin America Market Value (US$ Mn) Analysis by Application, 2020-2035
  • Figure 101: Latin America Market Volume (MT) Analysis by Application, 2020-2035
  • Figure 102: Latin America Market Value Share (%) and BPS Analysis by Application, 2025-2035
  • Figure 103: Latin America Market Y-o-Y Growth (%) Projections by Application, 2025-2035
  • Figure 104: Latin America Market Value (US$ Mn) Analysis by Formulation Type, 2020-2035
  • Figure 105: Latin America Market Volume (MT) Analysis by Formulation Type, 2020-2035
  • Figure 106: Latin America Market Value Share (%) and BPS Analysis by Formulation Type, 2025-2035
  • Figure 107: Latin America Market Y-o-Y Growth (%) Projections by Formulation Type, 2025-2035
  • Figure 108: Latin America Market Value (US$ Mn) Analysis by Delivery Technology, 2020-2035
  • Figure 109: Latin America Market Volume (MT) Analysis by Delivery Technology, 2020-2035
  • Figure 110: Latin America Market Value Share (%) and BPS Analysis by Delivery Technology, 2025-2035
  • Figure 111: Latin America Market Y-o-Y Growth (%) Projections by Delivery Technology, 2025-2035
  • Figure 112: Latin America Market Value (US$ Mn) Analysis by End User, 2020-2035
  • Figure 113: Latin America Market Volume (MT) Analysis by End User, 2020-2035
  • Figure 114: Latin America Market Value Share (%) and BPS Analysis by End User, 2025-2035
  • Figure 115: Latin America Market Y-o-Y Growth (%) Projections by End User, 2025-2035
  • Figure 116: Latin America Market Value (US$ Mn) Analysis by Sales Channel, 2020-2035
  • Figure 117: Latin America Market Volume (MT) Analysis by Sales Channel, 2020-2035
  • Figure 118: Latin America Market Value Share (%) and BPS Analysis by Sales Channel, 2025-2035
  • Figure 119: Latin America Market Y-o-Y Growth (%) Projections by Sales Channel, 2025-2035
  • Figure 120: Latin America Market Attractiveness by Customization Type, 2025-2035
  • Figure 121: Latin America Market Attractiveness by Application, 2025-2035
  • Figure 122: Latin America Market Attractiveness by Formulation Type, 2025-2035
  • Figure 123: Latin America Market Attractiveness by Delivery Technology, 2025-2035
  • Figure 124: Latin America Market Attractiveness by End User, 2025-2035
  • Figure 125: Latin America Market Attractiveness by Sales Channel, 2025-2035
  • Figure 126: Latin America Market Attractiveness by Country, 2025-2035
  • Figure 127: Europe Market Value (US$ Mn) by Customization Type, 2025-2035
  • Figure 128: Europe Market Value (US$ Mn) by Application, 2025-2035
  • Figure 129: Europe Market Value (US$ Mn) by Formulation Type, 2025-2035
  • Figure 130: Europe Market Value (US$ Mn) by Delivery Technology, 2025-2035
  • Figure 131: Europe Market Value (US$ Mn) by End User, 2025-2035
  • Figure 132: Europe Market Value (US$ Mn) by Sales Channel, 2025-2035
  • Figure 133: Europe Market Value (US$ Mn) by Country, 2025-2035
  • Figure 134: Europe Market Value (US$ Mn) Analysis by Country, 2020-2035
  • Figure 135: Europe Market Volume (MT) Analysis by Country, 2020-2035
  • Figure 136: Europe Market Value Share (%) and BPS Analysis by Country, 2025-2035
  • Figure 137: Europe Market Y-o-Y Growth (%) Projections by Country, 2025-2035
  • Figure 138: Europe Market Value (US$ Mn) Analysis by Customization Type, 2020-2035
  • Figure 139: Europe Market Volume (MT) Analysis by Customization Type, 2020-2035
  • Figure 140: Europe Market Value Share (%) and BPS Analysis by Customization Type, 2025-2035
  • Figure 141: Europe Market Y-o-Y Growth (%) Projections by Customization Type, 2025-2035
  • Figure 142: Europe Market Value (US$ Mn) Analysis by Application, 2020-2035
  • Figure 143: Europe Market Volume (MT) Analysis by Application, 2020-2035
  • Figure 144: Europe Market Value Share (%) and BPS Analysis by Application, 2025-2035
  • Figure 145: Europe Market Y-o-Y Growth (%) Projections by Application, 2025-2035
  • Figure 146: Europe Market Value (US$ Mn) Analysis by Formulation Type, 2020-2035
  • Figure 147: Europe Market Volume (MT) Analysis by Formulation Type, 2020-2035
  • Figure 148: Europe Market Value Share (%) and BPS Analysis by Formulation Type, 2025-2035
  • Figure 149: Europe Market Y-o-Y Growth (%) Projections by Formulation Type, 2025-2035
  • Figure 150: Europe Market Value (US$ Mn) Analysis by Delivery Technology, 2020-2035
  • Figure 151: Europe Market Volume (MT) Analysis by Delivery Technology, 2020-2035
  • Figure 152: Europe Market Value Share (%) and BPS Analysis by Delivery Technology, 2025-2035
  • Figure 153: Europe Market Y-o-Y Growth (%) Projections by Delivery Technology, 2025-2035
  • Figure 154: Europe Market Value (US$ Mn) Analysis by End User, 2020-2035
  • Figure 155: Europe Market Volume (MT) Analysis by End User, 2020-2035
  • Figure 156: Europe Market Value Share (%) and BPS Analysis by End User, 2025-2035
  • Figure 157: Europe Market Y-o-Y Growth (%) Projections by End User, 2025-2035
  • Figure 158: Europe Market Value (US$ Mn) Analysis by Sales Channel, 2020-2035
  • Figure 159: Europe Market Volume (MT) Analysis by Sales Channel, 2020-2035
  • Figure 160: Europe Market Value Share (%) and BPS Analysis by Sales Channel, 2025-2035
  • Figure 161: Europe Market Y-o-Y Growth (%) Projections by Sales Channel, 2025-2035
  • Figure 162: Europe Market Attractiveness by Customization Type, 2025-2035
  • Figure 163: Europe Market Attractiveness by Application, 2025-2035
  • Figure 164: Europe Market Attractiveness by Formulation Type, 2025-2035
  • Figure 165: Europe Market Attractiveness by Delivery Technology, 2025-2035
  • Figure 166: Europe Market Attractiveness by End User, 2025-2035
  • Figure 167: Europe Market Attractiveness by Sales Channel, 2025-2035
  • Figure 168: Europe Market Attractiveness by Country, 2025-2035
  • Figure 169: East Asia Market Value (US$ Mn) by Customization Type, 2025-2035
  • Figure 170: East Asia Market Value (US$ Mn) by Application, 2025-2035
  • Figure 171: East Asia Market Value (US$ Mn) by Formulation Type, 2025-2035
  • Figure 172: East Asia Market Value (US$ Mn) by Delivery Technology, 2025-2035
  • Figure 173: East Asia Market Value (US$ Mn) by End User, 2025-2035
  • Figure 174: East Asia Market Value (US$ Mn) by Sales Channel, 2025-2035
  • Figure 175: East Asia Market Value (US$ Mn) by Country, 2025-2035
  • Figure 176: East Asia Market Value (US$ Mn) Analysis by Country, 2020-2035
  • Figure 177: East Asia Market Volume (MT) Analysis by Country, 2020-2035
  • Figure 178: East Asia Market Value Share (%) and BPS Analysis by Country, 2025-2035
  • Figure 179: East Asia Market Y-o-Y Growth (%) Projections by Country, 2025-2035
  • Figure 180: East Asia Market Value (US$ Mn) Analysis by Customization Type, 2020-2035
  • Figure 181: East Asia Market Volume (MT) Analysis by Customization Type, 2020-2035
  • Figure 182: East Asia Market Value Share (%) and BPS Analysis by Customization Type, 2025-2035
  • Figure 183: East Asia Market Y-o-Y Growth (%) Projections by Customization Type, 2025-2035
  • Figure 184: East Asia Market Value (US$ Mn) Analysis by Application, 2020-2035
  • Figure 185: East Asia Market Volume (MT) Analysis by Application, 2020-2035
  • Figure 186: East Asia Market Value Share (%) and BPS Analysis by Application, 2025-2035
  • Figure 187: East Asia Market Y-o-Y Growth (%) Projections by Application, 2025-2035
  • Figure 188: East Asia Market Value (US$ Mn) Analysis by Formulation Type, 2020-2035
  • Figure 189: East Asia Market Volume (MT) Analysis by Formulation Type, 2020-2035
  • Figure 190: East Asia Market Value Share (%) and BPS Analysis by Formulation Type, 2025-2035
  • Figure 191: East Asia Market Y-o-Y Growth (%) Projections by Formulation Type, 2025-2035
  • Figure 192: East Asia Market Value (US$ Mn) Analysis by Delivery Technology, 2020-2035
  • Figure 193: East Asia Market Volume (MT) Analysis by Delivery Technology, 2020-2035
  • Figure 194: East Asia Market Value Share (%) and BPS Analysis by Delivery Technology, 2025-2035
  • Figure 195: East Asia Market Y-o-Y Growth (%) Projections by Delivery Technology, 2025-2035
  • Figure 196: East Asia Market Value (US$ Mn) Analysis by End User, 2020-2035
  • Figure 197: East Asia Market Volume (MT) Analysis by End User, 2020-2035
  • Figure 198: East Asia Market Value Share (%) and BPS Analysis by End User, 2025-2035
  • Figure 199: East Asia Market Y-o-Y Growth (%) Projections by End User, 2025-2035
  • Figure 200: East Asia Market Value (US$ Mn) Analysis by Sales Channel, 2020-2035
  • Figure 201: East Asia Market Volume (MT) Analysis by Sales Channel, 2020-2035
  • Figure 202: East Asia Market Value Share (%) and BPS Analysis by Sales Channel, 2025-2035
  • Figure 203: East Asia Market Y-o-Y Growth (%) Projections by Sales Channel, 2025-2035
  • Figure 204: East Asia Market Attractiveness by Customization Type, 2025-2035
  • Figure 205: East Asia Market Attractiveness by Application, 2025-2035
  • Figure 206: East Asia Market Attractiveness by Formulation Type, 2025-2035
  • Figure 207: East Asia Market Attractiveness by Delivery Technology, 2025-2035
  • Figure 208: East Asia Market Attractiveness by End User, 2025-2035
  • Figure 209: East Asia Market Attractiveness by Sales Channel, 2025-2035
  • Figure 210: East Asia Market Attractiveness by Country, 2025-2035
  • Figure 211: South Asia & Pacific Market Value (US$ Mn) by Customization Type, 2025-2035
  • Figure 212: South Asia & Pacific Market Value (US$ Mn) by Application, 2025-2035
  • Figure 213: South Asia & Pacific Market Value (US$ Mn) by Formulation Type, 2025-2035
  • Figure 214: South Asia & Pacific Market Value (US$ Mn) by Delivery Technology, 2025-2035
  • Figure 215: South Asia & Pacific Market Value (US$ Mn) by End User, 2025-2035
  • Figure 216: South Asia & Pacific Market Value (US$ Mn) by Sales Channel, 2025-2035
  • Figure 217: South Asia & Pacific Market Value (US$ Mn) by Country, 2025-2035
  • Figure 218: South Asia & Pacific Market Value (US$ Mn) Analysis by Country, 2020-2035
  • Figure 219: South Asia & Pacific Market Volume (MT) Analysis by Country, 2020-2035
  • Figure 220: South Asia & Pacific Market Value Share (%) and BPS Analysis by Country, 2025-2035
  • Figure 221: South Asia & Pacific Market Y-o-Y Growth (%) Projections by Country, 2025-2035
  • Figure 222: South Asia & Pacific Market Value (US$ Mn) Analysis by Customization Type, 2020-2035
  • Figure 223: South Asia & Pacific Market Volume (MT) Analysis by Customization Type, 2020-2035
  • Figure 224: South Asia & Pacific Market Value Share (%) and BPS Analysis by Customization Type, 2025-2035
  • Figure 225: South Asia & Pacific Market Y-o-Y Growth (%) Projections by Customization Type, 2025-2035
  • Figure 226: South Asia & Pacific Market Value (US$ Mn) Analysis by Application, 2020-2035
  • Figure 227: South Asia & Pacific Market Volume (MT) Analysis by Application, 2020-2035
  • Figure 228: South Asia & Pacific Market Value Share (%) and BPS Analysis by Application, 2025-2035
  • Figure 229: South Asia & Pacific Market Y-o-Y Growth (%) Projections by Application, 2025-2035
  • Figure 230: South Asia & Pacific Market Value (US$ Mn) Analysis by Formulation Type, 2020-2035
  • Figure 231: South Asia & Pacific Market Volume (MT) Analysis by Formulation Type, 2020-2035
  • Figure 232: South Asia & Pacific Market Value Share (%) and BPS Analysis by Formulation Type, 2025-2035
  • Figure 233: South Asia & Pacific Market Y-o-Y Growth (%) Projections by Formulation Type, 2025-2035
  • Figure 234: South Asia & Pacific Market Value (US$ Mn) Analysis by Delivery Technology, 2020-2035
  • Figure 235: South Asia & Pacific Market Volume (MT) Analysis by Delivery Technology, 2020-2035
  • Figure 236: South Asia & Pacific Market Value Share (%) and BPS Analysis by Delivery Technology, 2025-2035
  • Figure 237: South Asia & Pacific Market Y-o-Y Growth (%) Projections by Delivery Technology, 2025-2035
  • Figure 238: South Asia & Pacific Market Value (US$ Mn) Analysis by End User, 2020-2035
  • Figure 239: South Asia & Pacific Market Volume (MT) Analysis by End User, 2020-2035
  • Figure 240: South Asia & Pacific Market Value Share (%) and BPS Analysis by End User, 2025-2035
  • Figure 241: South Asia & Pacific Market Y-o-Y Growth (%) Projections by End User, 2025-2035
  • Figure 242: South Asia & Pacific Market Value (US$ Mn) Analysis by Sales Channel, 2020-2035
  • Figure 243: South Asia & Pacific Market Volume (MT) Analysis by Sales Channel, 2020-2035
  • Figure 244: South Asia & Pacific Market Value Share (%) and BPS Analysis by Sales Channel, 2025-2035
  • Figure 245: South Asia & Pacific Market Y-o-Y Growth (%) Projections by Sales Channel, 2025-2035
  • Figure 246: South Asia & Pacific Market Attractiveness by Customization Type, 2025-2035
  • Figure 247: South Asia & Pacific Market Attractiveness by Application, 2025-2035
  • Figure 248: South Asia & Pacific Market Attractiveness by Formulation Type, 2025-2035
  • Figure 249: South Asia & Pacific Market Attractiveness by Delivery Technology, 2025-2035
  • Figure 250: South Asia & Pacific Market Attractiveness by End User, 2025-2035
  • Figure 251: South Asia & Pacific Market Attractiveness by Sales Channel, 2025-2035
  • Figure 252: South Asia & Pacific Market Attractiveness by Country, 2025-2035
  • Figure 253: MEA Market Value (US$ Mn) by Customization Type, 2025-2035
  • Figure 254: MEA Market Value (US$ Mn) by Application, 2025-2035
  • Figure 255: MEA Market Value (US$ Mn) by Formulation Type, 2025-2035
  • Figure 256: MEA Market Value (US$ Mn) by Delivery Technology, 2025-2035
  • Figure 257: MEA Market Value (US$ Mn) by End User, 2025-2035
  • Figure 258: MEA Market Value (US$ Mn) by Sales Channel, 2025-2035
  • Figure 259: MEA Market Value (US$ Mn) by Country, 2025-2035
  • Figure 260: MEA Market Value (US$ Mn) Analysis by Country, 2020-2035
  • Figure 261: MEA Market Volume (MT) Analysis by Country, 2020-2035
  • Figure 262: MEA Market Value Share (%) and BPS Analysis by Country, 2025-2035
  • Figure 263: MEA Market Y-o-Y Growth (%) Projections by Country, 2025-2035
  • Figure 264: MEA Market Value (US$ Mn) Analysis by Customization Type, 2020-2035
  • Figure 265: MEA Market Volume (MT) Analysis by Customization Type, 2020-2035
  • Figure 266: MEA Market Value Share (%) and BPS Analysis by Customization Type, 2025-2035
  • Figure 267: MEA Market Y-o-Y Growth (%) Projections by Customization Type, 2025-2035
  • Figure 268: MEA Market Value (US$ Mn) Analysis by Application, 2020-2035
  • Figure 269: MEA Market Volume (MT) Analysis by Application, 2020-2035
  • Figure 270: MEA Market Value Share (%) and BPS Analysis by Application, 2025-2035
  • Figure 271: MEA Market Y-o-Y Growth (%) Projections by Application, 2025-2035
  • Figure 272: MEA Market Value (US$ Mn) Analysis by Formulation Type, 2020-2035
  • Figure 273: MEA Market Volume (MT) Analysis by Formulation Type, 2020-2035
  • Figure 274: MEA Market Value Share (%) and BPS Analysis by Formulation Type, 2025-2035
  • Figure 275: MEA Market Y-o-Y Growth (%) Projections by Formulation Type, 2025-2035
  • Figure 276: MEA Market Value (US$ Mn) Analysis by Delivery Technology, 2020-2035
  • Figure 277: MEA Market Volume (MT) Analysis by Delivery Technology, 2020-2035
  • Figure 278: MEA Market Value Share (%) and BPS Analysis by Delivery Technology, 2025-2035
  • Figure 279: MEA Market Y-o-Y Growth (%) Projections by Delivery Technology, 2025-2035
  • Figure 280: MEA Market Value (US$ Mn) Analysis by End User, 2020-2035
  • Figure 281: MEA Market Volume (MT) Analysis by End User, 2020-2035
  • Figure 282: MEA Market Value Share (%) and BPS Analysis by End User, 2025-2035
  • Figure 283: MEA Market Y-o-Y Growth (%) Projections by End User, 2025-2035
  • Figure 284: MEA Market Value (US$ Mn) Analysis by Sales Channel, 2020-2035
  • Figure 285: MEA Market Volume (MT) Analysis by Sales Channel, 2020-2035
  • Figure 286: MEA Market Value Share (%) and BPS Analysis by Sales Channel, 2025-2035
  • Figure 287: MEA Market Y-o-Y Growth (%) Projections by Sales Channel, 2025-2035
  • Figure 288: MEA Market Attractiveness by Customization Type, 2025-2035
  • Figure 289: MEA Market Attractiveness by Application, 2025-2035
  • Figure 290: MEA Market Attractiveness by Formulation Type, 2025-2035
  • Figure 291: MEA Market Attractiveness by Delivery Technology, 2025-2035
  • Figure 292: MEA Market Attractiveness by End User, 2025-2035
  • Figure 293: MEA Market Attractiveness by Sales Channel, 2025-2035
  • Figure 294: MEA Market Attractiveness by Country, 2025-2035

Frequently Asked Questions

How big is the Custom Probiotics in 2025?

The global Custom Probiotics Market is estimated to be valued at USD 635.6 million in 2025, driven by rising demand for personalized gut health solutions, clinically validated probiotic strains, and direct-to-consumer personalization platforms.

What will be the size of Custom Probiotics in 2035?

The market size for the Custom Probiotics Market is projected to reach approximately USD 1,106.6 million by 2035, reflecting a decade of sustained innovation, expanded microbiome testing access, and higher adoption in clinical nutrition.

How much will be the Custom Probiotics growth between 2025 and 2035?

The Custom Probiotics Market is expected to grow at a CAGR of 5.7% between 2025 and 2035, reflecting a nearly 74% cumulative increase over the decade, as personalized health solutions become increasingly integrated into everyday wellness routines.

What are the key customization type in the Custom Probiotics?

The key customization type in the Custom Probiotics Market are custom probiotics market include strain-specific formulations, multi-strain blends, single-strain probiotics, targeted health condition probiotics, and personalized gut microbiome-based formulations.

Which formulation type segment to contribute significant share in the Custom Probiotics in 2025?

In terms of formulation type, Strain-Specific Formulations are expected to command the largest share at 25.0% in the Custom Probiotics Market in 2025, supported by high clinical efficacy, regulatory clarity, and condition-specific application in digestive and immune health.

Explore Similar Insights

Future Market Insights

Custom Probiotics Market