Reports

- Global Locations -

Headquarters

Future Market Insights, Inc.

Christiana Corporate, 200
Continental Drive, Suite 401,
Newark, Delaware - 19713,
United States

T: +1-845-579-5705

Americas

Future Market Insights, Inc.

616 Corporate Way, Suite 2-9018,
Valley Cottage, NY 10989, United States

T: +1-347-918-3531

MEA

Future Market Insights

1602-6 Jumeirah Bay X2 Tower, Plot No: JLT-PH2-X2A,
Jumeirah Lakes Towers, Dubai,
United Arab Emirates

Europe

Future Market Insights

3rd Floor, 207 Regent Street,
W1B 3HH London
United Kingdom

T: + 44 (0) 20 8123 9659
D: +44 (0) 20 3287 4268

Asia Pacific

Future Market Insights

IndiaLand Global Tech Park, Unit UG-1, Behind Grand HighStreet, Phase 1, Hinjawadi, MH, Pune – 411057, India

Customisation and Personalisation in Travel Market Snapshot (2022-2032)

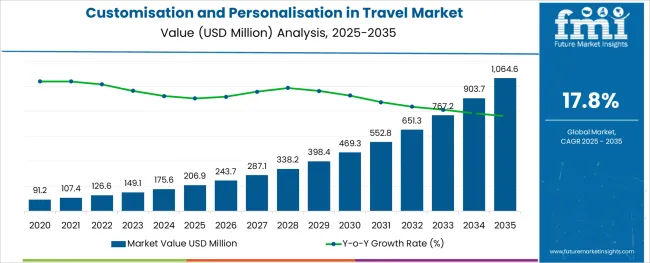
[333 Pages Report] The global customisation and personalisation in travel market size is expected to reach US$ 620.71 Million in 2032. The customisation and personalisation in travel market is growing rapidly.

As per FMI Analysts, the global customisation and personalisation in travel market is estimated to be valued at US$ 126.56 Million in 2022 and is projected to increase at a CAGR of 17.8% in the forecast period from 2022 to 2032.

Report Attribute Details
Customisation and personalisation in Travel Market Estimated Base Year Value (2021) US$ 107.43 Million
Customisation and personalisation in Travel Market Expected Market Value (2022) US$ 126.56 Million
Customisation and personalisation in Travel Market Anticipated Forecast Value (2032) US$ 620.71 Million
Customisation and personalisation in Travel Market Projected Growth Rate (2022-2032) 17.8% CAGR

The proliferation of new travel destinations around the globe as well as the emergence of millennial travellers are key components in creating customised and personalized travel marketing. The massive wave of digital revolution has eroded the entire travel industry and created new opportunities for customised and personalized travel marketing.

It is becoming more and more popular for travel marketers to develop customized and personalized tours based on the needs and interests of travellers. A properly planned trip with significant inputs can alter the entire travel experience for a tourist. Travel-related data is changing the world's perception of the tourism industry.

Travel marketing is still largely dominated by the conventional way of traveling because a large population of tourists, mostly older travellers, are ignorant of modern technology and traditional travel marketing.

A number of travel tools are currently in use and many of the leading travel agencies in the world use these tools to customize travel marketing campaigns, generating demand for customisation and personalisation in travel. Travel portals have created a virtual corridor that leads travellers to a larger and better area of the travel industry. Several travellers around the globe are shopping and planning their travels on social media platforms prior to departure. Marketers also utilize social media platforms such as Facebook and Twitter to sell their products and services.

Travel agents and tour operators are rehashing their travel marketing strategies by gauging the exact choice of each traveler and sending out professional and customized newsletters and emails to entice potential travelers, influencing the market share of the customisation and personalisation in travel market.  High-end marketing tools are being used to identify client information and to create personalized emails to ignite tourists' interest in particular travel packages.

In the travel industry, social media platforms are actively used by companies to woo the hashtag-loving traveller. A well-designed social media campaign can not only create new customers for the company, but it can also strengthen customer loyalty, boosting growth of the customisation and personalisation in travel market.  A social media presence can be a springboard for all marketing and promotional activities.

The JetBlue app extends this experience, leveraging geo-location capabilities to provide consumers with important travel information in real-time, according to a 2015 report by Amadeus, a major IT provider for the travel sector.

Don't pay for what you don't need

Customize your report by selecting specific countries or regions and save 30%!

What are the Various Factors Driving the Customisation and personalisation in Travel Market?

The customisation and personalisation in travel market has received a lot of traction in the industry.

There are several factors contributing to the emergence of customisation and personalisation in travel marketing today, such as the existence of millennial travellers and travel-friendly economies across the globe. The digital wave that is tearing apart the travel industry has paved the way for customised and personalised marketing campaigns. Over the last decade, new travel destinations are mushrooming across the globe, increasing demand for customisation and personalisation in travel marketing.

The use and accumulation of travel data have changed the face of the travel industry and given it a whole new dimension. Customisation and personalisation are slowly but steadily gaining traction in the market. A properly planned trip can make tourism a very different experience, creating demand for customisation and personalisation in travel.

The key to success for key stakeholders in the travel industry is to personalize and customize travel marketing. Modern-day consumers are looking for tailor-made and customized travel packages, Emails will soon be an outdated tool in the rapidly evolving travel industry. Travel companies use advanced marketing tools to promote their offerings.

The pool of aged travellers is still shunning modern and customized travel marketing due to their inexperience with new technologies. An enormous proportion of tourists are still dependent on conventional forms of travel, this further affects the adoption of customisation and personalisation in travel.
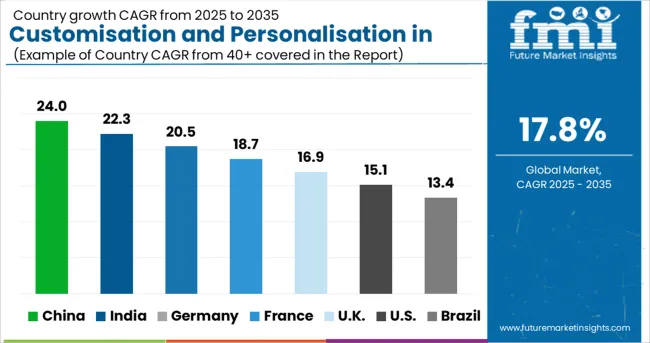
What is Regional Analysis of Customisation and personalisation in Travel Market Share?

Globally, Asia-Pacific holds a significant share in the personalized travel and experiences market, and is expected to sustain its share throughout the forecast period, Asia-Pacific is known for its diverse cultures and attractive destinations. China, Japan, South Korea, India, and Malaysia have the highest concentration of outbound trips among households with higher income levels.

Moreover, Asia-Pacific tourists prefer tours, city trips, and beach holidays among holiday types in the region. International tourist arrivals in Asia-Pacific increased by 12% in 2019. The demand for customisation and personalisation in travel market is expected to grow due to increased adoption of internet-enabled phones and the internet of things.

A host of travel tools are now used by most leading travel agents around the world for customisation and personalisation in travel marketing because travel portals have created a virtual corridor for travelers, allowing them to experience the travel world on a wider scale. Modern-day travelers are shifting toward tailor-made and customized travel packages; Emails are a thing of the past; Travel companies are using advanced tools to promote their products and services, curating new opportunities for the customised and personalized travel market.

The rise of social media platforms is changing the way travel marketers market their products and services. Many travelers around the globe are using social media platforms to conduct their research before traveling, while marketers primarily use Facebook and Twitter to market their wares and services.
Ronak Shah
Ronak Shah

Principal Consultant

Talk to Analyst

Find your sweet spots for generating winning opportunities in this market.

What is the Competition Landscape in the Customisation and personalisation in Travel Market?

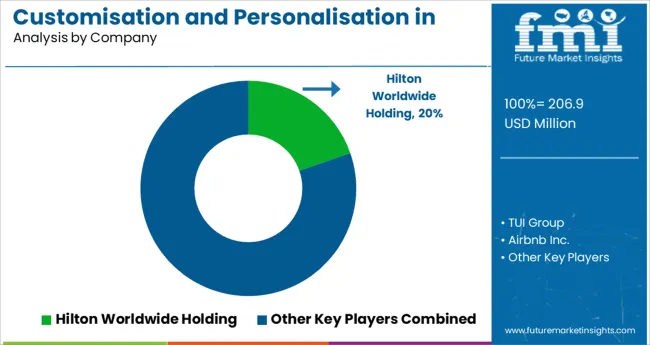
Some of the leading companies operating in the global customisation and personalisation in travel market include Best Western, Carnival Corp., Club Family Hotel, Delta Flights, EasyJet, KLM Royal Dutch, Princess Cruises, Virgin Hotels, IBERIA LAE SA, and Expedia Group, Inc.

Companies are revamping their travel marketing strategies to woo a new lot of consumers by collecting the exact information about the prospective customer and sending professional and personalized emails to ignite consumer interest in a particular tour package. These companies use sophisticated marketing tools to segregate the customer's information into segments and then design personalized emails and newsletters to entice tourists, driving growth in the customised and personalized travel market.

An active social media presence can provide an instant launch pad to any marketing or promotional activity planned by a travel management company. Thus, travel management companies are actively using social media platforms to reach out to hashtag-loving travelers. An effective social media campaign can generate new clients, while strengthening customer loyalty.

The JetBlue app then extends this experience, using geo-location capabilities to provide real-time travel updates based on location. According to a 2015 report by Amadeus, a major IT provider in the travel sector, JetBlue has "upped" its ability to deliver a consistent and immersive experience across multiple channels.

Report Scope

Report Attribute Details
Growth Rate CAGR of 17.8% from 2022 to 2032
Base Year for Estimation 2021
Historical Data 2015 to 2021
Forecast Period 2022 to 2032
Quantitative Units Revenue in USD Million and CAGR from 2022 to 2032
Report Coverage Revenue Forecast, Volume Forecast, Company Ranking, Competitive Landscape, Growth Factors, Trends and Pricing Analysis
Segments Covered
  • Service Type
  • Mode of Booking
  • Age Group
  • Purpose
  • Region
Regions Covered
  • North America
  • Europe
  • Asia-Pacific
  • LAMEA
Key Countries Profiled
  • USA
  • Canada
  • Mexico
  • Germany
  • France
  • UK
  • Italy
  • Spain
  • Rest of Europe
  • China
  • India
  • Japan
  • Australia
  • South Korea
  • Rest of Asia-Pacific
  • Latin America
  • Middle East
  • Africa
Key Companies Profiled
  • Best Western
  • Carnival Corp.
  • Club Family Hotel
  • Delta Flights
  • EasyJet
  • KLM Royal Dutch
  • Princess Cruises
  • Virgin Hotels
  • IBERIA LAE SA 
  • Expedia Group, Inc.
Customization Available Upon Request

Get the data you need at a Fraction of the cost

Personalize your report by choosing insights you need
and save 40%!

Key Segments Profiled in the Customisation and personalisation in Travel Market

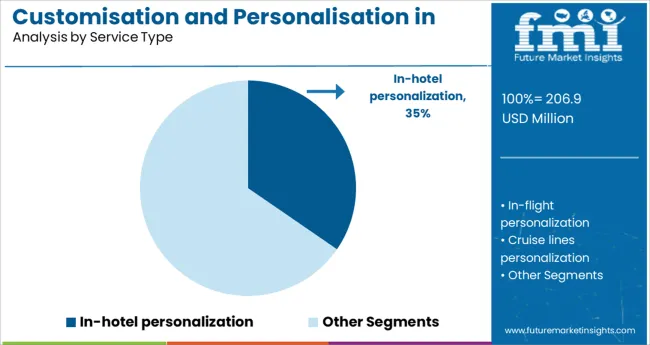
By Service Type:

  • In-flight personalization
  • Cruise lines personalization
  • Adventure Travel
  • In-hotel personalization
  • Other personalization

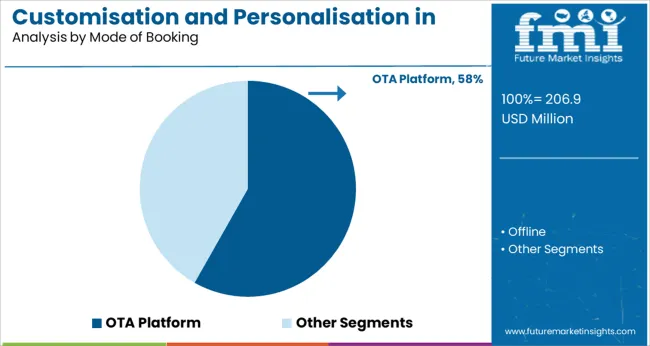
By Mode of Booking:

  • OTA Platform
  • Offline

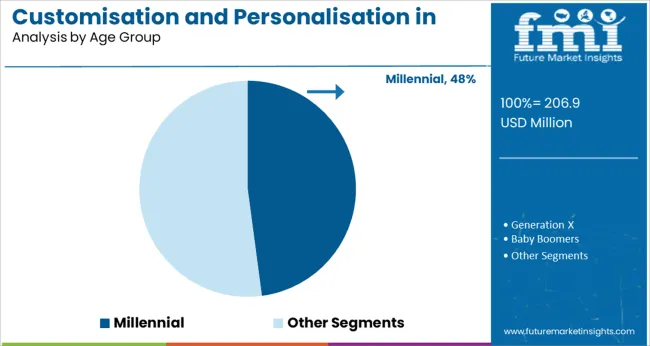
By Age Group:

  • Millennial
  • Generation X
  • Baby Boomers
  • Others

By Purpose:

  • Leisure
  • Business

By Region:

  • North America
  • Europe
  • Asia-Pacific
  • LAMEA

Frequently Asked Questions

At What Rate will the Customisation and personalisation in Travel Market grow?

The global customisation and personalisation in travel market is set to exceed US$ 620.71 Million by 2032.

Which Region is set to Lead the Customisation and personalisation in Travel Market?

The U.S. is projected to lead the customisation and personalisation in travel market in the forecast period.

Which are some of the Renowned Companies in the Customisation and personalisation in Travel Market?

Best Western, Carnival Corp., Club Family Hotel, Delta Flights, EasyJet, and others are some of the renowned companies in the customisation and personalisation in travel market.

Table of Content

1. Executive Summary

    1.1. Global Market Outlook

    1.2. Demand-side Trends

    1.3. Supply-side Trends

    1.4. Technology Roadmap Analysis

    1.5. Analysis and Recommendations

2. Market Overview

    2.1. Market Coverage / Taxonomy

    2.2. Market Definition / Scope / Limitations

3. Market Background

    3.1. Market Dynamics

        3.1.1. Drivers

        3.1.2. Restraints

        3.1.3. Opportunity

        3.1.4. Trends

    3.2. Scenario Forecast

        3.2.1. Demand in Optimistic Scenario

        3.2.2. Demand in Likely Scenario

        3.2.3. Demand in Conservative Scenario

    3.3. Opportunity Map Analysis

    3.4. Product Life Cycle Analysis

    3.5. Investment Feasibility Matrix

    3.6. PESTLE and Porter’s Analysis

    3.7. Regulatory Landscape

        3.7.1. By Key Regions

        3.7.2. By Key Countries

    3.8. Regional Parent Market Outlook

4. Global Customisation and Personalisation in Travel Market Analysis 2017-2021 and Forecast, 2022-2032

    4.1. Historical Market Size Value (US$ Mn) Analysis, 2017-2021

    4.2. Current and Future Market Size Value (US$ Mn) Projections, 2022-2032

        4.2.1. Y-o-Y Growth Trend Analysis

        4.2.2. Absolute $ Opportunity Analysis

5. Global Customisation and Personalisation in Travel Market Analysis 2017-2021 and Forecast 2022-2032, By Service Type

    5.1. Introduction / Key Findings

    5.2. Historical Market Size Value (US$ Mn) Analysis By Service Type, 2017-2021

    5.3. Current and Future Market Size Value (US$ Mn) Analysis and Forecast By Service Type, 2022-2032

        5.3.1. In-flight Personalization

        5.3.2. Cruise Lines Personalization

        5.3.3. Adventure Travel

        5.3.4. In-hotel

        5.3.5. Others

    5.4. Y-o-Y Growth Trend Analysis By Service Type, 2017-2021

    5.5. Absolute $ Opportunity Analysis By Service Type, 2022-2032

6. Global Customisation and Personalisation in Travel Market Analysis 2017-2021 and Forecast 2022-2032, By Mode of Booking

    6.1. Introduction / Key Findings

    6.2. Historical Market Size Value (US$ Mn) Analysis By Mode of Booking, 2017-2021

    6.3. Current and Future Market Size Value (US$ Mn) Analysis and Forecast By Mode of Booking, 2022-2032

        6.3.1. OTA Platform

        6.3.2. Offline

    6.4. Y-o-Y Growth Trend Analysis By Mode of Booking, 2017-2021

    6.5. Absolute $ Opportunity Analysis By Mode of Booking, 2022-2032

7. Global Customisation and Personalisation in Travel Market Analysis 2017-2021 and Forecast 2022-2032, By Purpose

    7.1. Introduction / Key Findings

    7.2. Historical Market Size Value (US$ Mn) Analysis By Purpose, 2017-2021

    7.3. Current and Future Market Size Value (US$ Mn) Analysis and Forecast By Purpose, 2022-2032

        7.3.1. Leisure

        7.3.2. Business

    7.4. Y-o-Y Growth Trend Analysis By Purpose, 2017-2021

    7.5. Absolute $ Opportunity Analysis By Purpose, 2022-2032

8. Global Customisation and Personalisation in Travel Market Analysis 2017-2021 and Forecast 2022-2032, By Travel Type

    8.1. Introduction / Key Findings

    8.2. Historical Market Size Value (US$ Mn) Analysis By Travel Type, 2017-2021

    8.3. Current and Future Market Size Value (US$ Mn) Analysis and Forecast By Travel Type, 2022-2032

        8.3.1. International

        8.3.2. Domestic

    8.4. Y-o-Y Growth Trend Analysis By Travel Type, 2017-2021

    8.5. Absolute $ Opportunity Analysis By Travel Type, 2022-2032

9. Global Customisation and Personalisation in Travel Market Analysis 2017-2021 and Forecast 2022-2032, By Region

    9.1. Introduction

    9.2. Historical Market Size Value (US$ Mn) Analysis By Region, 2017-2021

    9.3. Current Market Size Value (US$ Mn) Analysis and Forecast By Region, 2022-2032

        9.3.1. North America

        9.3.2. Latin America

        9.3.3. Europe

        9.3.4. Asia Pacific

        9.3.5. Middle East and Africa

    9.4. Market Attractiveness Analysis By Region

10. North America Customisation and Personalisation in Travel Market Analysis 2017-2021 and Forecast 2022-2032, By Country

    10.1. Historical Market Size Value (US$ Mn) Trend Analysis By Market Taxonomy, 2017-2021

    10.2. Market Size Value (US$ Mn) Forecast By Market Taxonomy, 2022-2032

        10.2.1. By Country

            10.2.1.1. U.S.

            10.2.1.2. Canada

        10.2.2. By Service Type

        10.2.3. By Mode of Booking

        10.2.4. By Purpose

        10.2.5. By Travel Type

    10.3. Market Attractiveness Analysis

        10.3.1. By Country

        10.3.2. By Service Type

        10.3.3. By Mode of Booking

        10.3.4. By Purpose

        10.3.5. By Travel Type

    10.4. Key Takeaways

11. Latin America Customisation and Personalisation in Travel Market Analysis 2017-2021 and Forecast 2022-2032, By Country

    11.1. Historical Market Size Value (US$ Mn) Trend Analysis By Market Taxonomy, 2017-2021

    11.2. Market Size Value (US$ Mn) Forecast By Market Taxonomy, 2022-2032

        11.2.1. By Country

            11.2.1.1. Brazil

            11.2.1.2. Mexico

            11.2.1.3. Rest of Latin America

        11.2.2. By Service Type

        11.2.3. By Mode of Booking

        11.2.4. By Purpose

        11.2.5. By Travel Type

    11.3. Market Attractiveness Analysis

        11.3.1. By Country

        11.3.2. By Service Type

        11.3.3. By Mode of Booking

        11.3.4. By Purpose

        11.3.5. By Travel Type

    11.4. Key Takeaways

12. Europe Customisation and Personalisation in Travel Market Analysis 2017-2021 and Forecast 2022-2032, By Country

    12.1. Historical Market Size Value (US$ Mn) Trend Analysis By Market Taxonomy, 2017-2021

    12.2. Market Size Value (US$ Mn) Forecast By Market Taxonomy, 2022-2032

        12.2.1. By Country

            12.2.1.1. Germany

            12.2.1.2. Italy

            12.2.1.3. France

            12.2.1.4. U.K.

            12.2.1.5. Russia

            12.2.1.6. BENELUX

            12.2.1.7. Rest of Europe

        12.2.2. By Service Type

        12.2.3. By Mode of Booking

        12.2.4. By Purpose

        12.2.5. By Travel Type

    12.3. Market Attractiveness Analysis

        12.3.1. By Country

        12.3.2. By Service Type

        12.3.3. By Mode of Booking

        12.3.4. By Purpose

        12.3.5. By Travel Type

    12.4. Key Takeaways

13. Asia Pacific Customisation and Personalisation in Travel Market Analysis 2017-2021 and Forecast 2022-2032, By Country

    13.1. Historical Market Size Value (US$ Mn) Trend Analysis By Market Taxonomy, 2017-2021

    13.2. Market Size Value (US$ Mn) Forecast By Market Taxonomy, 2022-2032

        13.2.1. By Country

            13.2.1.1. China

            13.2.1.2. Japan

            13.2.1.3. South Korea

            13.2.1.4. Rest of Asia Pacific

        13.2.2. By Service Type

        13.2.3. By Mode of Booking

        13.2.4. By Purpose

        13.2.5. By Travel Type

    13.3. Market Attractiveness Analysis

        13.3.1. By Country

        13.3.2. By Service Type

        13.3.3. By Mode of Booking

        13.3.4. By Purpose

        13.3.5. By Travel Type

    13.4. Key Takeaways

14. Middle East and Africa Customisation and Personalisation in Travel Market Analysis 2017-2021 and Forecast 2022-2032, By Country

    14.1. Historical Market Size Value (US$ Mn) Trend Analysis By Market Taxonomy, 2017-2021

    14.2. Market Size Value (US$ Mn) Forecast By Market Taxonomy, 2022-2032

        14.2.1. By Country

            14.2.1.1. GCC Countries

            14.2.1.2. South Africa

            14.2.1.3. Turkey

            14.2.1.4. Rest of Middle East and Africa

        14.2.2. By Service Type

        14.2.3. By Mode of Booking

        14.2.4. By Purpose

        14.2.5. By Travel Type

    14.3. Market Attractiveness Analysis

        14.3.1. By Country

        14.3.2. By Service Type

        14.3.3. By Mode of Booking

        14.3.4. By Purpose

        14.3.5. By Travel Type

    14.4. Key Takeaways

15. Key Countries Customisation and Personalisation in Travel Market Analysis

    15.1. U.S.

        15.1.1. Pricing Analysis

        15.1.2. Market Share Analysis, 2021

            15.1.2.1. By Service Type

            15.1.2.2. By Mode of Booking

            15.1.2.3. By Purpose

            15.1.2.4. By Travel Type

    15.2. Canada

        15.2.1. Pricing Analysis

        15.2.2. Market Share Analysis, 2021

            15.2.2.1. By Service Type

            15.2.2.2. By Mode of Booking

            15.2.2.3. By Purpose

            15.2.2.4. By Travel Type

    15.3. Brazil

        15.3.1. Pricing Analysis

        15.3.2. Market Share Analysis, 2021

            15.3.2.1. By Service Type

            15.3.2.2. By Mode of Booking

            15.3.2.3. By Purpose

            15.3.2.4. By Travel Type

    15.4. Mexico

        15.4.1. Pricing Analysis

        15.4.2. Market Share Analysis, 2021

            15.4.2.1. By Service Type

            15.4.2.2. By Mode of Booking

            15.4.2.3. By Purpose

            15.4.2.4. By Travel Type

    15.5. Germany

        15.5.1. Pricing Analysis

        15.5.2. Market Share Analysis, 2021

            15.5.2.1. By Service Type

            15.5.2.2. By Mode of Booking

            15.5.2.3. By Purpose

            15.5.2.4. By Travel Type

    15.6. Italy

        15.6.1. Pricing Analysis

        15.6.2. Market Share Analysis, 2021

            15.6.2.1. By Service Type

            15.6.2.2. By Mode of Booking

            15.6.2.3. By Purpose

            15.6.2.4. By Travel Type

    15.7. France

        15.7.1. Pricing Analysis

        15.7.2. Market Share Analysis, 2021

            15.7.2.1. By Service Type

            15.7.2.2. By Mode of Booking

            15.7.2.3. By Purpose

            15.7.2.4. By Travel Type

    15.8. U.K.

        15.8.1. Pricing Analysis

        15.8.2. Market Share Analysis, 2021

            15.8.2.1. By Service Type

            15.8.2.2. By Mode of Booking

            15.8.2.3. By Purpose

            15.8.2.4. By Travel Type

    15.9. Russia

        15.9.1. Pricing Analysis

        15.9.2. Market Share Analysis, 2021

            15.9.2.1. By Service Type

            15.9.2.2. By Mode of Booking

            15.9.2.3. By Purpose

            15.9.2.4. By Travel Type

    15.10. BENELUX

        15.10.1. Pricing Analysis

        15.10.2. Market Share Analysis, 2021

            15.10.2.1. By Service Type

            15.10.2.2. By Mode of Booking

            15.10.2.3. By Purpose

            15.10.2.4. By Travel Type

    15.11. China

        15.11.1. Pricing Analysis

        15.11.2. Market Share Analysis, 2021

            15.11.2.1. By Service Type

            15.11.2.2. By Mode of Booking

            15.11.2.3. By Purpose

            15.11.2.4. By Travel Type

    15.12. Japan

        15.12.1. Pricing Analysis

        15.12.2. Market Share Analysis, 2021

            15.12.2.1. By Service Type

            15.12.2.2. By Mode of Booking

            15.12.2.3. By Purpose

            15.12.2.4. By Travel Type

    15.13. South Korea

        15.13.1. Pricing Analysis

        15.13.2. Market Share Analysis, 2021

            15.13.2.1. By Service Type

            15.13.2.2. By Mode of Booking

            15.13.2.3. By Purpose

            15.13.2.4. By Travel Type

    15.14. GCC Countries

        15.14.1. Pricing Analysis

        15.14.2. Market Share Analysis, 2021

            15.14.2.1. By Service Type

            15.14.2.2. By Mode of Booking

            15.14.2.3. By Purpose

            15.14.2.4. By Travel Type

    15.15. South Africa

        15.15.1. Pricing Analysis

        15.15.2. Market Share Analysis, 2021

            15.15.2.1. By Service Type

            15.15.2.2. By Mode of Booking

            15.15.2.3. By Purpose

            15.15.2.4. By Travel Type

    15.16. Turkey

        15.16.1. Pricing Analysis

        15.16.2. Market Share Analysis, 2021

            15.16.2.1. By Service Type

            15.16.2.2. By Mode of Booking

            15.16.2.3. By Purpose

            15.16.2.4. By Travel Type

16. Market Structure Analysis

    16.1. Competition Dashboard

    16.2. Competition Benchmarking

    16.3. Market Share Analysis of Top Players

        16.3.1. By Regional

        16.3.2. By Service Type

        16.3.3. By Mode of Booking

        16.3.4. By Purpose

        16.3.5. By Travel Type

17. Competition Analysis

    17.1. Competition Deep Dive

        17.1.1. Hilton Worldwide Holding

            17.1.1.1. Overview

            17.1.1.2. Product Portfolio

            17.1.1.3. Profitability by Market Segments

            17.1.1.4. Sales Footprint

            17.1.1.5. Strategy Overview

                17.1.1.5.1. Marketing Strategy

        17.1.2. TUI Group

            17.1.2.1. Overview

            17.1.2.2. Product Portfolio

            17.1.2.3. Profitability by Market Segments

            17.1.2.4. Sales Footprint

            17.1.2.5. Strategy Overview

                17.1.2.5.1. Marketing Strategy

        17.1.3. Airbnb Inc.

            17.1.3.1. Overview

            17.1.3.2. Product Portfolio

            17.1.3.3. Profitability by Market Segments

            17.1.3.4. Sales Footprint

            17.1.3.5. Strategy Overview

                17.1.3.5.1. Marketing Strategy

        17.1.4. Crown Resorts limited

            17.1.4.1. Overview

            17.1.4.2. Product Portfolio

            17.1.4.3. Profitability by Market Segments

            17.1.4.4. Sales Footprint

            17.1.4.5. Strategy Overview

                17.1.4.5.1. Marketing Strategy

        17.1.5. Gray and Corporation

            17.1.5.1. Overview

            17.1.5.2. Product Portfolio

            17.1.5.3. Profitability by Market Segments

            17.1.5.4. Sales Footprint

            17.1.5.5. Strategy Overview

                17.1.5.5.1. Marketing Strategy

        17.1.6. Accor Group

            17.1.6.1. Overview

            17.1.6.2. Product Portfolio

            17.1.6.3. Profitability by Market Segments

            17.1.6.4. Sales Footprint

            17.1.6.5. Strategy Overview

                17.1.6.5.1. Marketing Strategy

        17.1.7. Carnival Corporation

            17.1.7.1. Overview

            17.1.7.2. Product Portfolio

            17.1.7.3. Profitability by Market Segments

            17.1.7.4. Sales Footprint

            17.1.7.5. Strategy Overview

                17.1.7.5.1. Marketing Strategy

        17.1.8. Virgin Hotels

            17.1.8.1. Overview

            17.1.8.2. Product Portfolio

            17.1.8.3. Profitability by Market Segments

            17.1.8.4. Sales Footprint

            17.1.8.5. Strategy Overview

                17.1.8.5.1. Marketing Strategy

        17.1.9. Expedia Group

            17.1.9.1. Overview

            17.1.9.2. Product Portfolio

            17.1.9.3. Profitability by Market Segments

            17.1.9.4. Sales Footprint

            17.1.9.5. Strategy Overview

                17.1.9.5.1. Marketing Strategy

        17.1.10. KLM Royal Dutch

            17.1.10.1. Overview

            17.1.10.2. Product Portfolio

            17.1.10.3. Profitability by Market Segments

            17.1.10.4. Sales Footprint

            17.1.10.5. Strategy Overview

                17.1.10.5.1. Marketing Strategy

18. Assumptions & Acronyms Used

19. Research Methodology

List of Tables

Table 1: Global Customisation and Personalisation in Travel Market Value (US$ Mn) Forecast by Region, 2017-2032

Table 2: Global Customisation and Personalisation in Travel Market Value (US$ Mn) Forecast by Service Type, 2017-2032

Table 3: Global Customisation and Personalisation in Travel Market Value (US$ Mn) Forecast by Mode of Booking, 2017-2032

Table 4: Global Customisation and Personalisation in Travel Market Value (US$ Mn) Forecast by Purpose, 2017-2032

Table 5: Global Customisation and Personalisation in Travel Market Value (US$ Mn) Forecast by Travel Type, 2017-2032

Table 6: North America Customisation and Personalisation in Travel Market Value (US$ Mn) Forecast by Country, 2017-2032

Table 7: North America Customisation and Personalisation in Travel Market Value (US$ Mn) Forecast by Service Type, 2017-2032

Table 8: North America Customisation and Personalisation in Travel Market Value (US$ Mn) Forecast by Mode of Booking, 2017-2032

Table 9: North America Customisation and Personalisation in Travel Market Value (US$ Mn) Forecast by Purpose, 2017-2032

Table 10: North America Customisation and Personalisation in Travel Market Value (US$ Mn) Forecast by Travel Type, 2017-2032

Table 11: Latin America Customisation and Personalisation in Travel Market Value (US$ Mn) Forecast by Country, 2017-2032

Table 12: Latin America Customisation and Personalisation in Travel Market Value (US$ Mn) Forecast by Service Type, 2017-2032

Table 13: Latin America Customisation and Personalisation in Travel Market Value (US$ Mn) Forecast by Mode of Booking, 2017-2032

Table 14: Latin America Customisation and Personalisation in Travel Market Value (US$ Mn) Forecast by Purpose, 2017-2032

Table 15: Latin America Customisation and Personalisation in Travel Market Value (US$ Mn) Forecast by Travel Type, 2017-2032

Table 16: Europe Customisation and Personalisation in Travel Market Value (US$ Mn) Forecast by Country, 2017-2032

Table 17: Europe Customisation and Personalisation in Travel Market Value (US$ Mn) Forecast by Service Type, 2017-2032

Table 18: Europe Customisation and Personalisation in Travel Market Value (US$ Mn) Forecast by Mode of Booking, 2017-2032

Table 19: Europe Customisation and Personalisation in Travel Market Value (US$ Mn) Forecast by Purpose, 2017-2032

Table 20: Europe Customisation and Personalisation in Travel Market Value (US$ Mn) Forecast by Travel Type, 2017-2032

Table 21: Asia Pacific Customisation and Personalisation in Travel Market Value (US$ Mn) Forecast by Country, 2017-2032

Table 22: Asia Pacific Customisation and Personalisation in Travel Market Value (US$ Mn) Forecast by Service Type, 2017-2032

Table 23: Asia Pacific Customisation and Personalisation in Travel Market Value (US$ Mn) Forecast by Mode of Booking, 2017-2032

Table 24: Asia Pacific Customisation and Personalisation in Travel Market Value (US$ Mn) Forecast by Purpose, 2017-2032

Table 25: Asia Pacific Customisation and Personalisation in Travel Market Value (US$ Mn) Forecast by Travel Type, 2017-2032

Table 26: Middle East and Africa Customisation and Personalisation in Travel Market Value (US$ Mn) Forecast by Country, 2017-2032

Table 27: Middle East and Africa Customisation and Personalisation in Travel Market Value (US$ Mn) Forecast by Service Type, 2017-2032

Table 28: Middle East and Africa Customisation and Personalisation in Travel Market Value (US$ Mn) Forecast by Mode of Booking, 2017-2032

Table 29: Middle East and Africa Customisation and Personalisation in Travel Market Value (US$ Mn) Forecast by Purpose, 2017-2032

Table 30: Middle East and Africa Customisation and Personalisation in Travel Market Value (US$ Mn) Forecast by Travel Type, 2017-2032

List of Charts

Figure 1: Global Customisation and Personalisation in Travel Market Value (US$ Mn) by Service Type, 2022-2032

Figure 2: Global Customisation and Personalisation in Travel Market Value (US$ Mn) by Mode of Booking, 2022-2032

Figure 3: Global Customisation and Personalisation in Travel Market Value (US$ Mn) by Purpose, 2022-2032

Figure 4: Global Customisation and Personalisation in Travel Market Value (US$ Mn) by Travel Type, 2022-2032

Figure 5: Global Customisation and Personalisation in Travel Market Value (US$ Mn) by Region, 2022-2032

Figure 6: Global Customisation and Personalisation in Travel Market Value (US$ Mn) Analysis by Region, 2017-2032

Figure 7: Global Customisation and Personalisation in Travel Market Value Share (%) and BPS Analysis by Region, 2022-2032

Figure 8: Global Customisation and Personalisation in Travel Market Y-o-Y Growth (%) Projections by Region, 2022-2032

Figure 9: Global Customisation and Personalisation in Travel Market Value (US$ Mn) Analysis by Service Type, 2017-2032

Figure 10: Global Customisation and Personalisation in Travel Market Value Share (%) and BPS Analysis by Service Type, 2022-2032

Figure 11: Global Customisation and Personalisation in Travel Market Y-o-Y Growth (%) Projections by Service Type, 2022-2032

Figure 12: Global Customisation and Personalisation in Travel Market Value (US$ Mn) Analysis by Mode of Booking, 2017-2032

Figure 13: Global Customisation and Personalisation in Travel Market Value Share (%) and BPS Analysis by Mode of Booking, 2022-2032

Figure 14: Global Customisation and Personalisation in Travel Market Y-o-Y Growth (%) Projections by Mode of Booking, 2022-2032

Figure 15: Global Customisation and Personalisation in Travel Market Value (US$ Mn) Analysis by Purpose, 2017-2032

Figure 16: Global Customisation and Personalisation in Travel Market Value Share (%) and BPS Analysis by Purpose, 2022-2032

Figure 17: Global Customisation and Personalisation in Travel Market Y-o-Y Growth (%) Projections by Purpose, 2022-2032

Figure 18: Global Customisation and Personalisation in Travel Market Value (US$ Mn) Analysis by Travel Type, 2017-2032

Figure 19: Global Customisation and Personalisation in Travel Market Value Share (%) and BPS Analysis by Travel Type, 2022-2032

Figure 20: Global Customisation and Personalisation in Travel Market Y-o-Y Growth (%) Projections by Travel Type, 2022-2032

Figure 21: Global Customisation and Personalisation in Travel Market Attractiveness by Service Type, 2022-2032

Figure 22: Global Customisation and Personalisation in Travel Market Attractiveness by Mode of Booking, 2022-2032

Figure 23: Global Customisation and Personalisation in Travel Market Attractiveness by Purpose, 2022-2032

Figure 24: Global Customisation and Personalisation in Travel Market Attractiveness by Travel Type, 2022-2032

Figure 25: Global Customisation and Personalisation in Travel Market Attractiveness by Region, 2022-2032

Figure 26: North America Customisation and Personalisation in Travel Market Value (US$ Mn) by Service Type, 2022-2032

Figure 27: North America Customisation and Personalisation in Travel Market Value (US$ Mn) by Mode of Booking, 2022-2032

Figure 28: North America Customisation and Personalisation in Travel Market Value (US$ Mn) by Purpose, 2022-2032

Figure 29: North America Customisation and Personalisation in Travel Market Value (US$ Mn) by Travel Type, 2022-2032

Figure 30: North America Customisation and Personalisation in Travel Market Value (US$ Mn) by Country, 2022-2032

Figure 31: North America Customisation and Personalisation in Travel Market Value (US$ Mn) Analysis by Country, 2017-2032

Figure 32: North America Customisation and Personalisation in Travel Market Value Share (%) and BPS Analysis by Country, 2022-2032

Figure 33: North America Customisation and Personalisation in Travel Market Y-o-Y Growth (%) Projections by Country, 2022-2032

Figure 34: North America Customisation and Personalisation in Travel Market Value (US$ Mn) Analysis by Service Type, 2017-2032

Figure 35: North America Customisation and Personalisation in Travel Market Value Share (%) and BPS Analysis by Service Type, 2022-2032

Figure 36: North America Customisation and Personalisation in Travel Market Y-o-Y Growth (%) Projections by Service Type, 2022-2032

Figure 37: North America Customisation and Personalisation in Travel Market Value (US$ Mn) Analysis by Mode of Booking, 2017-2032

Figure 38: North America Customisation and Personalisation in Travel Market Value Share (%) and BPS Analysis by Mode of Booking, 2022-2032

Figure 39: North America Customisation and Personalisation in Travel Market Y-o-Y Growth (%) Projections by Mode of Booking, 2022-2032

Figure 40: North America Customisation and Personalisation in Travel Market Value (US$ Mn) Analysis by Purpose, 2017-2032

Figure 41: North America Customisation and Personalisation in Travel Market Value Share (%) and BPS Analysis by Purpose, 2022-2032

Figure 42: North America Customisation and Personalisation in Travel Market Y-o-Y Growth (%) Projections by Purpose, 2022-2032

Figure 43: North America Customisation and Personalisation in Travel Market Value (US$ Mn) Analysis by Travel Type, 2017-2032

Figure 44: North America Customisation and Personalisation in Travel Market Value Share (%) and BPS Analysis by Travel Type, 2022-2032

Figure 45: North America Customisation and Personalisation in Travel Market Y-o-Y Growth (%) Projections by Travel Type, 2022-2032

Figure 46: North America Customisation and Personalisation in Travel Market Attractiveness by Service Type, 2022-2032

Figure 47: North America Customisation and Personalisation in Travel Market Attractiveness by Mode of Booking, 2022-2032

Figure 48: North America Customisation and Personalisation in Travel Market Attractiveness by Purpose, 2022-2032

Figure 49: North America Customisation and Personalisation in Travel Market Attractiveness by Travel Type, 2022-2032

Figure 50: North America Customisation and Personalisation in Travel Market Attractiveness by Country, 2022-2032

Figure 51: Latin America Customisation and Personalisation in Travel Market Value (US$ Mn) by Service Type, 2022-2032

Figure 52: Latin America Customisation and Personalisation in Travel Market Value (US$ Mn) by Mode of Booking, 2022-2032

Figure 53: Latin America Customisation and Personalisation in Travel Market Value (US$ Mn) by Purpose, 2022-2032

Figure 54: Latin America Customisation and Personalisation in Travel Market Value (US$ Mn) by Travel Type, 2022-2032

Figure 55: Latin America Customisation and Personalisation in Travel Market Value (US$ Mn) by Country, 2022-2032

Figure 56: Latin America Customisation and Personalisation in Travel Market Value (US$ Mn) Analysis by Country, 2017-2032

Figure 57: Latin America Customisation and Personalisation in Travel Market Value Share (%) and BPS Analysis by Country, 2022-2032

Figure 58: Latin America Customisation and Personalisation in Travel Market Y-o-Y Growth (%) Projections by Country, 2022-2032

Figure 59: Latin America Customisation and Personalisation in Travel Market Value (US$ Mn) Analysis by Service Type, 2017-2032

Figure 60: Latin America Customisation and Personalisation in Travel Market Value Share (%) and BPS Analysis by Service Type, 2022-2032

Figure 61: Latin America Customisation and Personalisation in Travel Market Y-o-Y Growth (%) Projections by Service Type, 2022-2032

Figure 62: Latin America Customisation and Personalisation in Travel Market Value (US$ Mn) Analysis by Mode of Booking, 2017-2032

Figure 63: Latin America Customisation and Personalisation in Travel Market Value Share (%) and BPS Analysis by Mode of Booking, 2022-2032

Figure 64: Latin America Customisation and Personalisation in Travel Market Y-o-Y Growth (%) Projections by Mode of Booking, 2022-2032

Figure 65: Latin America Customisation and Personalisation in Travel Market Value (US$ Mn) Analysis by Purpose, 2017-2032

Figure 66: Latin America Customisation and Personalisation in Travel Market Value Share (%) and BPS Analysis by Purpose, 2022-2032

Figure 67: Latin America Customisation and Personalisation in Travel Market Y-o-Y Growth (%) Projections by Purpose, 2022-2032

Figure 68: Latin America Customisation and Personalisation in Travel Market Value (US$ Mn) Analysis by Travel Type, 2017-2032

Figure 69: Latin America Customisation and Personalisation in Travel Market Value Share (%) and BPS Analysis by Travel Type, 2022-2032

Figure 70: Latin America Customisation and Personalisation in Travel Market Y-o-Y Growth (%) Projections by Travel Type, 2022-2032

Figure 71: Latin America Customisation and Personalisation in Travel Market Attractiveness by Service Type, 2022-2032

Figure 72: Latin America Customisation and Personalisation in Travel Market Attractiveness by Mode of Booking, 2022-2032

Figure 73: Latin America Customisation and Personalisation in Travel Market Attractiveness by Purpose, 2022-2032

Figure 74: Latin America Customisation and Personalisation in Travel Market Attractiveness by Travel Type, 2022-2032

Figure 75: Latin America Customisation and Personalisation in Travel Market Attractiveness by Country, 2022-2032

Figure 76: Europe Customisation and Personalisation in Travel Market Value (US$ Mn) by Service Type, 2022-2032

Figure 77: Europe Customisation and Personalisation in Travel Market Value (US$ Mn) by Mode of Booking, 2022-2032

Figure 78: Europe Customisation and Personalisation in Travel Market Value (US$ Mn) by Purpose, 2022-2032

Figure 79: Europe Customisation and Personalisation in Travel Market Value (US$ Mn) by Travel Type, 2022-2032

Figure 80: Europe Customisation and Personalisation in Travel Market Value (US$ Mn) by Country, 2022-2032

Figure 81: Europe Customisation and Personalisation in Travel Market Value (US$ Mn) Analysis by Country, 2017-2032

Figure 82: Europe Customisation and Personalisation in Travel Market Value Share (%) and BPS Analysis by Country, 2022-2032

Figure 83: Europe Customisation and Personalisation in Travel Market Y-o-Y Growth (%) Projections by Country, 2022-2032

Figure 84: Europe Customisation and Personalisation in Travel Market Value (US$ Mn) Analysis by Service Type, 2017-2032

Figure 85: Europe Customisation and Personalisation in Travel Market Value Share (%) and BPS Analysis by Service Type, 2022-2032

Figure 86: Europe Customisation and Personalisation in Travel Market Y-o-Y Growth (%) Projections by Service Type, 2022-2032

Figure 87: Europe Customisation and Personalisation in Travel Market Value (US$ Mn) Analysis by Mode of Booking, 2017-2032

Figure 88: Europe Customisation and Personalisation in Travel Market Value Share (%) and BPS Analysis by Mode of Booking, 2022-2032

Figure 89: Europe Customisation and Personalisation in Travel Market Y-o-Y Growth (%) Projections by Mode of Booking, 2022-2032

Figure 90: Europe Customisation and Personalisation in Travel Market Value (US$ Mn) Analysis by Purpose, 2017-2032

Figure 91: Europe Customisation and Personalisation in Travel Market Value Share (%) and BPS Analysis by Purpose, 2022-2032

Figure 92: Europe Customisation and Personalisation in Travel Market Y-o-Y Growth (%) Projections by Purpose, 2022-2032

Figure 93: Europe Customisation and Personalisation in Travel Market Value (US$ Mn) Analysis by Travel Type, 2017-2032

Figure 94: Europe Customisation and Personalisation in Travel Market Value Share (%) and BPS Analysis by Travel Type, 2022-2032

Figure 95: Europe Customisation and Personalisation in Travel Market Y-o-Y Growth (%) Projections by Travel Type, 2022-2032

Figure 96: Europe Customisation and Personalisation in Travel Market Attractiveness by Service Type, 2022-2032

Figure 97: Europe Customisation and Personalisation in Travel Market Attractiveness by Mode of Booking, 2022-2032

Figure 98: Europe Customisation and Personalisation in Travel Market Attractiveness by Purpose, 2022-2032

Figure 99: Europe Customisation and Personalisation in Travel Market Attractiveness by Travel Type, 2022-2032

Figure 100: Europe Customisation and Personalisation in Travel Market Attractiveness by Country, 2022-2032

Figure 101: Asia Pacific Customisation and Personalisation in Travel Market Value (US$ Mn) by Service Type, 2022-2032

Figure 102: Asia Pacific Customisation and Personalisation in Travel Market Value (US$ Mn) by Mode of Booking, 2022-2032

Figure 103: Asia Pacific Customisation and Personalisation in Travel Market Value (US$ Mn) by Purpose, 2022-2032

Figure 104: Asia Pacific Customisation and Personalisation in Travel Market Value (US$ Mn) by Travel Type, 2022-2032

Figure 105: Asia Pacific Customisation and Personalisation in Travel Market Value (US$ Mn) by Country, 2022-2032

Figure 106: Asia Pacific Customisation and Personalisation in Travel Market Value (US$ Mn) Analysis by Country, 2017-2032

Figure 107: Asia Pacific Customisation and Personalisation in Travel Market Value Share (%) and BPS Analysis by Country, 2022-2032

Figure 108: Asia Pacific Customisation and Personalisation in Travel Market Y-o-Y Growth (%) Projections by Country, 2022-2032

Figure 109: Asia Pacific Customisation and Personalisation in Travel Market Value (US$ Mn) Analysis by Service Type, 2017-2032

Figure 110: Asia Pacific Customisation and Personalisation in Travel Market Value Share (%) and BPS Analysis by Service Type, 2022-2032

Figure 111: Asia Pacific Customisation and Personalisation in Travel Market Y-o-Y Growth (%) Projections by Service Type, 2022-2032

Figure 112: Asia Pacific Customisation and Personalisation in Travel Market Value (US$ Mn) Analysis by Mode of Booking, 2017-2032

Figure 113: Asia Pacific Customisation and Personalisation in Travel Market Value Share (%) and BPS Analysis by Mode of Booking, 2022-2032

Figure 114: Asia Pacific Customisation and Personalisation in Travel Market Y-o-Y Growth (%) Projections by Mode of Booking, 2022-2032

Figure 115: Asia Pacific Customisation and Personalisation in Travel Market Value (US$ Mn) Analysis by Purpose, 2017-2032

Figure 116: Asia Pacific Customisation and Personalisation in Travel Market Value Share (%) and BPS Analysis by Purpose, 2022-2032

Figure 117: Asia Pacific Customisation and Personalisation in Travel Market Y-o-Y Growth (%) Projections by Purpose, 2022-2032

Figure 118: Asia Pacific Customisation and Personalisation in Travel Market Value (US$ Mn) Analysis by Travel Type, 2017-2032

Figure 119: Asia Pacific Customisation and Personalisation in Travel Market Value Share (%) and BPS Analysis by Travel Type, 2022-2032

Figure 120: Asia Pacific Customisation and Personalisation in Travel Market Y-o-Y Growth (%) Projections by Travel Type, 2022-2032

Figure 121: Asia Pacific Customisation and Personalisation in Travel Market Attractiveness by Service Type, 2022-2032

Figure 122: Asia Pacific Customisation and Personalisation in Travel Market Attractiveness by Mode of Booking, 2022-2032

Figure 123: Asia Pacific Customisation and Personalisation in Travel Market Attractiveness by Purpose, 2022-2032

Figure 124: Asia Pacific Customisation and Personalisation in Travel Market Attractiveness by Travel Type, 2022-2032

Figure 125: Asia Pacific Customisation and Personalisation in Travel Market Attractiveness by Country, 2022-2032

Figure 126: Middle East and Africa Customisation and Personalisation in Travel Market Value (US$ Mn) by Service Type, 2022-2032

Figure 127: Middle East and Africa Customisation and Personalisation in Travel Market Value (US$ Mn) by Mode of Booking, 2022-2032

Figure 128: Middle East and Africa Customisation and Personalisation in Travel Market Value (US$ Mn) by Purpose, 2022-2032

Figure 129: Middle East and Africa Customisation and Personalisation in Travel Market Value (US$ Mn) by Travel Type, 2022-2032

Figure 130: Middle East and Africa Customisation and Personalisation in Travel Market Value (US$ Mn) by Country, 2022-2032

Figure 131: Middle East and Africa Customisation and Personalisation in Travel Market Value (US$ Mn) Analysis by Country, 2017-2032

Figure 132: Middle East and Africa Customisation and Personalisation in Travel Market Value Share (%) and BPS Analysis by Country, 2022-2032

Figure 133: Middle East and Africa Customisation and Personalisation in Travel Market Y-o-Y Growth (%) Projections by Country, 2022-2032

Figure 134: Middle East and Africa Customisation and Personalisation in Travel Market Value (US$ Mn) Analysis by Service Type, 2017-2032

Figure 135: Middle East and Africa Customisation and Personalisation in Travel Market Value Share (%) and BPS Analysis by Service Type, 2022-2032

Figure 136: Middle East and Africa Customisation and Personalisation in Travel Market Y-o-Y Growth (%) Projections by Service Type, 2022-2032

Figure 137: Middle East and Africa Customisation and Personalisation in Travel Market Value (US$ Mn) Analysis by Mode of Booking, 2017-2032

Figure 138: Middle East and Africa Customisation and Personalisation in Travel Market Value Share (%) and BPS Analysis by Mode of Booking, 2022-2032

Figure 139: Middle East and Africa Customisation and Personalisation in Travel Market Y-o-Y Growth (%) Projections by Mode of Booking, 2022-2032

Figure 140: Middle East and Africa Customisation and Personalisation in Travel Market Value (US$ Mn) Analysis by Purpose, 2017-2032

Figure 141: Middle East and Africa Customisation and Personalisation in Travel Market Value Share (%) and BPS Analysis by Purpose, 2022-2032

Figure 142: Middle East and Africa Customisation and Personalisation in Travel Market Y-o-Y Growth (%) Projections by Purpose, 2022-2032

Figure 143: Middle East and Africa Customisation and Personalisation in Travel Market Value (US$ Mn) Analysis by Travel Type, 2017-2032

Figure 144: Middle East and Africa Customisation and Personalisation in Travel Market Value Share (%) and BPS Analysis by Travel Type, 2022-2032

Figure 145: Middle East and Africa Customisation and Personalisation in Travel Market Y-o-Y Growth (%) Projections by Travel Type, 2022-2032

Figure 146: Middle East and Africa Customisation and Personalisation in Travel Market Attractiveness by Service Type, 2022-2032

Figure 147: Middle East and Africa Customisation and Personalisation in Travel Market Attractiveness by Mode of Booking, 2022-2032

Figure 148: Middle East and Africa Customisation and Personalisation in Travel Market Attractiveness by Purpose, 2022-2032

Figure 149: Middle East and Africa Customisation and Personalisation in Travel Market Attractiveness by Travel Type, 2022-2032

Figure 150: Middle East and Africa Customisation and Personalisation in Travel Market Attractiveness by Country, 2022-2032

Recommendations

Travel and Tourism

Halal Tourism Market

Published : March 2024

Travel and Tourism

Cruise Tourism Market

Published : July 2023

Travel and Tourism

Tourism Market

Published : November 2022

Travel and Tourism

Cultural Travel Market

Published : June 2022

Explore Travel and Tourism Insights

View Reports

Customisation and Personalisation in Travel Market