Handheld Robotic Navigation Market Forecast and Outlook 2025-2035

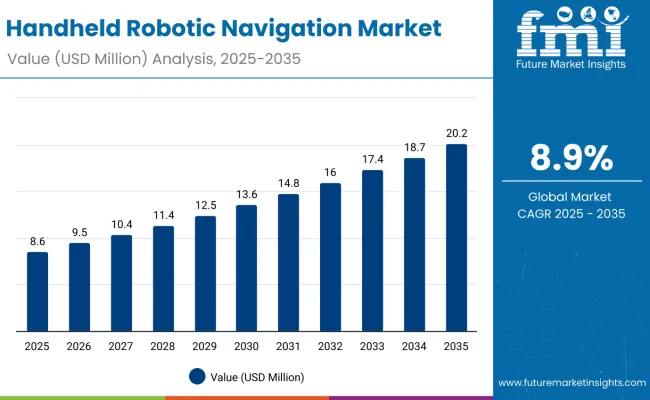
The handheld robotic navigation market is projected to grow from USD 8.6 million in 2025 to approximately USD 20.2 million by 2035, recording an absolute increase of USD 11.6 million over the forecast period. This translates into a total growth of 134.9%, with the market forecast to expand at a compound annual growth rate (CAGR) of 8.9% between 2025 and 2035.

The overall market size is expected to grow by approximately 2.3X during the same period, supported by increasing demand for precision surgical procedures, growing adoption of robotic-assisted surgery, and rising integration of advanced navigation technologies across global hospital and surgical center sectors.
Quick Stats for Handheld Robotic Navigation Market

  • Handheld Robotic Navigation Market Value (2025): USD 8.6 million
  • Handheld Robotic Navigation Market Forecast Value (2035): USD 20.2 million
  • Handheld Robotic Navigation Market Forecast CAGR: 8.9%
  • Leading Autonomy Class in Handheld Robotic Navigation Market: Robotic Stabilization (63.5%)
  • Key Growth Regions in Handheld Robotic Navigation Market: India, Europe, China, USA
  • Key Players in Handheld Robotic Navigation Market: Mendaera, THINK Surgical, Nuviswiss, OrthAlign

Handheld Robotic Navigation Market

Handheld Robotic Navigation Market Key Takeaways

Metric Value
Estimated Value in (2025E) USD 8.6 million
Forecast Value in (2035F) USD 20.2 million
Forecast CAGR (2025 to 2035) 8.90%

Between 2025 and 2030, the handheld robotic navigation market is projected to expand from USD 8.6 million to USD 13.6 million, resulting in a value increase of USD 5.0 million, which represents 43.1% of the total forecast growth for the decade. This phase of development will be shaped by increasing adoption of robotic stabilization technologies, rising demand for precision surgical navigation, and growing utilization in specialized surgical departments. Medical device manufacturers and surgical robotics specialists are expanding their product portfolios to address the growing preference for handheld navigation systems in robotic surgical procedures.

From 2030 to 2035, the market is forecast to grow from USD 13.6 million to USD 20.2 million, adding another USD 6.6 million, which constitutes 56.9% of the overall ten-year expansion. This period is expected to be characterized by the advancement of semi-autonomous execution technologies, the integration of AI-powered navigation platforms for premium surgical procedures, and the development of specialized systems for complex robotic surgical applications. The growing emphasis on surgical precision optimization and patient outcomes will drive demand for advanced handheld robotic navigation systems with enhanced imaging capabilities and improved surgical effectiveness.

Between 2020 and 2024, the handheld robotic navigation market experienced rapid growth, driven by increasing adoption of robotic surgical systems and growing recognition of navigation technologies' effectiveness in enhancing surgical precision across hospital and surgical center applications. The market developed as healthcare providers recognized the potential for handheld robotic navigation to improve surgical outcomes while meeting modern healthcare requirements for minimally invasive treatment options. Technological advancement in surgical robotics and navigation systems began emphasizing the critical importance of maintaining surgical precision while extending patient outcomes and improving surgical success rates.
Opportunity Pathways - Handheld Robotic Navigation Market

Handheld Robotic Navigation Market Pathways

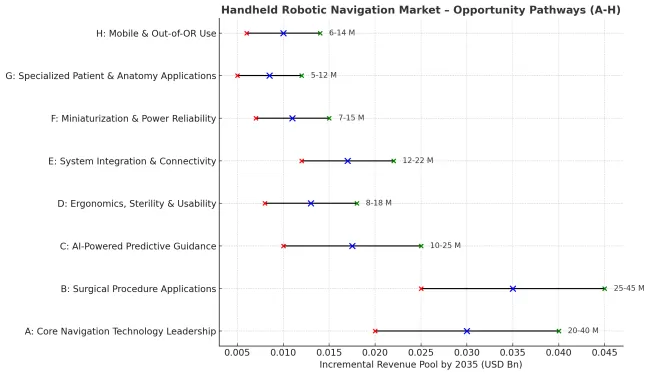
The handheld robotic navigation market represents a high-growth frontier within surgical robotics and advanced navigation systems, projected to expand from an estimated USD 65-80 million in 2025 to USD 180-250 million by 2035, achieving a 12-15% CAGR (2.5-3X growth). Expansion is driven by accelerating adoption of minimally invasive procedures, surgeon demand for flexible low-cost navigation adjuncts, and integration of AI-enabled guidance into portable surgical tools.

This convergence opportunity leverages the need for cost-effective alternatives to full robotic systems, surgeon mobility and control during procedures, and miniaturization of real-time navigation technologies to create handheld devices that deliver precision, portability, and interoperability in the operating room. Orthopedic, spinal, neurosurgical, and ENT procedures dominate demand, with early uptake in developed markets where surgical robotics penetration and capital investment are highest.

Pathway A - Core Navigation Technology Leadership

The leading value segment, focused on precision mapping and real-time localization through sensor fusion (optical, IMU, ultrasound, LiDAR). Companies that achieve sub-millimeter accuracy with robust, drift-resistant handheld navigation systems will secure early leadership. Expected revenue pool: USD 20-40 million

Pathway B - Surgical Procedure Applications (Spine, Ortho, Neuro, ENT)

The dominant application driver, reflecting demand for procedure-specific handheld tools tailored to spine implants, neurosurgical targeting, orthopedic alignment, and ENT micro-navigation. Providers developing specialty variants validated in clinical workflows will capture this core growth. Opportunity: USD 25-45 million

Pathway C - AI-Powered Predictive Guidance

Next-generation solutions require intelligent assistance with predictive path planning, automated safety boundaries, and recognition of anatomical structures. Companies investing in AI algorithms with strong clinical validation will gain premium positioning. Revenue uplift: USD 10-25 million

Pathway D - Ergonomics, Sterility & Usability

Surgeon acceptance depends on lightweight, ergonomically optimized designs with haptic feedback, sterilizable housings, and disposable covers. Products delivering superior ease-of-use in the operating room will reduce adoption friction and boost compliance. Expected upside: USD 8-18 million

Pathway E - System Integration & Connectivity

Solutions that integrate seamlessly with imaging modalities (CT, MRI, fluoroscopy), hospital PACS, and robotic surgical suites provide higher value for providers. Companies delivering plug-and-play interoperability will build defensible ecosystems. USD 12-22 million

Pathway F - Miniaturization & Power Reliability

Handheld systems require compact sensors, long battery life, and consistent reliability under sterilization cycles. Firms advancing in power management, embedded compute, and ruggedized designs will differentiate strongly. Pool: USD 7-15 million

Pathway G - Specialized Patient & Anatomy Applications

Developing devices tailored for pediatrics, small-anatomy navigation (inner ear, deep brain), and soft tissue deformation cases offers niche but high-value opportunities beyond standard adult use cases. Expected revenue: USD 5-12 million

Pathway H - Mobile & Out-of-OR Use

Emerging adoption in ambulatory surgical centers, remote hospitals, and outpatient clinics creates demand for rugged, portable, cost-efficient handheld navigators. Companies addressing this segment will unlock incremental growth. Pool: USD 6-14 million

Why is the Handheld Robotic Navigation Market Growing?

Market expansion is being supported by the increasing global demand for precision surgical procedures and the corresponding shift toward robotic-assisted surgical technologies that can provide superior patient outcomes while meeting healthcare requirements for precise and effective surgical intervention. Modern healthcare providers are increasingly focused on incorporating advanced handheld robotic navigation techniques to enhance surgical success rates while satisfying demands for comprehensive robotic surgery services and specialized surgical navigation capabilities. Handheld robotic navigation systems' proven ability to deliver effective surgical guidance, precision enhancement, and surgeon satisfaction makes them essential technologies for robotic surgery programs and specialized surgical departments.

The growing emphasis on personalized surgical care and precision medicine is driving demand for high-quality handheld robotic navigation systems that can support distinctive surgical outcomes and comprehensive robotic surgery positioning across hospital, surgical center, and specialized robotics categories. Healthcare provider preference for technologies that combine surgical excellence with advanced navigation capabilities is creating opportunities for innovative handheld robotic navigation implementations in both traditional and emerging surgical applications. The rising influence of minimally invasive surgery programs and precision surgical initiatives is also contributing to increased adoption of specialized handheld robotic navigation systems that can provide authentic surgical enhancement characteristics.

Segmental Analysis

The market is segmented by autonomy class, imaging modality, end user, and region. By autonomy class, the market is divided into robotic stabilization and semi-autonomous execution. Based on imaging modality, the market is categorized into ultrasound-only and CT/fluoro plan. By end user, the market covers hospitals, large tertiary & academic hospitals, and ambulatory surgical centers. Regionally, the market is divided into North America, Europe, Asia Pacific, Latin America, and the Middle East & Africa.
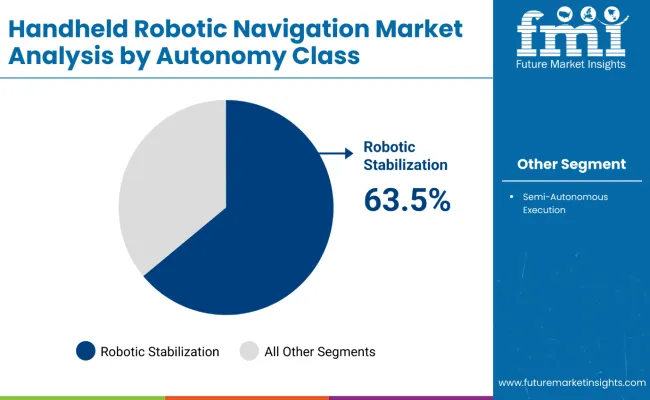
By Autonomy Class, the Robotic Stabilization Segment Accounts for 63.5% Market Share

Handheld Robotic Navigation Market By Autonomy

The robotic stabilization segment is projected to account for 63.5% of the handheld robotic navigation market in 2025, reaffirming its position as the leading autonomy class category. Medical device manufacturers and surgical robotics producers increasingly utilize robotic stabilization for its superior precision capabilities, surgical compatibility, and essential functionality in robotic navigation procedures across diverse surgical applications. Robotic stabilization's standardized design elements and proven effectiveness directly address the clinical requirements for precise surgical guidance and optimal procedural outcomes in robotic surgical operations.

This autonomy class forms the foundation of modern handheld robotic navigation applications, as it represents the technology with the greatest surgical precision potential and established compatibility across multiple robotic surgical systems. Manufacturer investments in robotic stabilization optimization and specialized design continue to strengthen adoption among medical equipment producers. With healthcare providers prioritizing surgical precision and patient outcomes, robotic stabilization aligns with both clinical effectiveness objectives and safety assurance requirements, making it the central component of comprehensive handheld robotic navigation surgical strategies.
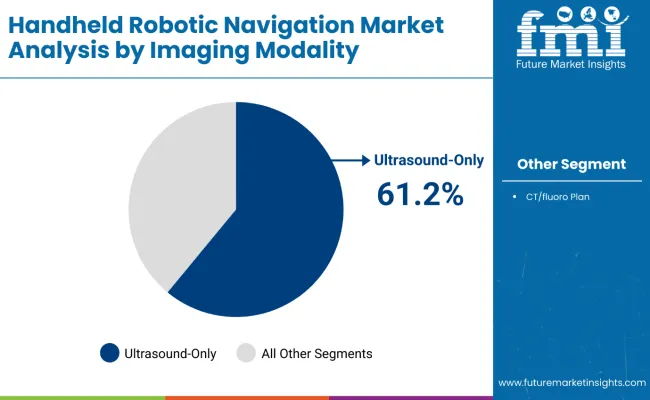
By Imaging Modality, Ultrasound-Only Segment Leads Market Demand

Handheld Robotic Navigation Market By Imaging Modality

Ultrasound-only imaging modalities are projected to represent 61.2% of the handheld robotic navigation market in 2025, underscoring their critical role as the primary imaging technology for real-time surgical navigation and precision guidance applications. Healthcare providers and surgeons prefer ultrasound-only approaches for their exceptional real-time visualization capabilities, non-invasive imaging features, and ability to provide continuous surgical guidance while supporting advanced robotic surgical requirements during complex navigation procedures. Positioned as essential technologies for high-performance robotic surgery, ultrasound-only imaging offers both technological advancement and clinical effectiveness advantages.

The segment is supported by continuous advancement in ultrasound imaging technology and the growing availability of specialized integration programs that enable enhanced surgical visualization and procedural outcome optimization at the imaging level. Additionally, surgical teams are investing in advanced ultrasound-only techniques to support clinical excellence and improved surgical outcomes. As ultrasound imaging technology continues to advance and healthcare providers seek superior visualization solutions, ultrasound-only imaging will continue to dominate the imaging landscape while supporting technology advancement and surgical outcome optimization strategies.
By End User, Hospitals Segment Leads Market Demand

Handheld Robotic Navigation Market By End User

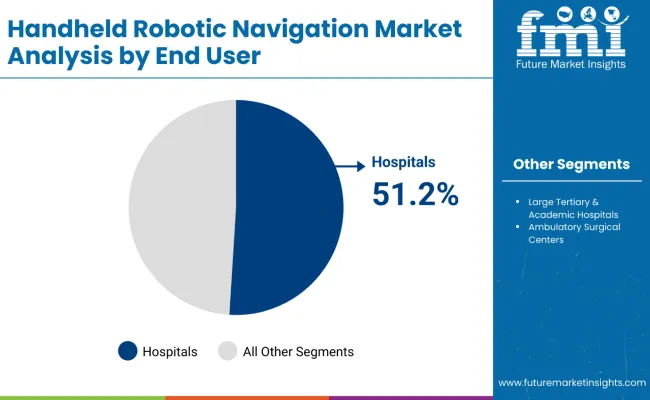
Hospitals are projected to represent 51.2% of the handheld robotic navigation market in 2025, underscoring their critical role as the primary end user for specialized robotic surgical services and comprehensive surgical navigation applications. Healthcare administrators and surgical departments prefer hospital-based handheld robotic navigation services for their comprehensive surgical capabilities, specialized equipment availability, and ability to provide integrated robotic surgery while supporting complex surgical requirements during advanced navigation procedures. Positioned as essential facilities for high-performance robotic surgery, hospitals offer both technological resources and clinical expertise advantages.

The segment is supported by continuous investment in robotic surgical capabilities and the growing establishment of specialized robotic surgery programs that enable comprehensive patient care and advanced surgical outcomes at the institutional level. Additionally, hospitals are expanding their robotic surgery services to support market differentiation and comprehensive surgical positioning. As robotic surgery continues to advance and institutions seek specialized service offerings, hospitals will continue to dominate the end user landscape while supporting clinical excellence and comprehensive robotic surgery strategies.

What are the Drivers, Restraints, and Key Trends of the Handheld Robotic Navigation Market?

The handheld robotic navigation market is advancing rapidly due to increasing surgical robotics adoption and growing demand for precision navigation solutions that emphasize superior surgical outcomes across hospital and surgical center applications. However, the market faces challenges, including high system costs compared to traditional surgical navigation, limited availability of specialized robotic surgery expertise, and competition from established surgical navigation technologies. Innovation in robotic stabilization techniques and surgical robotics training continues to influence market development and expansion patterns.

Expansion of Advanced Robotic Stabilization Applications

The growing adoption of handheld robotic navigation in comprehensive robotic surgery programs and specialized precision surgical applications is enabling medical device manufacturers to develop products that provide distinctive navigation capabilities while commanding premium positioning and enhanced clinical outcome characteristics. Advanced applications provide superior precision while allowing more sophisticated robotic surgical development across various surgical categories and specialty segments. Manufacturers are increasingly recognizing the competitive advantages of robotic stabilization technology positioning for premium product development and surgical robotics market penetration.

Integration of Surgical Outcome Optimization Programs

Modern handheld robotic navigation providers are incorporating advanced surgical planning systems, outcome tracking technologies, and procedural management protocols to enhance surgical success rates, improve precision surgical outcomes, and meet healthcare demands for evidence-based robotic surgical solutions. These programs improve navigation effectiveness while enabling new applications, including personalized surgical planning and integrated robotic surgical systems. Advanced outcome integration also allows providers to support premium market positioning and clinical excellence leadership beyond traditional surgical navigation products.
Analysis of the Handheld Robotic Navigation Market by Key Country

Handheld Robotic Navigation Market By Country

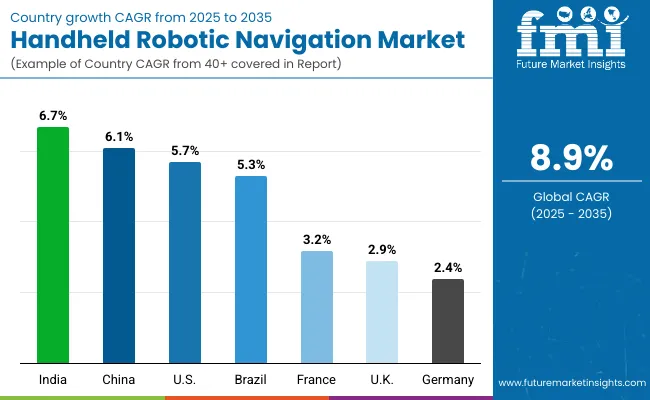
Countries CAGR (2025 to 2035)
India 6.70%
China 6.10%
USA 5.70%
Brazil 5.30%
France 3.20%
UK 2.90%
Germany 2.40%

The handheld robotic navigation market is experiencing robust growth globally, with India leading at a 6.7% CAGR through 2035, driven by the expanding healthcare infrastructure, growing surgical robotics adoption, and increasing investment in precision surgery services. Europe follows at 6.5%, supported by advanced medical technology infrastructure, comprehensive surgical robotics programs, and strong healthcare system integration.

China shows growth at 6.1%, emphasizing healthcare modernization and surgical technology advancement. The USA records 5.7%, focusing on advanced robotic surgery capabilities and specialized surgical expertise while maintaining market leadership in surgical innovation. Brazil demonstrates 5.3% growth, prioritizing healthcare technology access and surgical modernization initiatives. France exhibits 3.2% growth, supported by advanced medical technology and specialized surgical centers. The UK demonstrates 2.9% growth, focusing on NHS surgical technology integration and private surgical services expansion.

The report covers an in-depth analysis of 40+ countries; seven top-performing countries are highlighted below.

USA Handheld Robotic Navigation Market Driven by Advanced Surgical Technology

Revenue from handheld robotic navigation systems in the United States is projected to grow at a CAGR of 5.7% through 2035, supported by strong demand for precision surgical solutions and advanced adoption of robotic-assisted surgical technologies across established healthcare systems. The country's mature surgical robotics ecosystem, coupled with rising awareness of navigation system benefits, is driving consistent expansion. Leading medical device manufacturers and surgical specialists continue to invest in innovation, offering high-quality handheld robotic navigation solutions within a well-regulated clinical environment.

  • Established healthcare infrastructure and comprehensive surgical robotics programs are supporting access to handheld robotic navigation systems across hospitals, surgical centers, and specialized robotic surgery departments nationwide.
  • Ongoing advancements in robotic stabilization techniques, alongside healthcare provider awareness of surgical precision enhancement, are reinforcing steady market adoption with strong growth outlook.

Germany Handheld Robotic Navigation Market Supported by Incremental Adoption of Surgical Robotics

Revenue from handheld robotic navigation systems in Germany is projected to grow at a CAGR of 2.4% through 2035, reflecting steady but moderate expansion as hospitals and surgical centers selectively integrate robotic-assisted navigation technologies. Germany’s strong medical device manufacturing base and well-established healthcare reimbursement structures provide a solid foundation, though adoption rates remain measured compared to higher-growth markets. Investment in advanced surgical navigation tools is gradually increasing, driven by the country’s emphasis on precision, patient safety, and high clinical outcomes.

  • Robust hospital infrastructure and structured surgical robotics programs enable controlled but reliable access to handheld robotic navigation systems, particularly across university hospitals and large regional medical centers.
  • Progressive advancements in robotic-assisted navigation, supported by surgeon training initiatives and evidence-based clinical studies, are facilitating gradual adoption, ensuring Germany maintains a stable trajectory within Europe’s broader surgical robotics landscape.

India Leads Global Market Growth with Healthcare Infrastructure Expansion

Revenue from handheld robotic navigation systems in India is projected to exhibit strong growth with a CAGR of 6.7% through 2035, driven by the rapidly expanding healthcare infrastructure and government initiatives supporting surgical technology advancement across major urban centers. The country's growing surgical robotics awareness and increasing acceptance of precision surgical treatments are creating substantial demand for handheld robotic navigation systems in both public and private healthcare settings. Major medical device manufacturers and surgical specialists are establishing comprehensive service capabilities to serve both domestic consumption and regional markets.

  • Rising healthcare investment and expanding surgical technology access are driving demand for handheld robotic navigation systems across hospitals, surgical centers, and specialized robotic surgery departments throughout major Indian metropolitan areas.
  • Strong government support for healthcare modernization initiatives and medical technology advancement is supporting the rapid adoption of precision surgical systems among healthcare providers seeking to meet evolving clinical needs and surgical standards.

China Strengthens Market with Healthcare Modernization

Revenue from handheld robotic navigation systems in China is projected to grow at a CAGR of 6.1% through 2035, supported by the country's comprehensive healthcare modernization initiatives, expanding surgical technology infrastructure, and established commitment to precision surgery requiring specialized navigation solutions. Chinese healthcare providers and patients consistently seek innovative surgical treatments that enhance procedural accuracy for both public and private healthcare applications. The country's position as a healthcare technology leader continues to drive innovation in surgical robotics applications and treatment standards.

  • Comprehensive surgical technology services and expanding healthcare infrastructure are driving demand for handheld robotic navigation systems across public hospitals, private medical centers, and specialized surgical centers seeking to enhance precision surgery outcomes and technological capabilities.
  • Increasing focus on healthcare modernization and surgical excellence is supporting the adoption of advanced navigation solutions among healthcare providers and patients seeking precision surgical alternatives in regional markets with established clinical expertise.

Brazil Anchors Growth with Healthcare Technology Development

Revenue from handheld robotic navigation systems in Brazil is projected to grow at a CAGR of 5.3% through 2035, supported by the country's expanding healthcare technology infrastructure, growing surgical modernization initiatives, and increasing adoption of specialized precision surgery requiring navigation solutions. Brazilian healthcare providers and patients prioritize comprehensive surgical care and advanced procedural techniques, making handheld robotic navigation systems essential tools for both public and private healthcare applications. The country's comprehensive healthcare development and clinical care patterns support continued market expansion.

  • Expanding healthcare infrastructure and growing surgical technology access are driving demand for specialized handheld robotic navigation systems across public hospitals, private clinics, and surgical centers serving domestic and regional markets with comprehensive precision surgery services.
  • Strong focus on healthcare accessibility and surgical advancement is encouraging medical providers to adopt navigation systems that support comprehensive positioning and meet Brazilian quality standards for precision surgical care applications.

France Demonstrates Steady Growth with Advanced Medical Centers

Revenue from handheld robotic navigation systems in France is projected to grow at a CAGR of 3.2% through 2035, supported by the country's advanced medical technology sector, specialized surgical centers, and established expertise in precision surgical procedures. French healthcare providers' focus on innovation, clinical excellence, and comprehensive patient care creates steady demand for handheld robotic navigation systems. The country's attention to technology integration and surgical outcomes drives consistent adoption across both university medical centers and specialized surgical clinic applications.

  • Advanced medical technology capabilities and specialized surgical centers are driving steady demand for handheld robotic navigation systems across university hospitals, private clinics, and medical centers seeking superior surgical capabilities and clinical outcome enhancement.
  • Strong innovation culture and clinical research focus are supporting the adoption of advanced navigation techniques among healthcare providers seeking to meet French quality expectations and clinical standards for specialized precision surgery.

UK Maintains Position with Healthcare System Integration

Revenue from handheld robotic navigation systems in the United Kingdom is projected to grow at a CAGR of 2.9% through 2035, driven by the country's comprehensive National Health Service surgical programs, expanding private surgical technology sector, and established expertise in precision surgery requiring specialized navigation solutions. British healthcare providers and patients consistently seek innovative surgical treatments that enhance procedural precision for both NHS and private healthcare applications. The country's position as a European healthcare leader continues to drive innovation in surgical technology applications and treatment standards.
  • Comprehensive surgical services and expanding private healthcare technology options are driving demand for handheld robotic navigation systems across NHS trusts, private hospitals, and specialized surgical centers seeking to enhance precision surgery outcomes and patient choice.
  • Increasing focus on surgical modernization and healthcare technology integration is supporting the adoption of advanced navigation solutions among healthcare providers and patients seeking precision surgical alternatives in regional markets with established clinical expertise.

Europe Market Split by Country

Handheld Robotic Navigation Market Europe

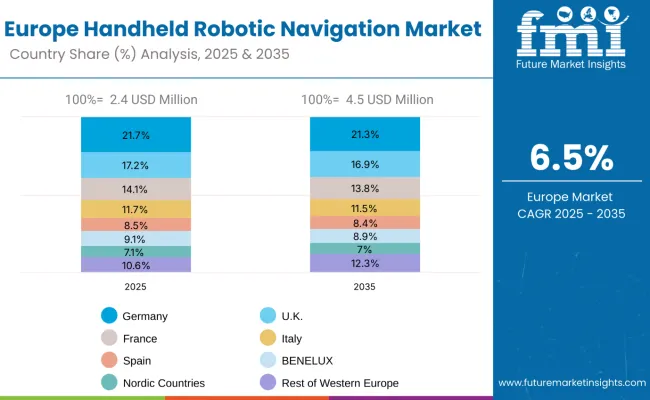
The Europe handheld robotic navigation market is projected to grow from USD 2.4 million in 2025 to USD 4.5 million by 2035, recording a CAGR of 6.5% over the forecast period. Germany leads with a 21.7% share in 2025, maintaining 21.3% by 2035, supported by advanced healthcare infrastructure and strong surgical technology adoption. The United Kingdom follows with 17.2% in 2025, declining slightly to 16.9% by 2035, driven by steady clinical demand but moderated by healthcare cost controls. France accounts for 14.1% in 2025, declining to 13.8% by 2035, reflecting moderate growth from surgical technology centers.

Italy holds 11.7% in 2025, declining to 11.5% by 2035, facing slower adoption rates. Spain contributes 8.5% in 2025, declining to 8.4% in 2035, reflecting stable demand patterns. BENELUX maintains 9.1% in 2025, declining slightly to 8.9% in 2035. The Nordic countries hold 7.1% in 2025, maintaining 7.0% in 2035, supported by high per-capita healthcare spending. The Rest of Western Europe moderates from 10.6% in 2025 to 12.3% in 2035, reflecting varied growth patterns across smaller healthcare markets.
Japan Market Split by Imaging Modality

Handheld Robotic Navigation Market Japan

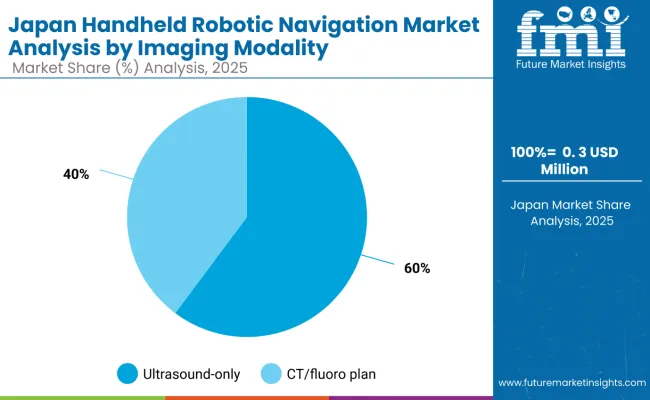
The Japan handheld robotic navigation market is valued at USD 0.3 million in 2025, with ultrasound-only systems holding the lead at 60% share, supported by demand for real-time imaging in advanced surgical procedures. CT/fluoro plan follows with 40%, driven by specialized surgical applications and established imaging protocols. The market distribution highlights Japan's focus on advanced imaging integration and precision surgical capabilities across specialized medical centers.
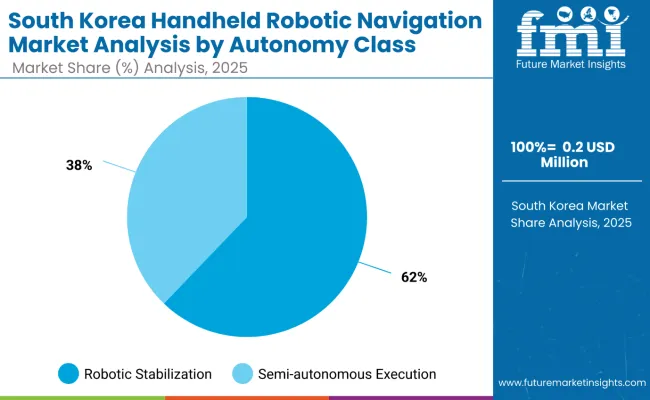
South Korea Market Split by Autonomy Class

Handheld Robotic Navigation Market South Korea

The South Korea handheld robotic navigation market is valued at USD 0.2 million in 2025, led by robotic stabilization at 62% share, supported by growing clinical demand and advanced surgical technology adoption. Semi-autonomous execution holds 38%, driven by emerging surgical robotics applications and technology advancement initiatives. The distribution reflects South Korea's commitment to surgical technology innovation and precision surgery development across specialized healthcare institutions.
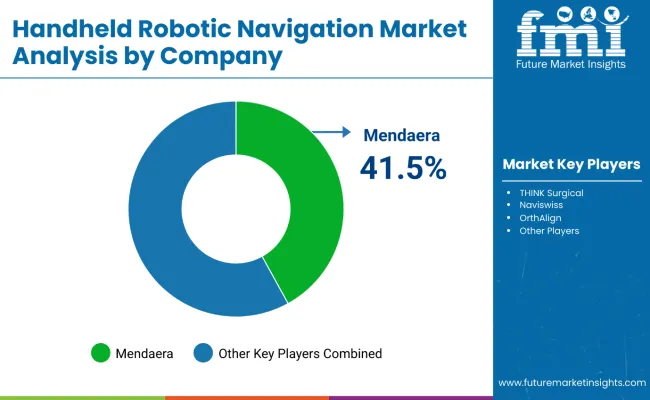
Competitive Landscape of the Handheld Robotic Navigation Market

Handheld Robotic Navigation Market By Company

The handheld robotic navigation market is characterized by competition among established medical device companies, specialized surgical robotics manufacturers, and integrated navigation solution providers. Companies are investing in advanced robotic stabilization technologies, specialized navigation development systems, application-specific product innovation, and comprehensive clinical training capabilities to deliver consistent, high-performance, and effective handheld robotic navigation solutions. Innovation in surgical precision enhancement, procedural outcome optimization, and customized robotic surgery compatibility is central to strengthening market position and clinical satisfaction.

Mendaera leads the market with a 41.5% share, focusing on specialized surgical robotics innovation and comprehensive navigation solutions, offering advanced handheld robotic navigation systems with emphasis on clinical effectiveness and surgical precision excellence. THINK Surgical provides specialized robotic surgery capabilities with a focus on premium surgical technology and integrated navigation systems. Nuviswiss delivers advanced surgical navigation solutions with a focus on precision guidance and operational efficiency. OrthAlign specializes in orthopedic surgical navigation with an emphasis on specialized surgical applications.

Key Players in the Handheld Robotic Navigation Market

  • Mendaera
  • THINK Surgical
  • Nuviswiss
  • OrthAlign
  • Other Players

Scope of the Report

Items Values
Quantitative Units (2025) USD 8.6 Million
Autonomy Class Robotic Stabilization, Semi-Autonomous Execution
Imaging Modality Ultrasound-Only, CT/ Fluoro Plan
End User Hospitals, Large Tertiary & Academic Hospitals, Ambulatory Surgical Centers
Regions Covered North America, Europe, Asia Pacific, Latin America, Middle East & Africa
Countries Covered United States, Canada, United Kingdom, Germany, France, China, Japan, South Korea, India, Brazil, Australia and 40+ countries
Key Companies Profiled Mendaera, THINK Surgical, Nuviswiss, OrthAlign
Additional Attributes Dollar sales by autonomy class, imaging modality, and end user; regional demand trends, competitive landscape, technological advancements in robotic navigation systems, surgical robotics integration initiatives, clinical outcome optimization programs, and precision surgical enhancement strategies

Handheld Robotic Navigation Market by Segments

By Autonomy Class:

  • Robotic Stabilization
  • Semi-Autonomous Execution

By Imaging Modality:

  • Ultrasound-Only
  • CT/Fluoro Plan

By End User:

  • Hospitals
  • Large Tertiary & Academic Hospitals
  • Ambulatory Surgical Centers

By Region:

By North America

  • United States
  • Canada
  • Mexico

By Europe

  • Germany
  • United Kingdom
  • France
  • Italy
  • Spain
  • Nordic Countries
  • BENELUX
  • Rest of Europe

By Asia Pacific

  • China
  • Japan
  • South Korea
  • India
  • ASEAN
  • Australia & New Zealand
  • Rest of Asia Pacific

By Latin America

  • Brazil
  • Chile
  • Rest of Latin America

By Middle East & Africa

  • Kingdom of Saudi Arabia
  • Other GCC Countries
  • Turkey
  • South Africa
  • Other African Union
  • Rest of Middle East & Africa

Table of Content

  1. Executive Summary
    • Global Market Outlook
    • Demand-side Trends
    • Supply-side Trends
    • Technology Roadmap Analysis
    • Analysis and Recommendations
  2. Market Overview
    • Market Coverage / Taxonomy
    • Market Definition / Scope / Limitations
  3. Market Background
    • Market Dynamics
      • Drivers
      • Restraints
      • Opportunity
      • Trends
    • Scenario Forecast
      • Demand in Optimistic Scenario
      • Demand in Likely Scenario
      • Demand in Conservative Scenario
    • Opportunity Map Analysis
    • Product Life Cycle Analysis
    • Supply Chain Analysis
      • Supply Side Participants and their Roles
        • Producers
        • Mid-Level Participants (Traders/ Agents/ Brokers)
        • Wholesalers and Distributors
      • Value Added and Value Created at Node in the Supply Chain
      • List of Raw Material Suppliers
      • List of Existing and Potential Buyer's
    • Investment Feasibility Matrix
    • Value Chain Analysis
      • Profit Margin Analysis
      • Wholesalers and Distributors
      • Retailers
    • PESTLE and Porter's Analysis
    • Regulatory Landscape
      • By Key Regions
      • By Key Countries
    • Regional Parent Market Outlook
    • Production and Consumption Statistics
    • Import and Export Statistics
  4. Global Market Analysis 2020 to 2024 and Forecast, 2025 to 2035
    • Historical Market Size Value (USD Million) & Volume (Units) Analysis, 2020 to 2024
    • Current and Future Market Size Value (USD Million) & Volume (Units) Projections, 2025 to 2035
      • Y-o-Y Growth Trend Analysis
      • Absolute $ Opportunity Analysis
  5. Global Market Pricing Analysis 2020 to 2024 and Forecast 2025 to 2035
  6. Global Market Analysis 2020 to 2024 and Forecast 2025 to 2035, By Autonomy Class
    • Introduction / Key Findings
    • Historical Market Size Value (USD Million) & Volume (Units) Analysis By Autonomy Class, 2020 to 2024
    • Current and Future Market Size Value (USD Million) & Volume (Units) Analysis and Forecast By Autonomy Class, 2025 to 2035
      • Robotic Stabilization
      • Semi-Autonomous Execution
    • Y-o-Y Growth Trend Analysis By Autonomy Class, 2020 to 2024
    • Absolute $ Opportunity Analysis By Autonomy Class, 2025 to 2035
  7. Global Market Analysis 2020 to 2024 and Forecast 2025 to 2035, By Imaging Modality
    • Introduction / Key Findings
    • Historical Market Size Value (USD Million) & Volume (Units) Analysis By Imaging Modality, 2020 to 2024
    • Current and Future Market Size Value (USD Million) & Volume (Units) Analysis and Forecast By Imaging Modality, 2025 to 2035
      • Ultrasound-Only
      • CT/Fluoro Plan
    • Y-o-Y Growth Trend Analysis By Imaging Modality, 2020 to 2024
    • Absolute $ Opportunity Analysis By Imaging Modality, 2025 to 2035
  8. Global Market Analysis 2020 to 2024 and Forecast 2025 to 2035, By End User
    • Introduction / Key Findings
    • Historical Market Size Value (USD Million) & Volume (Units) Analysis By End User, 2020 to 2024
    • Current and Future Market Size Value (USD Million) & Volume (Units) Analysis and Forecast By End User, 2025 to 2035
      • Hospitals
      • Large Tertiary & Academic Hospitals
      • Ambulatory Surgical Centers
    • Y-o-Y Growth Trend Analysis By End User, 2020 to 2024
    • Absolute $ Opportunity Analysis By End User, 2025 to 2035
  9. Global Market Analysis 2020 to 2024 and Forecast 2025 to 2035, By Region
    • Introduction
    • Historical Market Size Value (USD Million) & Volume (Units) Analysis By Region, 2020 to 2024
    • Current Market Size Value (USD Million) & Volume (Units) Analysis and Forecast By Region, 2025 to 2035
      • North America
      • Europe
      • Asia Pacific
      • Latin America
      • Middle East & Africa
    • Market Attractiveness Analysis By Region
  10. North America Market Analysis 2020 to 2024 and Forecast 2025 to 2035, By Country
    • Historical Market Size Value (USD Million) & Volume (Units) Trend Analysis By Market Taxonomy, 2020 to 2024
    • Market Size Value (USD Million) & Volume (Units) Forecast By Market Taxonomy, 2025 to 2035
      • By Country
        • USA
        • Canada
        • Mexico
      • By Autonomy Class
      • By Imaging Modality
      • By End User
    • Market Attractiveness Analysis
      • By Country
      • By Autonomy Class
      • By Imaging Modality
      • By End User
    • Key Takeaways
  11. Europe Market Analysis 2020 to 2024 and Forecast 2025 to 2035, By Country
    • Historical Market Size Value (USD Million) & Volume (Units) Trend Analysis By Market Taxonomy, 2020 to 2024
    • Market Size Value (USD Million) & Volume (Units) Forecast By Market Taxonomy, 2025 to 2035
      • By Country
        • Germany
        • UK
        • France
        • Italy
        • Spain
        • BENELUX
        • Nordic Countries
        • Rest of Europe
      • By Autonomy Class
      • By Imaging Modality
      • By End User
    • Market Attractiveness Analysis
      • By Country
      • By Autonomy Class
      • By Imaging Modality
      • By End User
    • Key Takeaways
  12. Asia Pacific Market Analysis 2020 to 2024 and Forecast 2025 to 2035, By Country
    • Historical Market Size Value (USD Million) & Volume (Units) Trend Analysis By Market Taxonomy, 2020 to 2024
    • Market Size Value (USD Million) & Volume (Units) Forecast By Market Taxonomy, 2025 to 2035
      • By Country
        • China
        • Japan
        • South Korea
        • India
        • ASEAN Countries
        • Australia & New Zealand
        • Rest of Asia Pacific
      • By Autonomy Class
      • By Imaging Modality
      • By End User
    • Market Attractiveness Analysis
      • By Country
      • By Autonomy Class
      • By Imaging Modality
      • By End User
    • Key Takeaways
  13. Latin America Market Analysis 2020 to 2024 and Forecast 2025 to 2035, By Country
    • Historical Market Size Value (USD Million) & Volume (Units) Trend Analysis By Market Taxonomy, 2020 to 2024
    • Market Size Value (USD Million) & Volume (Units) Forecast By Market Taxonomy, 2025 to 2035
      • By Country
        • Brazil
        • Chile
        • Rest of Latin America
      • By Autonomy Class
      • By Imaging Modality
      • By End User
    • Market Attractiveness Analysis
      • By Country
      • By Autonomy Class
      • By Imaging Modality
      • By End User
    • Key Takeaways
  14. Middle East & Africa Market Analysis 2020 to 2024 and Forecast 2025 to 2035, By Country
    • Historical Market Size Value (USD Million) & Volume (Units) Trend Analysis By Market Taxonomy, 2020 to 2024
    • Market Size Value (USD Million) & Volume (Units) Forecast By Market Taxonomy, 2025 to 2035
      • By Country
        • Saudi Arabia
        • Turkey
        • South Africa
        • Other African Union
        • Rest of Middle East & Africa
      • By Autonomy Class
      • By Imaging Modality
      • By End User
    • Market Attractiveness Analysis
      • By Country
      • By Autonomy Class
      • By Imaging Modality
      • By End User
    • Key Takeaways
  15. Key Countries Market Analysis
    • USA
      • Pricing Analysis
      • Market Share Analysis, 2024
        • By Autonomy Class
        • By Imaging Modality
        • By End User
    • Germany
      • Pricing Analysis
      • Market Share Analysis, 2024
        • By Autonomy Class
        • By Imaging Modality
        • By End User
    • China
      • Pricing Analysis
      • Market Share Analysis, 2024
        • By Autonomy Class
        • By Imaging Modality
        • By End User
    • India
      • Pricing Analysis
      • Market Share Analysis, 2024
        • By Autonomy Class
        • By Imaging Modality
        • By End User
    • Japan
      • Pricing Analysis
      • Market Share Analysis, 2024
        • By Autonomy Class
        • By Imaging Modality
        • By End User
    • Brazil
      • Pricing Analysis
      • Market Share Analysis, 2024
        • By Autonomy Class
        • By Imaging Modality
        • By End User
    • France
      • Pricing Analysis
      • Market Share Analysis, 2024
        • By Autonomy Class
        • By Imaging Modality
        • By End User
    • UK
      • Pricing Analysis
      • Market Share Analysis, 2024
        • By Autonomy Class
        • By Imaging Modality
        • By End User
  16. Market Structure Analysis
    • Competition Dashboard
    • Competition Benchmarking
    • Market Share Analysis of Top Players
      • By Regional
      • By Autonomy Class
      • By Imaging Modality
      • By End User
  17. Competition Analysis
    • Competition Deep Dive
      • Mendaera
        • Overview
        • Product Portfolio
        • Profitability by Market Segments (Product/Age/Sales Channel/Region)
        • Sales Footprint
        • Strategy Overview
          • Marketing Strategy
          • Product Strategy
          • Channel Strategy
      • THINK Surgical
        • Overview
        • Product Portfolio
        • Profitability by Market Segments (Product/Age/Sales Channel/Region)
        • Sales Footprint
        • Strategy Overview
          • Marketing Strategy
          • Product Strategy
          • Channel Strategy
      • Nuviswiss
        • Overview
        • Product Portfolio
        • Profitability by Market Segments (Product/Age/Sales Channel/Region)
        • Sales Footprint
        • Strategy Overview
          • Marketing Strategy
          • Product Strategy
          • Channel Strategy
      • OrthAlign
        • Overview
        • Product Portfolio
        • Profitability by Market Segments (Product/Age/Sales Channel/Region)
        • Sales Footprint
        • Strategy Overview
          • Marketing Strategy
          • Product Strategy
          • Channel Strategy
  18. Assumptions & Acronyms Used
  19. Research Methodology

List of Tables

  • Table 1: Global Market Value (USD Million) Forecast by Region, 2020-2035
  • Table 2: Global Market Volume (Units) Forecast by Region, 2020-2035
  • Table 3: Global Market Value (USD Million) Forecast by Autonomy Class, 2020-2035
  • Table 4: Global Market Volume (Units) Forecast by Autonomy Class, 2020-2035
  • Table 5: Global Market Value (USD Million) Forecast by Imaging Modality, 2020-2035
  • Table 6: Global Market Volume (Units) Forecast by Imaging Modality, 2020-2035
  • Table 7: Global Market Value (USD Million) Forecast by End User, 2020-2035
  • Table 8: Global Market Volume (Units) Forecast by End User, 2020-2035
  • Table 9: North America Market Value (USD Million) Forecast by Country, 2020-2035
  • Table 10: North America Market Volume (Units) Forecast by Country, 2020-2035
  • Table 11: North America Market Value (USD Million) Forecast by Autonomy Class, 2020-2035
  • Table 12: North America Market Volume (Units) Forecast by Autonomy Class, 2020-2035
  • Table 13: North America Market Value (USD Million) Forecast by Imaging Modality, 2020-2035
  • Table 14: North America Market Volume (Units) Forecast by Imaging Modality, 2020-2035
  • Table 15: North America Market Value (USD Million) Forecast by End User, 2020-2035
  • Table 16: North America Market Volume (Units) Forecast by End User, 2020-2035
  • Table 17: Europe Market Value (USD Million) Forecast by Country, 2020-2035
  • Table 18: Europe Market Volume (Units) Forecast by Country, 2020-2035
  • Table 19: Europe Market Value (USD Million) Forecast by Autonomy Class, 2020-2035
  • Table 20: Europe Market Volume (Units) Forecast by Autonomy Class, 2020-2035
  • Table 21: Europe Market Value (USD Million) Forecast by Imaging Modality, 2020-2035
  • Table 22: Europe Market Volume (Units) Forecast by Imaging Modality, 2020-2035
  • Table 23: Europe Market Value (USD Million) Forecast by End User, 2020-2035
  • Table 24: Europe Market Volume (Units) Forecast by End User, 2020-2035
  • Table 25: Asia Pacific Market Value (USD Million) Forecast by Country, 2020-2035
  • Table 26: Asia Pacific Market Volume (Units) Forecast by Country, 2020-2035
  • Table 27: Asia Pacific Market Value (USD Million) Forecast by Autonomy Class, 2020-2035
  • Table 28: Asia Pacific Market Volume (Units) Forecast by Autonomy Class, 2020-2035
  • Table 29: Asia Pacific Market Value (USD Million) Forecast by Imaging Modality, 2020-2035
  • Table 30: Asia Pacific Market Volume (Units) Forecast by Imaging Modality, 2020-2035
  • Table 31: Asia Pacific Market Value (USD Million) Forecast by End User, 2020-2035
  • Table 32: Asia Pacific Market Volume (Units) Forecast by End User, 2020-2035
  • Table 33: Latin America Market Value (USD Million) Forecast by Country, 2020-2035
  • Table 34: Latin America Market Volume (Units) Forecast by Country, 2020-2035
  • Table 35: Latin America Market Value (USD Million) Forecast by Autonomy Class, 2020-2035
  • Table 36: Latin America Market Volume (Units) Forecast by Autonomy Class, 2020-2035
  • Table 37: Latin America Market Value (USD Million) Forecast by Imaging Modality, 2020-2035
  • Table 38: Latin America Market Volume (Units) Forecast by Imaging Modality, 2020-2035
  • Table 39: Latin America Market Value (USD Million) Forecast by End User, 2020-2035
  • Table 40: Latin America Market Volume (Units) Forecast by End User, 2020-2035
  • Table 41: Middle East & Africa Market Value (USD Million) Forecast by Country, 2020-2035
  • Table 42: Middle East & Africa Market Volume (Units) Forecast by Country, 2020-2035
  • Table 43: Middle East & Africa Market Value (USD Million) Forecast by Autonomy Class, 2020-2035
  • Table 44: Middle East & Africa Market Volume (Units) Forecast by Autonomy Class, 2020-2035
  • Table 45: Middle East & Africa Market Value (USD Million) Forecast by Imaging Modality, 2020-2035
  • Table 46: Middle East & Africa Market Volume (Units) Forecast by Imaging Modality, 2020-2035
  • Table 47: Middle East & Africa Market Value (USD Million) Forecast by End User, 2020-2035
  • Table 48: Middle East & Africa Market Volume (Units) Forecast by End User, 2020-2035
  • Table 49: USA Market Value (USD Million) Forecast by Autonomy Class, 2020-2035
  • Table 50: USA Market Volume (Units) Forecast by Autonomy Class, 2020-2035
  • Table 51: USA Market Value (USD Million) Forecast by Imaging Modality, 2020-2035
  • Table 52: USA Market Volume (Units) Forecast by Imaging Modality, 2020-2035
  • Table 53: USA Market Value (USD Million) Forecast by End User, 2020-2035
  • Table 54: USA Market Volume (Units) Forecast by End User, 2020-2035
  • Table 55: Canada Market Value (USD Million) Forecast by Autonomy Class, 2020-2035
  • Table 56: Canada Market Volume (Units) Forecast by Autonomy Class, 2020-2035
  • Table 57: Canada Market Value (USD Million) Forecast by Imaging Modality, 2020-2035
  • Table 58: Canada Market Volume (Units) Forecast by Imaging Modality, 2020-2035
  • Table 59: Canada Market Value (USD Million) Forecast by End User, 2020-2035
  • Table 60: Canada Market Volume (Units) Forecast by End User, 2020-2035
  • Table 61: Mexico Market Value (USD Million) Forecast by Autonomy Class, 2020-2035
  • Table 62: Mexico Market Volume (Units) Forecast by Autonomy Class, 2020-2035
  • Table 63: Mexico Market Value (USD Million) Forecast by Imaging Modality, 2020-2035
  • Table 64: Mexico Market Volume (Units) Forecast by Imaging Modality, 2020-2035
  • Table 65: Mexico Market Value (USD Million) Forecast by End User, 2020-2035
  • Table 66: Mexico Market Volume (Units) Forecast by End User, 2020-2035
  • Table 67: Germany Market Value (USD Million) Forecast by Autonomy Class, 2020-2035
  • Table 68: Germany Market Volume (Units) Forecast by Autonomy Class, 2020-2035
  • Table 69: Germany Market Value (USD Million) Forecast by Imaging Modality, 2020-2035
  • Table 70: Germany Market Volume (Units) Forecast by Imaging Modality, 2020-2035
  • Table 71: Germany Market Value (USD Million) Forecast by End User, 2020-2035
  • Table 72: Germany Market Volume (Units) Forecast by End User, 2020-2035
  • Table 73: UK Market Value (USD Million) Forecast by Autonomy Class, 2020-2035
  • Table 74: UK Market Volume (Units) Forecast by Autonomy Class, 2020-2035
  • Table 75: UK Market Value (USD Million) Forecast by Imaging Modality, 2020-2035
  • Table 76: UK Market Volume (Units) Forecast by Imaging Modality, 2020-2035
  • Table 77: UK Market Value (USD Million) Forecast by End User, 2020-2035
  • Table 78: UK Market Volume (Units) Forecast by End User, 2020-2035
  • Table 79: France Market Value (USD Million) Forecast by Autonomy Class, 2020-2035
  • Table 80: France Market Volume (Units) Forecast by Autonomy Class, 2020-2035
  • Table 81: France Market Value (USD Million) Forecast by Imaging Modality, 2020-2035
  • Table 82: France Market Volume (Units) Forecast by Imaging Modality, 2020-2035
  • Table 83: France Market Value (USD Million) Forecast by End User, 2020-2035
  • Table 84: France Market Volume (Units) Forecast by End User, 2020-2035
  • Table 85: Italy Market Value (USD Million) Forecast by Autonomy Class, 2020-2035
  • Table 86: Italy Market Volume (Units) Forecast by Autonomy Class, 2020-2035
  • Table 87: Italy Market Value (USD Million) Forecast by Imaging Modality, 2020-2035
  • Table 88: Italy Market Volume (Units) Forecast by Imaging Modality, 2020-2035
  • Table 89: Italy Market Value (USD Million) Forecast by End User, 2020-2035
  • Table 90: Italy Market Volume (Units) Forecast by End User, 2020-2035
  • Table 91: Spain Market Value (USD Million) Forecast by Autonomy Class, 2020-2035
  • Table 92: Spain Market Volume (Units) Forecast by Autonomy Class, 2020-2035
  • Table 93: Spain Market Value (USD Million) Forecast by Imaging Modality, 2020-2035
  • Table 94: Spain Market Volume (Units) Forecast by Imaging Modality, 2020-2035
  • Table 95: Spain Market Value (USD Million) Forecast by End User, 2020-2035
  • Table 96: Spain Market Volume (Units) Forecast by End User, 2020-2035
  • Table 97: China Market Value (USD Million) Forecast by Autonomy Class, 2020-2035
  • Table 98: China Market Volume (Units) Forecast by Autonomy Class, 2020-2035
  • Table 99: China Market Value (USD Million) Forecast by Imaging Modality, 2020-2035
  • Table 100: China Market Volume (Units) Forecast by Imaging Modality, 2020-2035
  • Table 101: China Market Value (USD Million) Forecast by End User, 2020-2035
  • Table 102: China Market Volume (Units) Forecast by End User, 2020-2035
  • Table 103: Japan Market Value (USD Million) Forecast by Autonomy Class, 2020-2035
  • Table 104: Japan Market Volume (Units) Forecast by Autonomy Class, 2020-2035
  • Table 105: Japan Market Value (USD Million) Forecast by Imaging Modality, 2020-2035
  • Table 106: Japan Market Volume (Units) Forecast by Imaging Modality, 2020-2035
  • Table 107: Japan Market Value (USD Million) Forecast by End User, 2020-2035
  • Table 108: Japan Market Volume (Units) Forecast by End User, 2020-2035
  • Table 109: South Korea Market Value (USD Million) Forecast by Autonomy Class, 2020-2035
  • Table 110: South Korea Market Volume (Units) Forecast by Autonomy Class, 2020-2035
  • Table 111: South Korea Market Value (USD Million) Forecast by Imaging Modality, 2020-2035
  • Table 112: South Korea Market Volume (Units) Forecast by Imaging Modality, 2020-2035
  • Table 113: South Korea Market Value (USD Million) Forecast by End User, 2020-2035
  • Table 114: South Korea Market Volume (Units) Forecast by End User, 2020-2035
  • Table 115: India Market Value (USD Million) Forecast by Autonomy Class, 2020-2035
  • Table 116: India Market Volume (Units) Forecast by Autonomy Class, 2020-2035
  • Table 117: India Market Value (USD Million) Forecast by Imaging Modality, 2020-2035
  • Table 118: India Market Volume (Units) Forecast by Imaging Modality, 2020-2035
  • Table 119: India Market Value (USD Million) Forecast by End User, 2020-2035
  • Table 120: India Market Volume (Units) Forecast by End User, 2020-2035
  • Table 121: ASEAN Countries Market Value (USD Million) Forecast by Autonomy Class, 2020-2035
  • Table 122: ASEAN Countries Market Volume (Units) Forecast by Autonomy Class, 2020-2035
  • Table 123: ASEAN Countries Market Value (USD Million) Forecast by Imaging Modality, 2020-2035
  • Table 124: ASEAN Countries Market Volume (Units) Forecast by Imaging Modality, 2020-2035
  • Table 125: ASEAN Countries Market Value (USD Million) Forecast by End User, 2020-2035
  • Table 126: ASEAN Countries Market Volume (Units) Forecast by End User, 2020-2035
  • Table 127: Australia & New Zealand Market Value (USD Million) Forecast by Autonomy Class, 2020-2035
  • Table 128: Australia & New Zealand Market Volume (Units) Forecast by Autonomy Class, 2020-2035
  • Table 129: Australia & New Zealand Market Value (USD Million) Forecast by Imaging Modality, 2020-2035
  • Table 130: Australia & New Zealand Market Volume (Units) Forecast by Imaging Modality, 2020-2035
  • Table 131: Australia & New Zealand Market Value (USD Million) Forecast by End User, 2020-2035
  • Table 132: Australia & New Zealand Market Volume (Units) Forecast by End User, 2020-2035
  • Table 133: Brazil Market Value (USD Million) Forecast by Autonomy Class, 2020-2035
  • Table 134: Brazil Market Volume (Units) Forecast by Autonomy Class, 2020-2035
  • Table 135: Brazil Market Value (USD Million) Forecast by Imaging Modality, 2020-2035
  • Table 136: Brazil Market Volume (Units) Forecast by Imaging Modality, 2020-2035
  • Table 137: Brazil Market Value (USD Million) Forecast by End User, 2020-2035
  • Table 138: Brazil Market Volume (Units) Forecast by End User, 2020-2035
  • Table 139: Chile Market Value (USD Million) Forecast by Autonomy Class, 2020-2035
  • Table 140: Chile Market Volume (Units) Forecast by Autonomy Class, 2020-2035
  • Table 141: Chile Market Value (USD Million) Forecast by Imaging Modality, 2020-2035
  • Table 142: Chile Market Volume (Units) Forecast by Imaging Modality, 2020-2035
  • Table 143: Chile Market Value (USD Million) Forecast by End User, 2020-2035
  • Table 144: Chile Market Volume (Units) Forecast by End User, 2020-2035
  • Table 145: Saudi Arabia Market Value (USD Million) Forecast by Autonomy Class, 2020-2035
  • Table 146: Saudi Arabia Market Volume (Units) Forecast by Autonomy Class, 2020-2035
  • Table 147: Saudi Arabia Market Value (USD Million) Forecast by Imaging Modality, 2020-2035
  • Table 148: Saudi Arabia Market Volume (Units) Forecast by Imaging Modality, 2020-2035
  • Table 149: Saudi Arabia Market Value (USD Million) Forecast by End User, 2020-2035
  • Table 150: Saudi Arabia Market Volume (Units) Forecast by End User, 2020-2035
  • Table 151: Turkey Market Value (USD Million) Forecast by Autonomy Class, 2020-2035
  • Table 152: Turkey Market Volume (Units) Forecast by Autonomy Class, 2020-2035
  • Table 153: Turkey Market Value (USD Million) Forecast by Imaging Modality, 2020-2035
  • Table 154: Turkey Market Volume (Units) Forecast by Imaging Modality, 2020-2035
  • Table 155: Turkey Market Value (USD Million) Forecast by End User, 2020-2035
  • Table 156: Turkey Market Volume (Units) Forecast by End User, 2020-2035
  • Table 157: South Africa Market Value (USD Million) Forecast by Autonomy Class, 2020-2035
  • Table 158: South Africa Market Volume (Units) Forecast by Autonomy Class, 2020-2035
  • Table 159: South Africa Market Value (USD Million) Forecast by Imaging Modality, 2020-2035
  • Table 160: South Africa Market Volume (Units) Forecast by Imaging Modality, 2020-2035
  • Table 161: South Africa Market Value (USD Million) Forecast by End User, 2020-2035
  • Table 162: South Africa Market Volume (Units) Forecast by End User, 2020-2035
  • Table 163: Global Market Y-o-Y Growth Analysis by Region, 2021-2035
  • Table 164: Global Market Y-o-Y Growth Analysis by Autonomy Class, 2021-2035
  • Table 165: Global Market Y-o-Y Growth Analysis by Imaging Modality, 2021-2035
  • Table 166: Global Market Y-o-Y Growth Analysis by End User, 2021-2035
  • Table 167: Global Market Absolute $ Opportunity Analysis by Region, 2025-2035
  • Table 168: Global Market Absolute $ Opportunity Analysis by Autonomy Class, 2025-2035
  • Table 169: Global Market Absolute $ Opportunity Analysis by Imaging Modality, 2025-2035
  • Table 170: Global Market Absolute $ Opportunity Analysis by End User, 2025-2035
  • Table 171: Global Market Pricing Analysis by Region, 2020-2035
  • Table 172: Global Market Pricing Analysis by Autonomy Class, 2020-2035
  • Table 173: Global Market Pricing Analysis by Imaging Modality, 2020-2035
  • Table 174: Global Market Pricing Analysis by End User, 2020-2035
  • Table 175: Mendaera Company Profile and Financial Analysis
  • Table 176: THINK Surgical Company Profile and Financial Analysis
  • Table 177: Nuviswiss Company Profile and Financial Analysis
  • Table 178: OrthAlign Company Profile and Financial Analysis
  • Table 179: Global Market Competitive Landscape Analysis
  • Table 180: Global Market Share Analysis by Key Players, 2024
  • Table 181: Global Market Technology Roadmap Analysis, 2020-2035
  • Table 182: Global Market Investment Analysis by Region, 2020-2035
  • Table 183: Global Market Regulatory Framework Analysis by Region
  • Table 184: Global Market Supply Chain Participant Analysis
  • Table 185: Global Market Value Chain Analysis
  • Table 186: Global Market Raw Material Suppliers Analysis
  • Table 187: Global Market Distribution Channel Analysis
  • Table 188: Global Market PESTLE Analysis by Region
  • Table 189: Global Market Porter's Five Forces Analysis
  • Table 190: Global Market Product Life Cycle Analysis by Autonomy Class
  • Table 191: Global Market Innovation Timeline Analysis
  • Table 192: Global Market Opportunity Map Analysis by Segment
  • Table 193: Global Market Investment Feasibility Matrix
  • Table 194: Global Market Risk Assessment Analysis
  • Table 195: Global Market Growth Scenario Analysis (Optimistic/Likely/Conservative)
  • Table 196: Global Market Key Success Factors Analysis
  • Table 197: Global Market Merger & Acquisition Analysis, 2020-2024
  • Table 198: Global Market Patent Analysis by Technology
  • Table 199: Global Market Clinical Trial Analysis by Indication
  • Table 200: Global Market Reimbursement Landscape Analysis by Region
  • Table 201: Global Market Healthcare Infrastructure Analysis by Country
  • Table 202: Global Market Surgeon Training Program Analysis
  • Table 203: Global Market Hospital Adoption Rate Analysis
  • Table 204: Global Market Technology Comparison Matrix
  • Table 205: Global Market Cost-Benefit Analysis by End User
  • Table 206: Global Market Patient Outcome Analysis
  • Table 207: Global Market Surgical Volume Analysis by Application
  • Table 208: Global Market Equipment Utilization Rate Analysis
  • Table 209: Global Market Maintenance Cost Analysis
  • Table 210: Global Market Training Cost Analysis by Region
  • Table 211: Global Market Return on Investment Analysis
  • Table 212: Global Market Penetration Analysis by Country
  • Table 213: Global Market Customer Satisfaction Analysis
  • Table 214: Global Market Brand Loyalty Analysis
  • Table 215: Global Market Distribution Partner Analysis
  • Table 216: Global Market Service Provider Analysis
  • Table 217: Global Market Aftermarket Services Analysis
  • Table 218: Global Market Warranty Analysis by Manufacturer
  • Table 219: Global Market Financing Options Analysis
  • Table 220: Global Market Leasing vs Purchase Analysis

List of Figures

  • Figure 1: Global Market Value (USD Million) by Autonomy Class, 2025-2035
  • Figure 2: Global Market Value (USD Million) by Imaging Modality, 2025-2035
  • Figure 3: Global Market Value (USD Million) by End User, 2025-2035
  • Figure 4: Global Market Value (USD Million) by Region, 2025-2035
  • Figure 5: Global Market Value (USD Million) Analysis by Region, 2020-2035
  • Figure 6: Global Market Volume (Units) Analysis by Region, 2020-2035
  • Figure 7: Global Market Value Share (%) and BPS Analysis by Region, 2025-2035
  • Figure 8: Global Market Y-o-Y Growth (%) Projections by Region, 2025-2035
  • Figure 9: Global Market Value (USD Million) Analysis by Autonomy Class, 2020-2035
  • Figure 10: Global Market Volume (Units) Analysis by Autonomy Class, 2020-2035
  • Figure 11: Global Market Value Share (%) and BPS Analysis by Autonomy Class, 2025-2035
  • Figure 12: Global Market Y-o-Y Growth (%) Projections by Autonomy Class, 2025-2035
  • Figure 13: Global Market Value (USD Million) Analysis by Imaging Modality, 2020-2035
  • Figure 14: Global Market Volume (Units) Analysis by Imaging Modality, 2020-2035
  • Figure 15: Global Market Value Share (%) and BPS Analysis by Imaging Modality, 2025-2035
  • Figure 16: Global Market Y-o-Y Growth (%) Projections by Imaging Modality, 2025-2035
  • Figure 17: Global Market Value (USD Million) Analysis by End User, 2020-2035
  • Figure 18: Global Market Volume (Units) Analysis by End User, 2020-2035
  • Figure 19: Global Market Value Share (%) and BPS Analysis by End User, 2025-2035
  • Figure 20: Global Market Y-o-Y Growth (%) Projections by End User, 2025-2035
  • Figure 21: Global Market Attractiveness by Autonomy Class, 2025-2035
  • Figure 22: Global Market Attractiveness by Imaging Modality, 2025-2035
  • Figure 23: Global Market Attractiveness by End User, 2025-2035
  • Figure 24: Global Market Attractiveness by Region, 2025-2035
  • Figure 25: North America Market Value (USD Million) by Autonomy Class, 2025-2035
  • Figure 26: North America Market Value (USD Million) by Imaging Modality, 2025-2035
  • Figure 27: North America Market Value (USD Million) by End User, 2025-2035
  • Figure 28: North America Market Value (USD Million) by Country, 2025-2035
  • Figure 29: North America Market Value (USD Million) Analysis by Country, 2020-2035
  • Figure 30: North America Market Volume (Units) Analysis by Country, 2020-2035
  • Figure 31: North America Market Value Share (%) and BPS Analysis by Country, 2025-2035
  • Figure 32: North America Market Y-o-Y Growth (%) Projections by Country, 2025-2035
  • Figure 33: North America Market Value (USD Million) Analysis by Autonomy Class, 2020-2035
  • Figure 34: North America Market Volume (Units) Analysis by Autonomy Class, 2020-2035
  • Figure 35: North America Market Value Share (%) and BPS Analysis by Autonomy Class, 2025-2035
  • Figure 36: North America Market Y-o-Y Growth (%) Projections by Autonomy Class, 2025-2035
  • Figure 37: North America Market Value (USD Million) Analysis by Imaging Modality, 2020-2035
  • Figure 38: North America Market Volume (Units) Analysis by Imaging Modality, 2020-2035
  • Figure 39: North America Market Value Share (%) and BPS Analysis by Imaging Modality, 2025-2035
  • Figure 40: North America Market Y-o-Y Growth (%) Projections by Imaging Modality, 2025-2035
  • Figure 41: North America Market Value (USD Million) Analysis by End User, 2020-2035
  • Figure 42: North America Market Volume (Units) Analysis by End User, 2020-2035
  • Figure 43: North America Market Value Share (%) and BPS Analysis by End User, 2025-2035
  • Figure 44: North America Market Y-o-Y Growth (%) Projections by End User, 2025-2035
  • Figure 45: North America Market Attractiveness by Autonomy Class, 2025-2035
  • Figure 46: North America Market Attractiveness by Imaging Modality, 2025-2035
  • Figure 47: North America Market Attractiveness by End User, 2025-2035
  • Figure 48: North America Market Attractiveness by Country, 2025-2035
  • Figure 49: Europe Market Value (USD Million) by Autonomy Class, 2025-2035
  • Figure 50: Europe Market Value (USD Million) by Imaging Modality, 2025-2035
  • Figure 51: Europe Market Value (USD Million) by End User, 2025-2035
  • Figure 52: Europe Market Value (USD Million) by Country, 2025-2035
  • Figure 53: Europe Market Value (USD Million) Analysis by Country, 2020-2035
  • Figure 54: Europe Market Volume (Units) Analysis by Country, 2020-2035
  • Figure 55: Europe Market Value Share (%) and BPS Analysis by Country, 2025-2035
  • Figure 56: Europe Market Y-o-Y Growth (%) Projections by Country, 2025-2035
  • Figure 57: Europe Market Value (USD Million) Analysis by Autonomy Class, 2020-2035
  • Figure 58: Europe Market Volume (Units) Analysis by Autonomy Class, 2020-2035
  • Figure 59: Europe Market Value Share (%) and BPS Analysis by Autonomy Class, 2025-2035
  • Figure 60: Europe Market Y-o-Y Growth (%) Projections by Autonomy Class, 2025-2035
  • Figure 61: Europe Market Value (USD Million) Analysis by Imaging Modality, 2020-2035
  • Figure 62: Europe Market Volume (Units) Analysis by Imaging Modality, 2020-2035
  • Figure 63: Europe Market Value Share (%) and BPS Analysis by Imaging Modality, 2025-2035
  • Figure 64: Europe Market Y-o-Y Growth (%) Projections by Imaging Modality, 2025-2035
  • Figure 65: Europe Market Value (USD Million) Analysis by End User, 2020-2035
  • Figure 66: Europe Market Volume (Units) Analysis by End User, 2020-2035
  • Figure 67: Europe Market Value Share (%) and BPS Analysis by End User, 2025-2035
  • Figure 68: Europe Market Y-o-Y Growth (%) Projections by End User, 2025-2035
  • Figure 69: Europe Market Attractiveness by Autonomy Class, 2025-2035
  • Figure 70: Europe Market Attractiveness by Imaging Modality, 2025-2035
  • Figure 71: Europe Market Attractiveness by End User, 2025-2035
  • Figure 72: Europe Market Attractiveness by Country, 2025-2035
  • Figure 73: Asia Pacific Market Value (USD Million) by Autonomy Class, 2025-2035
  • Figure 74: Asia Pacific Market Value (USD Million) by Imaging Modality, 2025-2035
  • Figure 75: Asia Pacific Market Value (USD Million) by End User, 2025-2035
  • Figure 76: Asia Pacific Market Value (USD Million) by Country, 2025-2035
  • Figure 77: Asia Pacific Market Value (USD Million) Analysis by Country, 2020-2035
  • Figure 78: Asia Pacific Market Volume (Units) Analysis by Country, 2020-2035
  • Figure 79: Asia Pacific Market Value Share (%) and BPS Analysis by Country, 2025-2035
  • Figure 80: Asia Pacific Market Y-o-Y Growth (%) Projections by Country, 2025-2035
  • Figure 81: Asia Pacific Market Value (USD Million) Analysis by Autonomy Class, 2020-2035
  • Figure 82: Asia Pacific Market Volume (Units) Analysis by Autonomy Class, 2020-2035
  • Figure 83: Asia Pacific Market Value Share (%) and BPS Analysis by Autonomy Class, 2025-2035
  • Figure 84: Asia Pacific Market Y-o-Y Growth (%) Projections by Autonomy Class, 2025-2035
  • Figure 85: Asia Pacific Market Value (USD Million) Analysis by Imaging Modality, 2020-2035
  • Figure 86: Asia Pacific Market Volume (Units) Analysis by Imaging Modality, 2020-2035
  • Figure 87: Asia Pacific Market Value Share (%) and BPS Analysis by Imaging Modality, 2025-2035
  • Figure 88: Asia Pacific Market Y-o-Y Growth (%) Projections by Imaging Modality, 2025-2035
  • Figure 89: Asia Pacific Market Value (USD Million) Analysis by End User, 2020-2035
  • Figure 90: Asia Pacific Market Volume (Units) Analysis by End User, 2020-2035
  • Figure 91: Asia Pacific Market Value Share (%) and BPS Analysis by End User, 2025-2035
  • Figure 92: Asia Pacific Market Y-o-Y Growth (%) Projections by End User, 2025-2035
  • Figure 93: Asia Pacific Market Attractiveness by Autonomy Class, 2025-2035
  • Figure 94: Asia Pacific Market Attractiveness by Imaging Modality, 2025-2035
  • Figure 95: Asia Pacific Market Attractiveness by End User, 2025-2035
  • Figure 96: Asia Pacific Market Attractiveness by Country, 2025-2035
  • Figure 97: Latin America Market Value (USD Million) by Autonomy Class, 2025-2035
  • Figure 98: Latin America Market Value (USD Million) by Imaging Modality, 2025-2035
  • Figure 99: Latin America Market Value (USD Million) by End User, 2025-2035
  • Figure 100: Latin America Market Value (USD Million) by Country, 2025-2035
  • Figure 101: Latin America Market Value (USD Million) Analysis by Country, 2020-2035
  • Figure 102: Latin America Market Volume (Units) Analysis by Country, 2020-2035
  • Figure 103: Latin America Market Value Share (%) and BPS Analysis by Country, 2025-2035
  • Figure 104: Latin America Market Y-o-Y Growth (%) Projections by Country, 2025-2035
  • Figure 105: Latin America Market Value (USD Million) Analysis by Autonomy Class, 2020-2035
  • Figure 106: Latin America Market Volume (Units) Analysis by Autonomy Class, 2020-2035
  • Figure 107: Latin America Market Value Share (%) and BPS Analysis by Autonomy Class, 2025-2035
  • Figure 108: Latin America Market Y-o-Y Growth (%) Projections by Autonomy Class, 2025-2035
  • Figure 109: Latin America Market Value (USD Million) Analysis by Imaging Modality, 2020-2035
  • Figure 110: Latin America Market Volume (Units) Analysis by Imaging Modality, 2020-2035
  • Figure 111: Latin America Market Value Share (%) and BPS Analysis by Imaging Modality, 2025-2035
  • Figure 112: Latin America Market Y-o-Y Growth (%) Projections by Imaging Modality, 2025-2035
  • Figure 113: Latin America Market Value (USD Million) Analysis by End User, 2020-2035
  • Figure 114: Latin America Market Volume (Units) Analysis by End User, 2020-2035
  • Figure 115: Latin America Market Value Share (%) and BPS Analysis by End User, 2025-2035
  • Figure 116: Latin America Market Y-o-Y Growth (%) Projections by End User, 2025-2035
  • Figure 117: Latin America Market Attractiveness by Autonomy Class, 2025-2035
  • Figure 118: Latin America Market Attractiveness by Imaging Modality, 2025-2035
  • Figure 119: Latin America Market Attractiveness by End User, 2025-2035
  • Figure 120: Latin America Market Attractiveness by Country, 2025-2035
  • Figure 121: Middle East & Africa Market Value (USD Million) by Autonomy Class, 2025-2035
  • Figure 122: Middle East & Africa Market Value (USD Million) by Imaging Modality, 2025-2035
  • Figure 123: Middle East & Africa Market Value (USD Million) by End User, 2025-2035
  • Figure 124: Middle East & Africa Market Value (USD Million) by Country, 2025-2035
  • Figure 125: Middle East & Africa Market Value (USD Million) Analysis by Country, 2020-2035
  • Figure 126: Middle East & Africa Market Volume (Units) Analysis by Country, 2020-2035
  • Figure 127: Middle East & Africa Market Value Share (%) and BPS Analysis by Country, 2025-2035
  • Figure 128: Middle East & Africa Market Y-o-Y Growth (%) Projections by Country, 2025-2035
  • Figure 129: Middle East & Africa Market Value (USD Million) Analysis by Autonomy Class, 2020-2035
  • Figure 130: Middle East & Africa Market Volume (Units) Analysis by Autonomy Class, 2020-2035
  • Figure 131: Middle East & Africa Market Value Share (%) and BPS Analysis by Autonomy Class, 2025-2035
  • Figure 132: Middle East & Africa Market Y-o-Y Growth (%) Projections by Autonomy Class, 2025-2035
  • Figure 133: Middle East & Africa Market Value (USD Million) Analysis by Imaging Modality, 2020-2035
  • Figure 134: Middle East & Africa Market Volume (Units) Analysis by Imaging Modality, 2020-2035
  • Figure 135: Middle East & Africa Market Value Share (%) and BPS Analysis by Imaging Modality, 2025-2035
  • Figure 136: Middle East & Africa Market Y-o-Y Growth (%) Projections by Imaging Modality, 2025-2035
  • Figure 137: Middle East & Africa Market Value (USD Million) Analysis by End User, 2020-2035
  • Figure 138: Middle East & Africa Market Volume (Units) Analysis by End User, 2020-2035
  • Figure 139: Middle East & Africa Market Value Share (%) and BPS Analysis by End User, 2025-2035
  • Figure 140: Middle East & Africa Market Y-o-Y Growth (%) Projections by End User, 2025-2035
  • Figure 141: Middle East & Africa Market Attractiveness by Autonomy Class, 2025-2035
  • Figure 142: Middle East & Africa Market Attractiveness by Imaging Modality, 2025-2035
  • Figure 143: Middle East & Africa Market Attractiveness by End User, 2025-2035
  • Figure 144: Middle East & Africa Market Attractiveness by Country, 2025-2035
  • Figure 145: USA Market Share Analysis by Autonomy Class, 2024
  • Figure 146: USA Market Share Analysis by Imaging Modality, 2024
  • Figure 147: USA Market Share Analysis by End User, 2024
  • Figure 148: Germany Market Share Analysis by Autonomy Class, 2024
  • Figure 149: Germany Market Share Analysis by Imaging Modality, 2024
  • Figure 150: Germany Market Share Analysis by End User, 2024
  • Figure 151: China Market Share Analysis by Autonomy Class, 2024
  • Figure 152: China Market Share Analysis by Imaging Modality, 2024
  • Figure 153: China Market Share Analysis by End User, 2024
  • Figure 154: India Market Share Analysis by Autonomy Class, 2024
  • Figure 155: India Market Share Analysis by Imaging Modality, 2024
  • Figure 156: India Market Share Analysis by End User, 2024
  • Figure 157: Japan Market Share Analysis by Autonomy Class, 2024
  • Figure 158: Japan Market Share Analysis by Imaging Modality, 2024
  • Figure 159: Japan Market Share Analysis by End User, 2024
  • Figure 160: Brazil Market Share Analysis by Autonomy Class, 2024
  • Figure 161: Brazil Market Share Analysis by Imaging Modality, 2024
  • Figure 162: Brazil Market Share Analysis by End User, 2024
  • Figure 163: France Market Share Analysis by Autonomy Class, 2024
  • Figure 164: France Market Share Analysis by Imaging Modality, 2024
  • Figure 165: France Market Share Analysis by End User, 2024
  • Figure 166: UK Market Share Analysis by Autonomy Class, 2024
  • Figure 167: UK Market Share Analysis by Imaging Modality, 2024
  • Figure 168: UK Market Share Analysis by End User, 2024
  • Figure 169: Global Market Competition Dashboard
  • Figure 170: Global Market Competition Benchmarking
  • Figure 171: Global Market Share Analysis by Regional, 2024
  • Figure 172: Global Market Share Analysis by Autonomy Class, 2024
  • Figure 173: Global Market Share Analysis by Imaging Modality, 2024
  • Figure 174: Global Market Share Analysis by End User, 2024
  • Figure 175: Mendaera Product Portfolio Analysis
  • Figure 176: Mendaera Sales Footprint Analysis
  • Figure 177: Mendaera Market Share by Region, 2024
  • Figure 178: THINK Surgical Product Portfolio Analysis
  • Figure 179: THINK Surgical Sales Footprint Analysis
  • Figure 180: THINK Surgical Market Share by Region, 2024
  • Figure 181: Nuviswiss Product Portfolio Analysis
  • Figure 182: Nuviswiss Sales Footprint Analysis
  • Figure 183: Nuviswiss Market Share by Region, 2024
  • Figure 184: OrthAlign Product Portfolio Analysis
  • Figure 185: OrthAlign Sales Footprint Analysis
  • Figure 186: OrthAlign Market Share by Region, 2024
  • Figure 187: Global Market Technology Roadmap
  • Figure 188: Global Market Investment Analysis
  • Figure 189: Global Market Regulatory Landscape
  • Figure 190: Global Market Supply Chain Analysis
  • Figure 191: Global Market Value Chain Analysis
  • Figure 192: Global Market PESTLE Analysis
  • Figure 193: Global Market Porter's Five Forces Analysis
  • Figure 194: Global Market Pricing Trend Analysis, 2020-2035
  • Figure 195: Global Market Product Life Cycle Analysis
  • Figure 196: Global Market Innovation Timeline
  • Figure 197: Global Market Opportunity Map Analysis
  • Figure 198: Global Market Investment Feasibility Matrix
  • Figure 199: Global Market Growth Scenario Analysis
  • Figure 200: Global Market Key Success Factors

Frequently Asked Questions

How big is the handheld robotic navigation market in 2025?

The global handheld robotic navigation market is estimated to be valued at USD 8.6 million in 2025.

What will be the size of the handheld robotic navigation market in 2035?

The handheld robotic navigation market is projected to reach USD 20.2 million by 2035.

How much will be the handheld robotic navigation market growth between 2025 and 2035?

The handheld robotic navigation market is expected to grow at an 8.9% CAGR between 2025 and 2035.

What are the key autonomy classes in the handheld robotic navigation market?

The key autonomy classes in the handheld robotic navigation market are robotic stabilization and semi-autonomous execution.

Which end user segment will contribute significant share in the handheld robotic navigation market in 2025?

In terms of end users, hospitals are anticipated to command 51.2% share of the handheld robotic navigation market in 2025.

Explore Similar Insights

Future Market Insights

Handheld Robotic Navigation Market

Chat With

MaRIA

Hi There, I am MaRIA, Your Market Research Intelligence Assistant. How may I help you?