Reports

- Global Locations -

Headquarters

Future Market Insights, Inc.

Christiana Corporate, 200
Continental Drive, Suite 401,
Newark, Delaware - 19713,
United States

T: +1-845-579-5705

Americas

Future Market Insights, Inc.

616 Corporate Way, Suite 2-9018,
Valley Cottage, NY 10989, United States

T: +1-347-918-3531

MEA

Future Market Insights

1602-6 Jumeirah Bay X2 Tower, Plot No: JLT-PH2-X2A,
Jumeirah Lakes Towers, Dubai,
United Arab Emirates

Europe

Future Market Insights

3rd Floor, 207 Regent Street,
W1B 3HH London
United Kingdom

T: + 44 (0) 20 8123 9659
D: +44 (0) 20 3287 4268

Asia Pacific

Future Market Insights

IndiaLand Global Tech Park, Unit UG-1, Behind Grand HighStreet, Phase 1, Hinjawadi, MH, Pune – 411057, India

Global Handheld Tagging Gun Market Outlook from 2024 to 2034

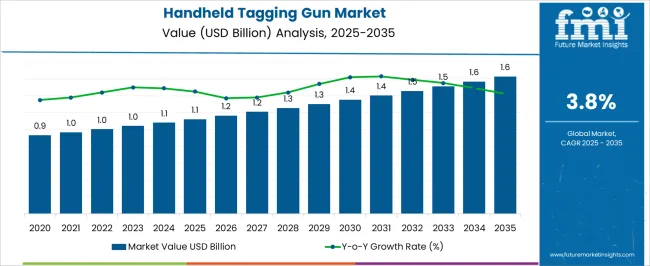
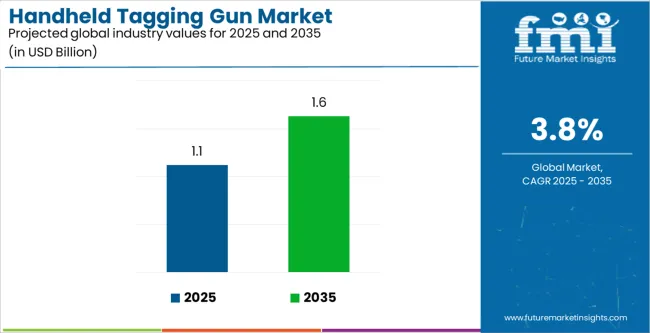
The global handheld tagging gun market is estimated to be valued at US$ 1,080.8 million in 2024. Global sales of handheld tagging guns will likely rise at a CAGR of 3.8% during the forecast period, totaling US$ 1,565.1 million by 2034.

The revenue generated by handheld tagging guns in 2023 was US$ 1,048.8 million and is anticipated to exhibit y-o-y growth of 3.1% in 2024. This can be attributed to rising usage of these tagging solutions across diverse industries.

Attributes Key Insights
Base Market Value (2023) US$ 1,048.8 million
Estimated Handheld Tagging Gun Market Size (2024) US$ 1,080.8 million
Projected Handheld Tagging Gun Market Revenue (2034) US$ 1,565.1 million
Value CAGR (2024 to 2034) 3.8%

Don't pay for what you don't need

Customize your report by selecting specific countries or regions and save 30%!

Key Handheld Tagging Gun Market Highlights

  • The global market for handheld tagging guns is set to expand over 1.4X through 2034, driven by expanding retail sector and growing popularity of RFID labels and barcodes.
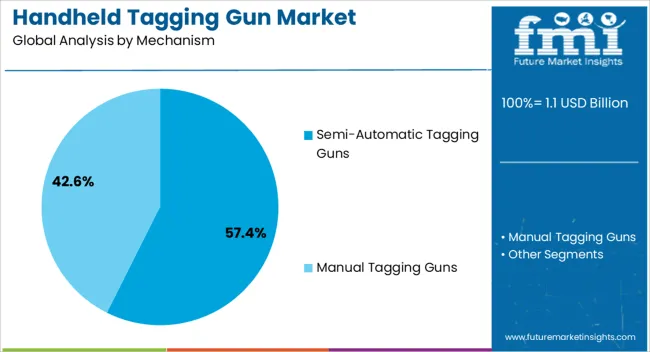
  • Demand is expected to remain high for semi-automatic tagging guns, owing to their adoption across diverse sectors. As per the latest analysis, the target segment will likely account for over 70% of value in the forecast period.
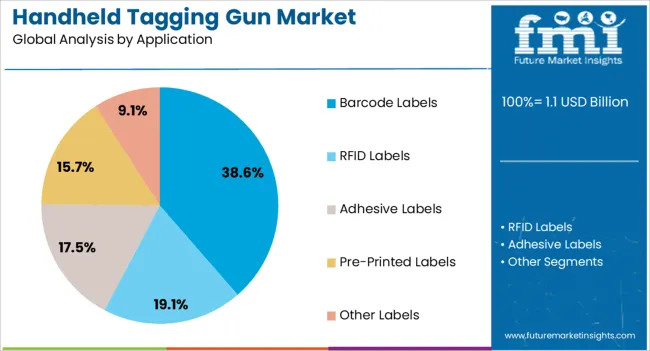
  • Handheld tagging guns are prominently used for attaching RFID labels. As a result, RFID labels lead the handheld tagging gun industry with more than 1/3rd of the value share.
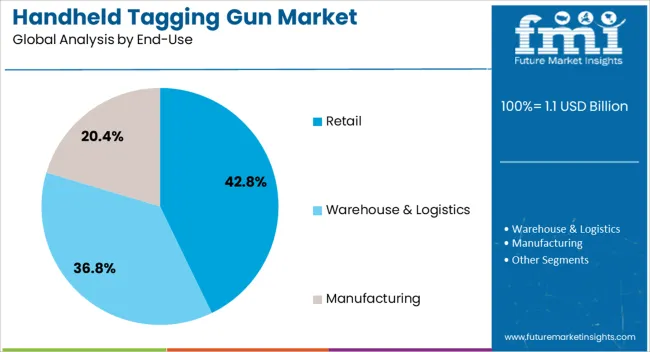
  • Retail sector is expected to remain the leading end user of hand tagging guns. It will likely progress at a CAGR of 4.2% through 2034, capturing around half of the market share.
  • Escalating demand for retail security amid increasing concerns about inventory shrinkage and shoplifting is expected to fuel sales of handheld tagging guns. This is because these guns are an effective way to track inventory and deter theft.

Global Handheld Tagging Gun Market Overview

  • Handheld tagging guns, also known as tag guns or taggers, are becoming essential solutions across several industries. They are widely used to attach price tags or labels to items quickly and efficiently.
  • Growing adoption of handheld tagging guns in clothing stores, fabric shops, warehouses, and other businesses that deal with items requiring labeling is expected to boost the handheld merchandise tagging gun market.
  • The ability of tagging guns to improve productivity and efficiency across end-use industries will likely fuel sales.
  • Different handheld tagging guns, including price tag guns, security tagging guns, and fine fabric tagging guns, are being used by companies to easily and quickly attach tags and labels.
  • Growing usage of RFID labels in retail stores, hypermarkets, and supermarkets is expected to create a need for handheld tagging guns.
  • Rise of e-commerce and omnichannel is creating demand for efficient inventory management. This, in turn, will likely fuel adoption of handheld tagging guns, contributing to retail tagging gun market growth.
Ismail Sutaria
Ismail Sutaria

Principal Consultant

Talk to Analyst

Find your sweet spots for generating winning opportunities in this market.

Key Factors Expected to Drive Growth of the Handheld Tagging Gun Market

  • Expansion of the retail sector and the increasing number of hypermarkets, supermarkets, and brick-and-mortar stores are boosting the demand for tagging guns.
  • Changes in regulations related to product labeling, safety standards, and compliance are expected to fuel sales of handheld tagging guns.
  • Consumer expectations for transparency and product information will likely contribute to growing handheld tagging gun demand.
  • Booming e-commerce sector is expected to create growth opportunities for handheld tagging gun manufacturers.
  • Increasing awareness of counterfeit products is expected to foster growth of the handheld tagging gun industry.
  • Rapid growth of the textile and apparel industry, coupled with rising usage of tagging guns for labeling clothing and accessories, will support market expansion.
  • Easy availability of handheld tagging guns on Amazon and other online shopping platforms is set to benefit the market.

Global Handheld Tagging Gun Market Trends

  • Growing emphasis on ergonomic design to improve user comfort and reduce operator fatigue during extended use
  • Supply chain's digital transformation with RFID and QR codes
  • Rising popularity of omnichannel retail
  • Increasing demand for security and asset tracking
  • Development of more advanced and user-friendly handheld tagging guns with features like GPS tracking
  • Integration with inventory management systems
  • Rising popularity of semi-automatic handheld tagging guns

Get the data you need at a Fraction of the cost

Personalize your report by choosing insights you need
and save 40%!

Historical Performance Vs. Global Handheld Tagging Gun Market Forecast

Global handheld tagging gun sales increased at a CAGR of 1.4% during the historical period. It attained a valuation of US$ 1,048.8 million in 2023. Over the forecast period, the global market for handheld tagging guns is projected to expand at 3.8% CAGR.

  • Rising usage of handheld tagging guns, also known as label guns or price tag guns, for attaching tags or labels to different products is expected to fuel their demand. These guns allow users to efficiently and quickly print and/or attach the labels to the products.
  • Handheld labeling guns help to convey information such as date pricing, tracking number, unit, etc. High adoption of these guns in warehouse and logistics, retail sector, and manufacturing industries for convenient and accurate labeling purposes will likely boost sales growth.
  • The convenience and accuracy offered by handheld tagging guns to attach labels and tags to different entities of products such as fabric, clothes, boxes, and any irregularly shaped material are leading to their wide adoption.
  • Handheld tagging guns offer numerous advantages, including increased accuracy, faster applications, and reduced labor costs. Hence, their demand is expected to grow steadily during the next ten years as companies continue to improve their productivity.
  • Handheld tagging guns allow end users to attach the tags securely to the products without causing damage to the items. These tagging guns are ideal for labeling delicate materials such as silk, leather, fabric, apparel, and electronics.
  • The growing need to label and tag products with accuracy is anticipated to generate demand for handheld tagging guns.
  • Rapid expansion of the retail sector and the swift growth of hypermarkets and supermarkets are expected to foster growth of the handheld tagging gun market.
  • Handheld tagging guns have a major application in the apparel and fashion industry, and the exponential growth of the said sector will likely propel sales of handheld tagging guns.

Understanding Crucial Drivers Impacting Global Handheld Tagging Gun Market

  • Expansion of Retail Sector Driving Demand for Handheld Tagging Guns

The global retail industry has emerged as the most dynamic and fast-paced industry, and many players are entering the market. The way of shopping has undergone many changes in consumer behavior and shopping, thereby creating prospects for handheld tagging guns.

Labeling accuracy and efficiency are critical factors in the retail industry. The tagging guns allow retailers to attach the price tags to the products they sell quickly and efficiently and ensure they are correctly priced for display and sales.

Retailers have to deal with a lot of inventory, and handheld tagging guns can facilitate efficient inventory management as they allow labeling with barcodes, SKUs, etc. Proper labeling helps streamline the tracking, restocking, and order fulfillment process. These handheld tagging guns are an ideal solution for managing these things.

Growth of the retail industry will likely drive the demand for handheld tagging guns by addressing the unique challenges and requirements of retail operations. These tools contribute to operational efficiency, accurate pricing, and improved customer experiences, making them integral to the success of retail businesses.

  • Rapidly Growing Food and Beverage Industry Contributing to Market Growth

The ever-expanding food and beverage industry is also contributing to fueling the growth of the handheld tagging gun market. Growing consumption and changing consumer habits are impacting the food and beverage industry's growth.

The need for efficient labeling, enhanced productivity, and compliance with regulations drives the demand for handheld tagging guns in the food and beverage industry. These guns help streamline operations across various supply chain segments, from production to retail.

Handheld labeling guns are used in the food industry to attach labels and tags for various applications. They can be accommodated anywhere, such as the home pantry and commercial kitchen.

Handheld tagging guns can be used for labeling foods with expiration dates, allergy warnings, and other health-related details, especially in the consumer food service business. Since the food and beverage industry is subjected to strict labeling regulations that ensure customer safety, usage of tags and labels is increasing, creating opportunities for handheld tagging guns.

Handheld tagging guns provide product traceability by labeling them with batch information, which is important for maintaining quality, product recalls, and regulatory information. These guns offer convenience in labeling delicate and perishable products without damaging sensitive products and are efficient in labeling varying weights and sizes.

Semi-annual Market Update

Particular Value CAGR
H1 3.3% (2023 to 2033)
H2 4.2% (2023 to 2033)
H1 3.2% (2024 to 2034)
H2 4.4% (2024 to 2034)

Comparative View of Adjacent Global Handheld Tagging Gun Markets

The section comprehensively evaluates the interrelated markets, including the global label applicator market and the labeling equipment industry. It highlights each market's distinctive characteristics, including their respective CAGRs, while delving into the key factors influencing their growth trajectories.

Global Handheld Tagging Gun Market Analysis:

Attributes Global Handheld Tagging Gun Market Analysis
CAGR (2024 to 2034) 3.8%
Growth Factor Expansion of the retail sector globally is expected to fuel growth of handheld tagging gun market.
Retail Tagging Gun Trends Growing prevalence of online shopping is a key growth-shaping trend.

Global Label Applicator Market Analysis:

Attributes Global Label Applicator Market Analysis
CAGR (2024 to 2034) 4.3%
Growth Factor Rising consumer demand and rising production rates are expected to foster growth of the handheld label applicator market.
Label Applicator Industry Trends Growing need for accuracy, precision, and repeatability in label application on packaging is expected to fuel sales of automatic label applicators.

Global Labeling Equipment Market Analysis:

Attributes Global Labeling Equipment Market Analysis
CAGR (2024 to 2034) 4.9%
Growth Factor Growing demand for accurate and high-speed labeling solutions and adoption of automation in the food & beverage industry are expected to propel labeling equipment sales.
Labeling Equipment Market Trends Rising consumer demand for greater product transparency and the proliferation of the e-commerce industry are key growth-shaping trends.

Country-wise Insights

The table below shows the anticipated growth rates of the top countries. India and China are set to record high CAGRs of 6.8% and 6.1%, respectively, through 2034.

Countries Expected Handheld Tagging Gun Market Value (CAGR)
United States 2.4%
Canada 4.1%
Brazil 2.9%
Mexico 4.3%
Germany 2.9%
France 3.1%
United Kingdom 1.0%
China 6.1%
India 6.8%
Japan 4.6%
GCC Countries 5.3%
South Africa 3.5%

Expanding Retail Sector Propelling Demand in the United States

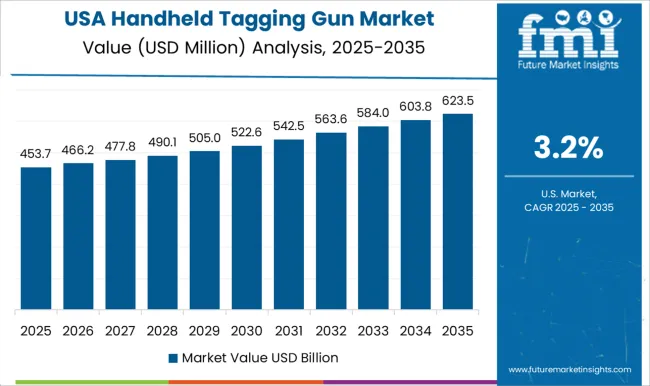
The United States handheld tagging gun market is poised to grow at a steady compound annual growth rate (CAGR) of 2.4% during the forecast period. This is attributable to increasing usage of handheld tagging guns in the thriving retail sector.

The retail sector has undergone enormous changes and accelerated its digital offerings by adapting to consumer demands. This has led to an increase in the demand for efficient inventory management, which is driving the adoption of handheld tagging guns.

The number of retail stores continues to rise across the United States, and the trend will likely continue through 2034. This, in turn, is expected to fuel sales of handheld tagging guns as they are increasingly used in retail stores for tagging labels.

Retail sales in the United States rose by 3.1% from US$ 5,402.3 billion in 2019 to US$ 5,570.4 billion in 2020, as per the USA Census Bureau’s 2020 Annual Retail Trade Survey (ARTS). These stats indicate growth opportunities that the nation can provide to handheld tagging gun manufacturers.

Blooming Apparel and Fashion Industry in India Fueling Sales

As per the latest analysis, India will likely emerge as the most lucrative market for handheld tagging gun manufacturing companies. This is due to expanding apparel & fashion industry in the nation.

Sales of handheld tagging guns in India are projected to rise at 6.8% CAGR throughout the assessment period. By 2034, India's handheld tagging gun market value is predicted to reach US$ 107.5 million.

  • The apparel and garment industry in India is witnessing rapid growth, creating numerous expansion opportunities for the market players. Handheld tagging guns have several applications in the textile and apparel industry, serving as a tool to tag or label products. These guns are used to attach the RFID tags, barcode tags, and price tags directly to the apparel, maintaining the safety and quality of the product.
  • India is among the top garment manufacturing industries, expanding at 14.59% CAGR. By 2028, India’s textile and apparel industry size is expected to reach US$ 387.3 billion, as per the India Brand Equity Foundation (IBEF). This will likely bolster sales of handheld tagging guns.

Category-wise Insights

The table section offers vital insights into leading segments in the handheld tagging gun industry. This can help companies maximize profits and stay ahead of the curve.

Based on application, the RFID labels segment is expected to dominate the global market, exhibiting a CAGR of 3.6% through 2034. By end-use, the retail segment will likely progress at a CAGR of 4.2%.

RFID Labels Segment to Present Lucrative Growth Opportunities for the Market

Application Value CAGR (2024 to 2034)
RFID Labels 3.6%
Barcode Labels 5.1%

Handheld tagging guns are mostly used in attaching RFID labels across different sectors. As per the latest analysis, the RFID labels segment is expected to grow at 3.6% CAGR during the forecast period, reaching a valuation of US$ 540.9 million in 2034.

  • Rising usage of RFID labels across several industries is expected to play a key role in propelling handheld tagging gun demand.
  • RFID labels have come forth as the most used labels in retail stores, e-commerce, as well as in warehouses and logistics. These labels help in product identification, which encourages their adoption across diverse industries. This, in turn, is expected to uplift demand for handheld tagging guns.
  • RFID and QR code labels provide all the necessary information in a single scan and are tamper-proof, making them credible. As a result, they are becoming an essential part of supply chain integration in warehouses and logistics, creating the need for equipment like handheld tagging guns.
  • Handheld tagging guns are significantly used in tagging RFID labels as they serve the digital transformation of the process. Growing importance of RFID labels in supply chain operations and inventory management will likely foster segment growth.

On the other hand, the barcode labels segment is poised to grow at a higher CAGR of 5.1% during the assessment period. This can be attributed to increasing adoption of barcode labels in manufacturing and retail sectors due to increased focus on digitalization.

Flourishing Retail Sector Fueling Handheld Tagging Gun Demand

End-use Value CAGR (2024 to 2034)
Retail 4.2%
Warehouse & Logistics 3.4%

Based on end-use, the retail segment will continue to dominate the handheld tagging gun industry during the forecast period. The target segment is expected to grow at a steady CAGR of 4.2% from 2024 to 2034, driven by rising usage of handheld tagging guns in the retail sector.
  • The retail sector is experiencing rapid growth due to the increasing proliferation of brick-and-mortar stores and online shopping. This will likely create growth opportunities for handheld tagging gun manufacturers.
  • Rising concerns regarding shoplifting and inventory shrinkage are prompting businesses to use different tags, labels, and handheld tagging equipment. This is expected to positively influence handheld tagging gun sales through 2034.
  • Retail stores' massive volume of inventory must be tagged with security tags, labels, and price tags. This is creating a greater need for efficient and fast tagging solutions, like handheld tagging guns.
  • Integration of handheld tagging guns with retail inventory management systems is another key factor expected to drive segment growth.

Global Handheld Tagging Gun Market Competition Analysis

Leading manufacturers of handheld tagging guns are focusing on developing ergonomic and user-friendly designs to differentiate their products. They are incorporating an intuitive interface, comfortable grips, lightweight construction, and add-on features to provide a positive user experience with improved efficiency and less operation fatigue.

New semi-automatic tagging guns with safety features like retractable needles, guards, and trigger locks are being continuously introduced into the market to meet evolving needs of customers.

Several handheld tagging gun companies are also employing strategies like distribution agreements, partnerships, mergers, and acquisitions to stay ahead of the competition.

Recent Developments in the Global Handheld Tagging Gun Market

  • In September 2022, Avery Dennison Corp. unveiled a new direct thermal liner-less label platform designed for variable information labels. This platform is specifically targeted for use in e-commerce, food delivery and pickup, quick-service restaurants, weigh scales, as well as transportation and logistics applications.
  • In May 2023, Sato Holding Corp. announced the acquisition of Stafford Press, Inc. through its group company SATO International America, Inc.

Key Coverage in the Global Handheld Tagging Gun Market Research Report

  • Adjacent Study on Global Price Tagging Gun Market, Labeling Gun Market, Handheld Barcode Labeler Market, Garment Tagging Gun Market and Handheld Labeler Market
  • Detailed Analysis of Global Handheld Labeling Machine Market
  • Top Tag Gun Manufacturers and Suppliers in India and Other Nations
  • A Separate Chapter Dedicated to Manual Tagging Gun Market Vs. Semi-automatic Tagging Gun Market Analysis
  • Details of Popular Professional Anti-theft Barcode Tag Guns
  • Tag Gun Price in India

Global Handheld Tagging Gun Market Report Scope

Attribute Details
Estimated Market Value (2024) US$ 1,080.8 million
Projected Market Size (2034) US$ 1,565.1 million
Anticipated Growth Rate (2024 to 2034) 3.8% CAGR
Historical Data 2019 to 2023
Forecast Period 2024 to 2034
Quantitative Units Revenue in US$ million, Volume in Units, and CAGR from 2024 to 2034
Report Coverage Revenue Forecast, Volume Forecast, Company Ranking, Competitive Landscape, Growth Factors, Trends and Pricing Analysis
Segments Covered
  • Mechanism
  • Application
  • End Use
  • Region
Key Regions Covered
  • North America
  • Latin America
  • Europe
  • Asia Pacific
  • Middle East & Africa
Key Companies Profiled
  • Avery Dennison Corporation
  • SATO Holdings Corporation
  • Brady Corporation
  • Healthmark Industries Company, Inc.
  • Meto International GmbH
  • Garvey Applications
  • START International
  • Motex Applications Co. Ltd.
  • Towa Seiko Co. Ltd.
  • DayMark Safety Systems
  • Lotus Labels
  • HALCO Europe
  • JAY GROUP OF COMPANIES
  • Hardy Diagnostics
  • Weber Packaging Solutions

Global Handheld Tagging Gun Market Segmentation

By Mechanism:

  • Semi-automatic Tagging Guns
  • Manual Tagging Guns

By Application:

  • RFID Labels
  • Barcode Labels
  • Adhesive Labels
  • Pre-printed Labels
  • Other Labels

By End-use:

  • Retail
  • Warehouse & Logistics
  • Manufacturing
    • Food & Beverage
    • Healthcare & Pharmaceutical
    • Apparel & Fashion
    • Others

By Region:

  • North America
  • Latin America
  • Europe
  • Asia Pacific
  • Middle East & Africa

Frequently Asked Questions

How big is the handheld tagging gun market?

The handheld tagging gun market size is estimated to reach US$ 1,080.8 million in 2024.

What is the demand outlook for handheld tagging guns?

Global handheld tagging gun demand is set to grow at 3.8% CAGR through 2034.

What is the expected market size for 2034?

The handheld tagging gun market value is anticipated to reach US$ 1,565.1 million in 2034.

What is driving the handheld tagging gun industry?

Expansion of the retail sector is a key factor driving the target industry.

Who are the top 3 players in the handheld tagging gun market?

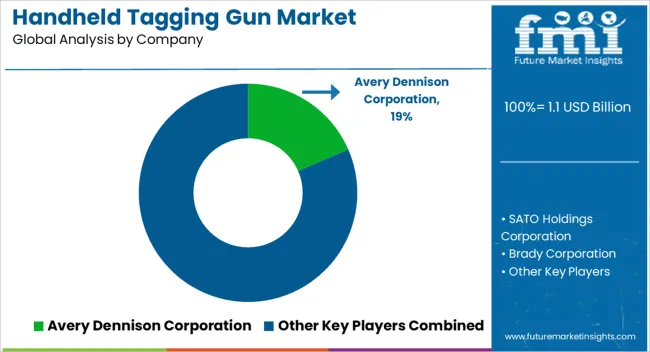
Avery Dennison Corporation, Brady Corporation and SATO Holdings Corporation.

What are tagging guns used for?

Tagging guns are used to attach price tags or labels to products.

Table of Content

1. Executive Summary

    1.1. Global Market Outlook

    1.2. Demand Side Trends

    1.3. Supply Side Trends

    1.4. Technology Roadmap

    1.5. Future Market Insights (FMI) Analysis and Recommendations

2. Market Overview

    2.1. Market Coverage / Taxonomy

    2.2. Market Definition / Scope / Limitations

3. Key Market Trends

    3.1. Key Trends Impacting the Market

    3.2. Product Innovation / Development Trends

4. Key Success Factors

    4.1. Product Adoption / Usage Analysis

    4.2. Product USP’s / Features

    4.3. Strategic Promotional Strategies

    4.4. Go-to-market Strategies

5. Global Market Demand Analysis 2019 to 2023 and Forecast, 2024 to 2034

    5.1. Historical Market Volume (Units) Analysis, 2019 to 2023

    5.2. Current and Future Market Volume (Units) Projections, 2024 to 2034

    5.3. Y-o-Y Growth Trend Analysis

6. Global Market - Pricing Analysis

    6.1. Country Wise Pricing Analysis By Mechanism

    6.2. Global Average Pricing Analysis Benchmark

7. Global Market Demand (in Value or Size in US$ million) Analysis 2019 to 2023 and Forecast, 2024 to 2034

    7.1. Historical Market Value (US$ million) Analysis, 2019 to 2023

    7.2. Current and Future Market Value (US$ million) Projections, 2024 to 2034

        7.2.1. Y-o-Y Growth Trend Analysis

        7.2.2. Absolute $ Opportunity Analysis

8. Market Background

    8.1. Global Packaging Market Overview

    8.2. In-house vs Contract Manufacturing Market Overview for Handheld Tagging Guns

    8.3. Macro-Economic Factors

    8.4. Forecast Factors - Relevance & Impact

    8.5. Value Chain Analysis

        8.5.1. Exhaustive List of Component/Parts Suppliers

        8.5.2. Exhaustive List of Manufacturers

        8.5.3. Exhaustive List of End Users /Customers

    8.6. Case-based Scenario - Impact Assessment

        8.6.1. Current Statistics

        8.6.2. Short-Mid-Long Term Outlook

        8.6.3. Likely Rebound

    8.7. Market Dynamics

        8.7.1. Drivers

        8.7.2. Restraints

        8.7.3. Opportunity Analysis

    8.8. Supply Demand Analysis

9. Global Market Analysis 2019 to 2023 and Forecast 2024 to 2034, By Mechanism

    9.1. Historical Market Size (US$ million) and Volume (Units) Analysis, By Mechanism, 2019 to 2023

    9.2. Current and Future Market Size (US$ million) and Volume (Units) Analysis and Forecast, By Mechanism, 2024 to 2034

        9.2.1. Semi-automatic Tagging Gun

        9.2.2. Manual Tagging Gun

10. Global Market Analysis 2019 to 2023 and Forecast 2024 to 2034, By Application

    10.1. Introduction / Key Findings

    10.2. Historical Market Size (US$ million) and Volume (Units) Analysis, By Application, 2019 to 2023

    10.3. Current and Future Market Size (US$ million) and Volume (Units) Analysis and Forecast, By Application, 2024 to 2034

        10.3.1. RFID Labels

        10.3.2. Barcode Labels

        10.3.3. Adhesive Labels

        10.3.4. Pre-printed Labels

        10.3.5. Other Labels

    10.4. Market Attractiveness Analysis, By Application

11. Global Market Analysis 2019 to 2023 and Forecast 2024 to 2034, By End Use

    11.1. Introduction / Key Findings

    11.2. Historical Market Size (US$ million) and Volume (Units) Analysis, By End Use, 2019 to 2023

    11.3. Current and Future Market Size (US$ million) and Volume (Units) Analysis and Forecast, By End Use, 2024 to 2034

        11.3.1. Retail

        11.3.2. Warehouse & Logistics

        11.3.3. Manufacturing

            11.3.3.1. Food & Beverage

            11.3.3.2. Healthcare & Pharmaceutical

            11.3.3.3. Apparel & Fashion

            11.3.3.4. Others

    11.4. Market Attractiveness Analysis, By End Use

12. Global Market Analysis 2019 to 2023 and Forecast 2024 to 2034, by Region

    12.1. Introduction / Key Findings

    12.2. Historical Market Size (US$ million) and Volume (Units) Analysis, By Region, 2019 to 2023

    12.3. Current and Future Market Size (US$ million) and Volume (Units) Analysis and Forecast, By Region, 2024 to 2034

        12.3.1. North America

        12.3.2. Latin America

        12.3.3. Europe

        12.3.4. Asia Pacific

        12.3.5. Middle East and Africa

    12.4. Market Attractiveness Analysis, By Region

13. North America Market Analysis 2019 to 2023 and Forecast 2024 to 2034

    13.1. Introduction / Key Findings

    13.2. Historical Market Size (US$ million) and Volume (Units) Analysis by Market Taxonomy, 2019 to 2023

    13.3. Current Market Size (US$ million) and Volume (Units) Analysis and Forecast by Market Taxonomy, 2024 to 2034

        13.3.1. By Country

            13.3.1.1. United States

            13.3.1.2. Canada

            13.3.1.3. Mexico

        13.3.2. By Mechanism

        13.3.3. By Application

        13.3.4. By End Use

    13.4. Market Attractiveness Analysis

        13.4.1. By Country

        13.4.2. By Mechanism

        13.4.3. By Application

        13.4.4. By End Use

14. Latin America Market Analysis 2019 to 2023 and Forecast 2024 to 2034

    14.1. Introduction / Key Findings

    14.2. Historical Market Size (US$ million) and Volume (Units) Analysis by Market Taxonomy, 2019 to 2023

    14.3. Current Market Size (US$ million) and Volume (Units) Analysis and Forecast by Market Taxonomy, 2024 to 2034

        14.3.1. By Country

            14.3.1.1. Brazil

            14.3.1.2. Chile

            14.3.1.3. Peru

            14.3.1.4. Rest of Latin America

        14.3.2. By Mechanism

        14.3.3. By Application

        14.3.4. By End Use

    14.4. Market Attractiveness Analysis

        14.4.1. By Country

        14.4.2. By Mechanism

        14.4.3. By Application

        14.4.4. By End Use

15. Asia Pacific Market Analysis 2019 to 2023 and Forecast 2024 to 2034

    15.1. Introduction / Key Findings

    15.2. Historical Market Size (US$ million) and Volume (Units) Analysis by Market Taxonomy, 2019 to 2023

    15.3. Current Market Size (US$ million) and Volume (Units) Analysis and Forecast by Market Taxonomy, 2024 to 2034

        15.3.1. By Country

            15.3.1.1. China

            15.3.1.2. Japan

            15.3.1.3. South Korea

            15.3.1.4. India

            15.3.1.5. Rest of Asia Pacific

        15.3.2. By Mechanism

        15.3.3. By Application

        15.3.4. By End Use

    15.4. Market Attractiveness Analysis

        15.4.1. By Country

        15.4.2. By Mechanism

        15.4.3. By Application

        15.4.4. By End Use

16. Europe Market Analysis 2019 to 2023 and Forecast 2024 to 2034

    16.1. Introduction / Key Findings

    16.2. Historical Market Size (US$ million) and Volume (Units) Analysis by Market Taxonomy, 2019 to 2023

    16.3. Current Market Size (US$ million) and Volume (Units) Analysis and Forecast by Market Taxonomy, 2024 to 2034

        16.3.1. By Country

            16.3.1.1. Germany

            16.3.1.2. France

            16.3.1.3. Spain

            16.3.1.4. Italy

            16.3.1.5. United Kingdom

            16.3.1.6. BENELUX

            16.3.1.7. Nordics

            16.3.1.8. Rest of Europe

        16.3.2. By Mechanism

        16.3.3. By Application

        16.3.4. By End Use

    16.4. Market Attractiveness Analysis

        16.4.1. By Country

        16.4.2. By Mechanism

        16.4.3. By Application

        16.4.4. By End Use

17. Middle East & Africa Market Analysis 2019 to 2023 and Forecast 2024 to 2034

    17.1. Introduction / Key Findings

    17.2. Historical Market Size (US$ million) and Volume (Units) Analysis by Market Taxonomy, 2019 to 2023

    17.3. Current Market Size (US$ million) and Volume (Units) Analysis and Forecast by Market Taxonomy, 2024 to 2034

        17.3.1. By Country

            17.3.1.1. Kingdom of Saudi Arabia

            17.3.1.2. United Arab Emirates

            17.3.1.3. Other GCC Countries

            17.3.1.4. Turkiye

            17.3.1.5. Israel

            17.3.1.6. Egypt

            17.3.1.7. South Africa

            17.3.1.8. Rest of Middle East & Africa

        17.3.2. By Mechanism

        17.3.3. By Application

        17.3.4. By End Use

    17.4. Market Attractiveness Analysis

        17.4.1. By Country

        17.4.2. By Mechanism

        17.4.3. By Application

        17.4.4. By End Use

18. Country wise Market Analysis 2024 to 2034

    18.1. Pricing Analysis

    18.2. Cross Section Analysis

    18.3. United States Market Analysis

        18.3.1. By Mechanism

        18.3.2. By Application

        18.3.3. By End Use

    18.4. Canada Market Analysis

        18.4.1. By Mechanism

        18.4.2. By Application

        18.4.3. By End Use

    18.5. Brazil Market Analysis

        18.5.1. By Mechanism

        18.5.2. By Application

        18.5.3. By End Use

    18.6. Mexico Market Analysis

        18.6.1. By Mechanism

        18.6.2. By Application

        18.6.3. By End Use

    18.7. Germany Market Analysis

        18.7.1. By Mechanism

        18.7.2. By Application

        18.7.3. By End Use

    18.8. United Kingdom Market Analysis

        18.8.1. By Mechanism

        18.8.2. By Application

        18.8.3. By End Use

    18.9. Spain Market Analysis

        18.9.1. By Mechanism

        18.9.2. By Application

        18.9.3. By End Use

    18.10. France Market Analysis

        18.10.1. By Mechanism

        18.10.2. By Application

        18.10.3. By End Use

    18.11. China Market Analysis

        18.11.1. By Mechanism

        18.11.2. By Application

        18.11.3. By End Use

    18.12. Japan Market Analysis

        18.12.1. By Mechanism

        18.12.2. By Application

        18.12.3. By End Use

    18.13. India Market Analysis

        18.13.1. By Mechanism

        18.13.2. By Application

        18.13.3. By End Use

    18.14. Australia & New Zealand Market Analysis

        18.14.1. By Mechanism

        18.14.2. By Application

        18.14.3. By End Use

    18.15. GCC Countries Market Analysis

        18.15.1. By Mechanism

        18.15.2. By Application

        18.15.3. By End Use

    18.16. South Africa Market Analysis

        18.16.1. By Mechanism

        18.16.2. By Application

        18.16.3. By End Use

19. Market Structure Analysis

    19.1. Market Analysis by Tier of Companies

    19.2. Market Share Analysis of Top Players

    19.3. Market Presence Analysis

20. Competition Analysis

    20.1. Competition Dashboard

    20.2. Competition Benchmarking

    20.3. Competition Deep Dive/ Portfolio Analysis (Global Based/Operating Key Market Players)

        20.3.1. Avery Dennison Corporation

            20.3.1.1. Overview

            20.3.1.2. Financials

            20.3.1.3. Strategy

            20.3.1.4. Recent Developments

            20.3.1.5. SWOT Analysis

        20.3.2. SATO America

        20.3.3. Brady Corporation

        20.3.4. Healthmark Industries Company, Inc.

        20.3.5. Meto International GmbH

        20.3.6. Garvey Applications

        20.3.7. START International

        20.3.8. Motex Applications Co. Ltd.

        20.3.9. Towa Seiko Co. Ltd.

        20.3.10. DayMark Safety Systems

        20.3.11. Lotus Labels

        20.3.12. HALCO Europe

        20.3.13. JAY GROUP OF COMPANIES

        20.3.14. Hardy Diagnostics

        20.3.15. Weber Packaging Solutions

*The above list is indicative in nature and is subject to change during the course of research

21. Assumptions and Acronyms Used

22. Research Methodology

List of Tables

Table 01: Global Market Value (US$ million) By Mechanism, 2019H to 2034F

Table 02: Global Market Volume (Units) By Mechanism, 2019H to 2034F

Table 03: Global Market Value (US$ million) by Application, 2019H to 2034F

Table 04: Global Market Volume (Units) by Application, 2019H to 2034F

Table 05: Global Market Value (US$ million) by End Use, 2019H to 2034F

Table 06: Global Market Value (US$ million) by End Use, 2019H to 2034F

Table 07: Global Market Volume (Units) by End Use, 2019H to 2034F

Table 08: Global Market Volume (Units) by End Use, 2019H to 2034F

Table 09: Global Market Value (US$ million) by Region, 2019H to 2034F

Table 10: Global Market Volume (Units) by Region, 2019H to 2034F

Table 11: North America Market Value (US$ million) By Mechanism, 2019H to 2034F

Table 12: North America Market Volume (Units) By Mechanism, 2019H to 2034F

Table 13: North America Market Value (US$ million) by Application, 2019H to 2034F

Table 14: North America Market Volume (Units) by Application, 2019H to 2034F

Table 15: North America Market Value (US$ million) by End Use, 2019H to 2034F

Table 16: North America Market Value (US$ million) by End Use, 2019H to 2034F

Table 17: North America Market Volume (Units) by End Use, 2019H to 2034F

Table 18: North America Market Volume (Units) by End Use, 2019H to 2034F

Table 19: North America Market Value (US$ million) by Country, 2019H to 2034F

Table 20: North America Market Volume (Units) by Country, 2019H to 2034F

Table 21: Latin America Market Value (US$ million) By Mechanism, 2019H to 2034F

Table 22: Latin America Market Volume (Units) By Mechanism, 2019H to 2034F

Table 23: Latin America Market Value (US$ million) by Application, 2019H to 2034F

Table 24: Latin America Market Volume (Units) by Application, 2019H to 2034F

Table 25: Latin America Market Value (US$ million) by End Use, 2019H to 2034F

Table 26: Latin America Market Value (US$ million) by End Use, 2019H to 2034F

Table 27: Latin America Market Volume (Units) by End Use, 2019H to 2034F

Table 28: Latin America Market Volume (Units) by End Use, 2019H to 2034F

Table 29: Latin America Market Value (US$ million) by Country, 2019H to 2034F

Table 30: Latin America Market Volume (Units) by Country, 2019H to 2034F

Table 31: Asia Pacific Market Value (US$ million) By Mechanism, 2019H to 2034F

Table 32: Asia Pacific Market Volume (Units) By Mechanism, 2019H to 2034F

Table 33: Asia Pacific Market Value (US$ million) by Application, 2019H to 2034F

Table 34: Asia Pacific Market Volume (Units) by Application, 2019H to 2034F

Table 35: Asia Pacific Market Value (US$ million) by End Use, 2019H to 2034F

Table 36: Asia Pacific Market Value (US$ million) by End Use, 2019H to 2034F

Table 37: Asia Pacific Market Volume (Units) by End Use, 2019H to 2034F

Table 38: Asia Pacific Market Volume (Units) by End Use, 2019H to 2034F

Table 39: Asia Pacific Market Value (US$ million) by Country, 2019H to 2034F

Table 40: Asia Pacific Market Volume (Units) by Country, 2019H to 2034F

Table 41: Europe Market Value (US$ million) By Mechanism, 2019H to 2034F

Table 42: Europe Market Volume (Units) By Mechanism, 2019H to 2034F

Table 43: Europe Market Value (US$ million) by Application, 2019H to 2034F

Table 44: Europe Market Volume (Units) by Application, 2019H to 2034F

Table 45: Europe Market Value (US$ million) by End Use, 2019H to 2034F

Table 46: Europe Market Volume (Units) by End Use, 2019H to 2034F

Table 47: Europe Market Value (US$ million) by Country, 2019H to 2034F

Table 48: Europe Market Volume (Units) by Country, 2019H to 2034F

Table 49: Middle East & Africa Market Value (US$ million) By Mechanism, 2019H to 2034F

Table 50: Middle East & Africa Market Volume (Units) By Mechanism, 2019H to 2034F

Table 51: Middle East & Africa Market Value (US$ million) by Application, 2019H to 2034F

Table 52: Middle East & Africa Market Volume (Units) by Application, 2019H to 2034F

Table 53: Middle East & Africa Market Value (US$ million) by End Use, 2019H to 2034F

Table 54: Middle East & Africa Market Volume (Units) by End Use, 2019H to 2034F

Table 55: Middle East & Africa Market Value (US$ million) by Country, 2019H to 2034F

Table 56: Middle East & Africa Market Volume (Units) by Country, 2019H to 2034F

List of Charts

Figure 01: Global Market Share Analysis, by Mechanism, 2024E to 2034F

Figure 02: Global Market Y-o-Y Analysis, by Mechanism, 2019H to 2034F

Figure 03: Global Market Attractiveness Analysis, by Mechanism, 2024E to 2034F

Figure 04: Global Market Share Analysis, by Application, 2024E to 2034F

Figure 05: Global Market Y-o-Y Analysis, by Application, 2019H to 2034F

Figure 06: Global Market Attractiveness Analysis, by Application, 2024E to 2034F

Figure 07: Global Market Share Analysis, by End Use, 2024E to 2034F

Figure 08: Global Market Y-o-Y Analysis, by End Use, 2019H to 2034F

Figure 09: Global Market Attractiveness Analysis, by End Use, 2024E to 2034F

Figure 10: Global Market Share Analysis, by Region, 2024E to 2034F

Figure 11: Global Market Y-o-Y Analysis, by Region, 2019H to 2034F

Figure 12: Global Market Attractiveness Analysis, by Region, 2024E to 2034F

Figure 13: North America Market Attractiveness Analysis, By Mechanism, 2024E to 2034F

Figure 14: North America Market Y-o-Y Analysis, by Application, 2019H to 2034F

Figure 15: North America Market Value Share Analysis, by End Use 2019H to 2034F

Figure 16: North America Market Share Analysis, by Country, 2024E to 2034F

Figure 17: Latin America Market Y-o-Y Analysis, By Mechanism, 2019H to 2034F

Figure 18: Latin America Market Y-o-Y Analysis, by Application, 2019H to 2034F

Figure 19: Latin America Market Value Share Analysis, by End Use 2019H to 2034F

Figure 20: Latin America Market Share Analysis, by Country, 2024E to 2034F

Figure 21: Asia Pacific Market Y-o-Y Analysis, By Mechanism, 2019H to 2034F

Figure 22: Asia Pacific Market Y-o-Y Analysis, by Application, 2019H to 2034F

Figure 23: Asia Pacific Market Value Share Analysis, by End Use 2019H to 2034F

Figure 24: Asia Pacific Market Share Analysis, by Country, 2024E to 2034F

Figure 25: Europe Market Y-o-Y Analysis, By Mechanism, 2019H to 2034F

Figure 26: Europe Market Y-o-Y Analysis, by Application, 2019H to 2034F

Figure 27: Europe Market Value Share Analysis, by End Use 2019H to 2034F

Figure 28: Europe Market Y-o-Y Analysis, by Country, 2019H to 2034F

Figure 29: Middle East & Africa Market Y-o-Y Analysis, By Mechanism, 2019H to 2034F

Figure 30: Middle East & Africa Market Y-o-Y Analysis, by Application, 2019H to 2034F

Figure 31: Middle East & Africa Market Y-o-Y Analysis, By End Use, 2019H to 2034F

Figure 32: Middle East & Africa Market Y-o-Y Analysis, by Country, 2019H to 2034F

Recommendations

Packaging

Label Applicators Market

Published : July 2023

Packaging

Asset Tags Market

Published : July 2023

Packaging

Labeling Equipment Market

Published : June 2023

Packaging

Integrated Labeling System Market

Published : July 2022

Explore Packaging Insights

View Reports

Handheld Tagging Gun Market